
diff options
Diffstat (limited to 'docs/guides')
33 files changed, 422 insertions, 409 deletions
diff --git a/docs/guides/collect-apache-nginx-web-logs.md b/docs/guides/collect-apache-nginx-web-logs.md index a75a4b1cd7..b4a5254715 100644 --- a/docs/guides/collect-apache-nginx-web-logs.md +++ b/docs/guides/collect-apache-nginx-web-logs.md @@ -16,7 +16,7 @@ You can use the [LTSV log format](http://ltsv.org/), track TLS and cipher usage, ever. In one test on a system with SSD storage, the collector consistently parsed the logs for 200,000 requests in 200ms, using ~30% of a single core. -The [web_log](https://learn.netdata.cloud/docs/agent/collectors/go.d.plugin/modules/weblog/) collector is currently compatible +The [web_log](https://github.com/netdata/go.d.plugin/blob/master/modules/weblog/README.md) collector is currently compatible with [Nginx](https://nginx.org/en/) and [Apache](https://httpd.apache.org/). This guide will walk you through using the new Go-based web log collector to turn the logs these web servers @@ -90,7 +90,7 @@ jobs: ``` Restart Netdata with `sudo systemctl restart netdata`, or the [appropriate -method](/docs/configure/start-stop-restart.md) for your system. Netdata should pick up your web server's access log and +method](https://github.com/netdata/netdata/blob/master/docs/configure/start-stop-restart.md) for your system. Netdata should pick up your web server's access log and begin showing real-time charts! ### Custom log formats and fields @@ -99,7 +99,7 @@ The web log collector is capable of parsing custom Nginx and Apache log formats leave that topic for a separate guide. We do have [extensive -documentation](https://learn.netdata.cloud/docs/agent/collectors/go.d.plugin/modules/weblog/#custom-log-format) on how +documentation](https://github.com/netdata/go.d.plugin/blob/master/modules/weblog/README.md#custom-log-format) on how to build custom parsing for Nginx and Apache logs. ## Tweak web log collector alarms @@ -117,11 +117,11 @@ You can also edit this file directly with `edit-config`: ``` For more information about editing the defaults or writing new alarm entities, see our [health monitoring -documentation](/health/README.md). +documentation](https://github.com/netdata/netdata/blob/master/health/README.md). ## What's next? -Now that you have web log collection up and running, we recommend you take a look at the collector's [documentation](https://learn.netdata.cloud/docs/agent/collectors/go.d.plugin/modules/weblog/) for some ideas of how you can turn these rather "boring" logs into powerful real-time tools for keeping your servers happy. +Now that you have web log collection up and running, we recommend you take a look at the collector's [documentation](https://github.com/netdata/go.d.plugin/blob/master/modules/weblog/README.md) for some ideas of how you can turn these rather "boring" logs into powerful real-time tools for keeping your servers happy. Don't forget to give GitHub user [Wing924](https://github.com/Wing924) a big 👍 for his hard work in starting up the Go refactoring effort. diff --git a/docs/guides/collect-unbound-metrics.md b/docs/guides/collect-unbound-metrics.md index 8edcab102b..5400fd8334 100644 --- a/docs/guides/collect-unbound-metrics.md +++ b/docs/guides/collect-unbound-metrics.md @@ -55,7 +55,7 @@ You may not need to do any more configuration to have Netdata collect your Unbou If you followed the steps above to enable `remote-control` and make your Unbound files readable by Netdata, that should be enough. Restart Netdata with `sudo systemctl restart netdata`, or the [appropriate -method](/docs/configure/start-stop-restart.md) for your system. You should see Unbound metrics in your Netdata +method](https://github.com/netdata/netdata/blob/master/docs/configure/start-stop-restart.md) for your system. You should see Unbound metrics in your Netdata dashboard!  @@ -100,7 +100,7 @@ Netdata will attempt to read `unbound.conf` to get the appropriate `address`, `c `tls_key` parameters. Restart Netdata with `sudo systemctl restart netdata`, or the [appropriate -method](/docs/configure/start-stop-restart.md) for your system. +method](https://github.com/netdata/netdata/blob/master/docs/configure/start-stop-restart.md) for your system. ### Manual setup for a remote Unbound server diff --git a/docs/guides/configure/performance.md b/docs/guides/configure/performance.md index cb52a11416..256d6e854d 100644 --- a/docs/guides/configure/performance.md +++ b/docs/guides/configure/performance.md @@ -18,7 +18,7 @@ threads. Despite collecting 100,000 metrics every second, the Agent still only u single core. But not everyone has such powerful systems at their disposal. For example, you might run the Agent on a cloud VM with -only 512 MiB of RAM, or an IoT device like a [Raspberry Pi](/docs/guides/monitor/pi-hole-raspberry-pi.md). In these +only 512 MiB of RAM, or an IoT device like a [Raspberry Pi](https://github.com/netdata/netdata/blob/master/docs/guides/monitor/pi-hole-raspberry-pi.md). In these cases, reducing Netdata's footprint beyond its already diminutive size can pay big dividends, giving your services more horsepower while still monitoring the health and the performance of the node, OS, hardware, and applications. @@ -33,7 +33,7 @@ enabled, since we want you to experience the full thing. - Familiarity with configuring the Netdata Agent with `edit-config`. If you're not familiar with how to configure the Netdata Agent, read our [node configuration -doc](/docs/configure/nodes.md) before continuing with this guide. This guide assumes familiarity with the Netdata config +doc](https://github.com/netdata/netdata/blob/master/docs/configure/nodes.md) before continuing with this guide. This guide assumes familiarity with the Netdata config directory, using `edit-config`, and the process of uncommenting/editing various settings in `netdata.conf` and other configuration files. @@ -43,11 +43,11 @@ Netdata's performance is primarily affected by **data collection/retention** and You can configure almost all aspects of data collection/retention, and certain aspects of clients accessing data. For example, you can't control how many users might be viewing a local Agent dashboard, [viewing an -infrastructure](/docs/visualize/overview-infrastructure.md) in real-time with Netdata Cloud, or running [Metric -Correlations](https://learn.netdata.cloud/docs/cloud/insights/metric-correlations). +infrastructure](https://github.com/netdata/netdata/blob/master/docs/visualize/overview-infrastructure.md) in real-time with Netdata Cloud, or running [Metric +Correlations](https://github.com/netdata/netdata/blob/master/docs/cloud/insights/metric-correlations.md). The Netdata Agent runs with the lowest possible [process scheduling -policy](/daemon/README.md#netdata-process-scheduling-policy), which is `nice 19`, and uses the `idle` process scheduler. +policy](https://github.com/netdata/netdata/blob/master/daemon/README.md#netdata-process-scheduling-policy), which is `nice 19`, and uses the `idle` process scheduler. Together, these settings ensure that the Agent only gets CPU resources when the node has CPU resources to space. If the node reaches 100% CPU utilization, the Agent is stopped first to ensure your applications get any available resources. In addition, under heavy load, collectors that require disk I/O may stop and show gaps in charts. @@ -80,10 +80,10 @@ seconds, respectively. Every collector and plugin has its own `update every` setting, which you can also change in the `go.d.conf`, `python.d.conf`, or `charts.d.conf` files, or in individual collector configuration files. If the `update every` for an individual collector is less than the global, the Netdata Agent uses the global setting. See the [enable -or configure a collector](/docs/collect/enable-configure.md) doc for details. +or configure a collector](https://github.com/netdata/netdata/blob/master/docs/collect/enable-configure.md) doc for details. To reduce the frequency of an [internal -plugin/collector](/docs/collect/how-collectors-work.md#collector-architecture-and-terminology), open `netdata.conf` and +plugin/collector](https://github.com/netdata/netdata/blob/master/docs/collect/how-collectors-work.md#collector-architecture-and-terminology), open `netdata.conf` and find the appropriate section. For example, to reduce the frequency of the `apps` plugin, which collects and visualizes metrics on application resource utilization: @@ -92,7 +92,7 @@ metrics on application resource utilization: update every = 5 ``` -To [configure an individual collector](/docs/collect/enable-configure.md), open its specific configuration file with +To [configure an individual collector](https://github.com/netdata/netdata/blob/master/docs/collect/enable-configure.md), open its specific configuration file with `edit-config` and look for the `update_every` setting. For example, to reduce the frequency of the `nginx` collector, run `sudo ./edit-config go.d/nginx.conf`: @@ -104,7 +104,7 @@ update_every: 10 ## Disable unneeded plugins or collectors If you know that you don't need an [entire plugin or a specific -collector](/docs/collect/how-collectors-work.md#collector-architecture-and-terminology), you can disable any of them. +collector](https://github.com/netdata/netdata/blob/master/docs/collect/how-collectors-work.md#collector-architecture-and-terminology), you can disable any of them. Keep in mind that if a plugin/collector has nothing to do, it simply shuts down and does not consume system resources. You will only improve the Agent's performance by disabling plugins/collectors that are actively collecting metrics. @@ -139,7 +139,7 @@ modules: ## Lower memory usage for metrics retention -Reduce the disk space that the [database engine](/database/engine/README.md) uses to retain metrics by editing +Reduce the disk space that the [database engine](https://github.com/netdata/netdata/blob/master/database/engine/README.md) uses to retain metrics by editing the `dbengine multihost disk space` option in `netdata.conf`. The default value is `256`, but can be set to a minimum of `64`. By reducing the disk space allocation, Netdata also needs to store less metadata in the node's memory. @@ -147,7 +147,7 @@ The `page cache size` option also directly impacts Netdata's memory usage, but h Reducing the value of `dbengine multihost disk space` does slim down Netdata's resource usage, but it also reduces how long Netdata retains metrics. Find the right balance of performance and metrics retention by using the [dbengine -calculator](/docs/store/change-metrics-storage.md#calculate-the-system-resources-ram-disk-space-needed-to-store-metrics). +calculator](https://github.com/netdata/netdata/blob/master/docs/store/change-metrics-storage.md#calculate-the-system-resources-ram-disk-space-needed-to-store-metrics). All the settings are found in the `[global]` section of `netdata.conf`: @@ -187,11 +187,11 @@ with the following: ## Run Netdata behind Nginx -A dedicated web server like Nginx provides far more robustness than the Agent's internal [web server](/web/README.md). +A dedicated web server like Nginx provides far more robustness than the Agent's internal [web server](https://github.com/netdata/netdata/blob/master/web/README.md). Nginx can handle more concurrent connections, reuse idle connections, and use fast gzip compression to reduce payloads. For details on installing Nginx as a proxy for the local Agent dashboard, see our [Nginx -doc](/docs/Running-behind-nginx.md). +doc](https://github.com/netdata/netdata/blob/master/docs/Running-behind-nginx.md). After you complete Nginx setup according to the doc linked above, we recommend setting `keepalive` to `1024`, and using gzip compression with the following options in the `location /` block: @@ -264,14 +264,14 @@ On the child nodes you should add to `netdata.conf` the following: We hope this guide helped you better understand how to optimize the performance of the Netdata Agent. -Now that your Agent is running smoothly, we recommend you [secure your nodes](/docs/configure/nodes.md) if you haven't +Now that your Agent is running smoothly, we recommend you [secure your nodes](https://github.com/netdata/netdata/blob/master/docs/configure/nodes.md) if you haven't already. Next, dive into some of Netdata's more complex features, such as configuring its health watchdog or exporting metrics to an external time-series database. -- [Interact with dashboards and charts](/docs/visualize/interact-dashboards-charts.md) -- [Configure health alarms](/docs/monitor/configure-alarms.md) -- [Export metrics to external time-series databases](/docs/export/external-databases.md) +- [Interact with dashboards and charts](https://github.com/netdata/netdata/blob/master/docs/visualize/interact-dashboards-charts.md) +- [Configure health alarms](https://github.com/netdata/netdata/blob/master/docs/monitor/configure-alarms.md) +- [Export metrics to external time-series databases](https://github.com/netdata/netdata/blob/master/docs/export/external-databases.md) [](<>) diff --git a/docs/guides/deploy/ansible.md b/docs/guides/deploy/ansible.md index 5ca5beccb2..0472bdc609 100644 --- a/docs/guides/deploy/ansible.md +++ b/docs/guides/deploy/ansible.md @@ -11,7 +11,7 @@ learn_rel_path: "Installation" # Deploy Netdata with Ansible -Netdata's [one-line kickstart](/docs/get-started.mdx) is zero-configuration, highly adaptable, and compatible with tons +Netdata's [one-line kickstart](https://github.com/netdata/netdata/blob/master/docs/get-started.mdx) is zero-configuration, highly adaptable, and compatible with tons of different operating systems and Linux distributions. You can use it on bare metal, VMs, containers, and everything in-between. @@ -105,8 +105,8 @@ two different SSH keys supplied by AWS. ### Edit the `vars/main.yml` file In order to connect your node(s) to your Space in Netdata Cloud, and see all their metrics in real-time in [composite -charts](/docs/visualize/overview-infrastructure.md) or perform [Metric -Correlations](https://learn.netdata.cloud/docs/cloud/insights/metric-correlations), you need to set the `claim_token` +charts](https://github.com/netdata/netdata/blob/master/docs/visualize/overview-infrastructure.md) or perform [Metric +Correlations](https://github.com/netdata/netdata/blob/master/docs/cloud/insights/metric-correlations.md), you need to set the `claim_token` and `claim_room` variables. To find your `claim_token` and `claim_room`, go to Netdata Cloud, then click on your Space's name in the top navigation, @@ -131,7 +131,7 @@ hostname of the node, the playbook disables that local dashboard by setting `web security boost by not allowing any unwanted access to the local dashboard. You can read more about this decision, or other ways you might lock down the local dashboard, in our [node security -doc](https://learn.netdata.cloud/docs/configure/secure-nodes). +doc](https://github.com/netdata/netdata/blob/master/docs/configure/secure-nodes.md). > Curious about why Netdata's dashboard is open by default? Read our [blog > post](https://www.netdata.cloud/blog/netdata-agent-dashboard/) on that zero-configuration design decision. @@ -166,11 +166,11 @@ want to do with Netdata, so use those categories to dive in. Some of the best places to start: -- [Enable or configure a collector](/docs/collect/enable-configure.md) -- [Supported collectors list](/collectors/COLLECTORS.md) -- [See an overview of your infrastructure](/docs/visualize/overview-infrastructure.md) -- [Interact with dashboards and charts](/docs/visualize/interact-dashboards-charts.md) -- [Change how long Netdata stores metrics](/docs/store/change-metrics-storage.md) +- [Enable or configure a collector](https://github.com/netdata/netdata/blob/master/docs/collect/enable-configure.md) +- [Supported collectors list](https://github.com/netdata/netdata/blob/master/collectors/COLLECTORS.md) +- [See an overview of your infrastructure](https://github.com/netdata/netdata/blob/master/docs/visualize/overview-infrastructure.md) +- [Interact with dashboards and charts](https://github.com/netdata/netdata/blob/master/docs/visualize/interact-dashboards-charts.md) +- [Change how long Netdata stores metrics](https://github.com/netdata/netdata/blob/master/docs/store/change-metrics-storage.md) We're looking for more deployment and configuration management strategies, whether via Ansible or other provisioning/infrastructure as code software, such as Chef or Puppet, in our [community diff --git a/docs/guides/export/export-netdata-metrics-graphite.md b/docs/guides/export/export-netdata-metrics-graphite.md index dd742e4540..985ba22415 100644 --- a/docs/guides/export/export-netdata-metrics-graphite.md +++ b/docs/guides/export/export-netdata-metrics-graphite.md @@ -13,9 +13,10 @@ action on these metrics, you may need to develop a stack of monitoring tools tha anomalies and discover root causes faster. We designed Netdata with interoperability in mind. The Agent collects thousands of metrics every second, and then what -you do with them is up to you. You can [store metrics in the database engine](/docs/guides/longer-metrics-storage.md), -or send them to another time series database for long-term storage or further analysis using Netdata's [exporting -engine](/docs/export/external-databases.md). +you do with them is up to you. You +can [store metrics in the database engine](https://github.com/netdata/netdata/blob/master/docs/guides/longer-metrics-storage.md), +or send them to another time series database for long-term storage or further analysis using +Netdata's [exporting engine](https://github.com/netdata/netdata/blob/master/docs/export/external-databases.md). In this guide, we'll show you how to export Netdata metrics to [Graphite](https://graphiteapp.org/) for long-term storage and further analysis. Graphite is a free open-source software (FOSS) tool that collects graphs numeric @@ -29,7 +30,8 @@ Let's get started. ## Install the Netdata Agent -If you don't have the Netdata Agent installed already, visit the [installation guide](/packaging/installer/README.md) +If you don't have the Netdata Agent installed already, visit +the [installation guide](https://github.com/netdata/netdata/blob/master/packaging/installer/README.md) for the recommended instructions for your system. In most cases, you can use the one-line installation script: <OneLineInstallWget/> @@ -63,8 +65,7 @@ docker run -d \ Open your browser and navigate to `http://NODE`, to see the Graphite interface. Nothing yet, but we'll fix that soon enough. -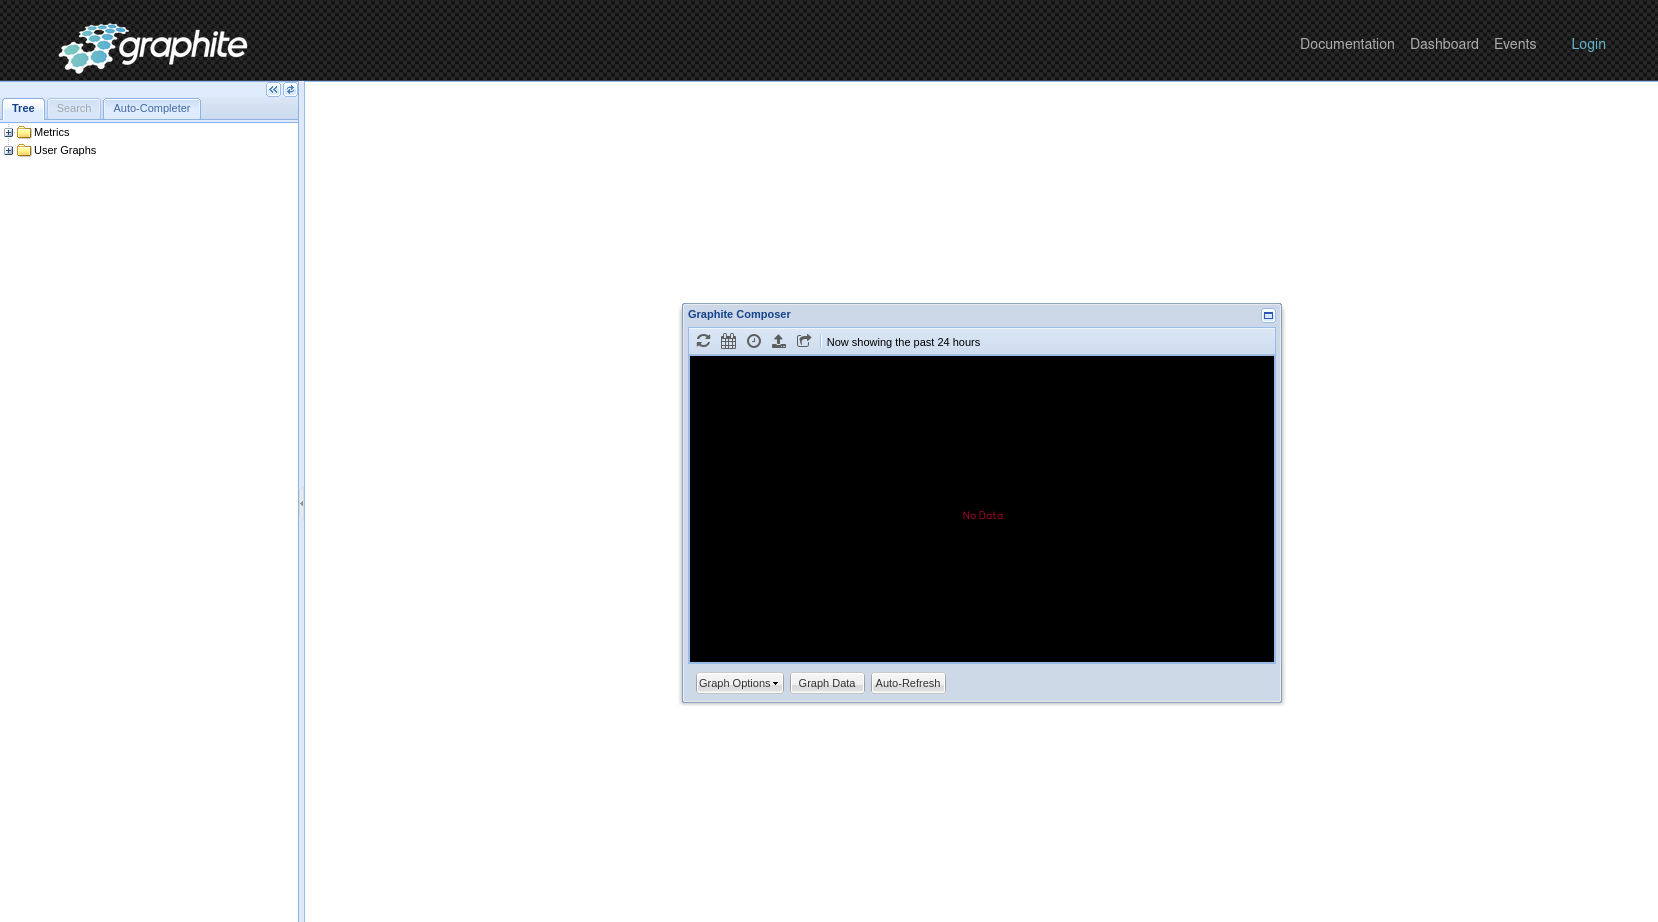 + ## Enable the Graphite exporting connector @@ -115,7 +116,8 @@ the port accordingly. ``` We'll not worry about the rest of the settings for now. Restart the Agent using `sudo systemctl restart netdata`, or the -[appropriate method](/docs/configure/start-stop-restart.md) for your system, to spin up the exporting engine. +[appropriate method](https://github.com/netdata/netdata/blob/master/docs/configure/start-stop-restart.md) for your +system, to spin up the exporting engine. ## See and organize Netdata metrics in Graphite @@ -125,8 +127,7 @@ metrics. You can also navigate directly to `http://NODE/dashboard`. Let's switch the interface to help you understand which metrics Netdata is exporting to Graphite. Click on **Dashboard** and **Configure UI**, then choose the **Tree** option. Refresh your browser to change the UI. -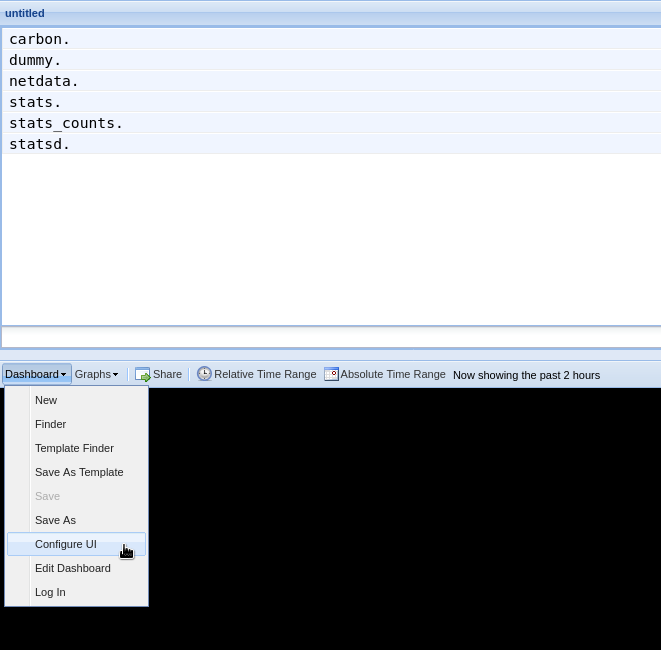 + You should now see a tree of available contexts, including one that matches the hostname of the Agent exporting metrics. In this example, the Agent's hostname is `arcturus`. @@ -138,46 +139,43 @@ in the dashboard. Add a few other system CPU charts to flesh things out. Next, let's combine one or two of these charts. Click and drag one chart onto the other, and wait until the green **Drop to merge** dialog appears. Release to merge the charts. -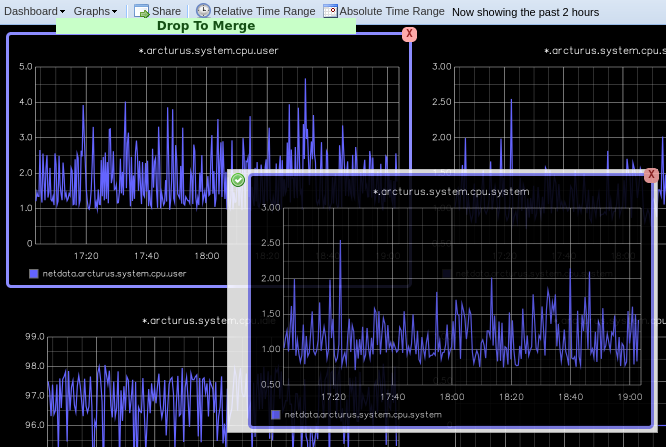 + Finally, save your dashboard. Click **Dashboard**, then **Save As**, then choose a name. Your dashboard is now saved. Of course, this is just the beginning of the customization you can do with Graphite. You can change the time range, share your dashboard with others, or use the composer to customize the size and appearance of specific charts. Learn -more about adding, modifying, and combining graphs in the [Graphite -docs](https://graphite.readthedocs.io/en/latest/dashboard.html). +more about adding, modifying, and combining graphs in +the [Graphite docs](https://graphite.readthedocs.io/en/latest/dashboard.html). ## Monitor the exporting engine As soon as the exporting engine begins, Netdata begins reporting metrics about the system's health and performance. -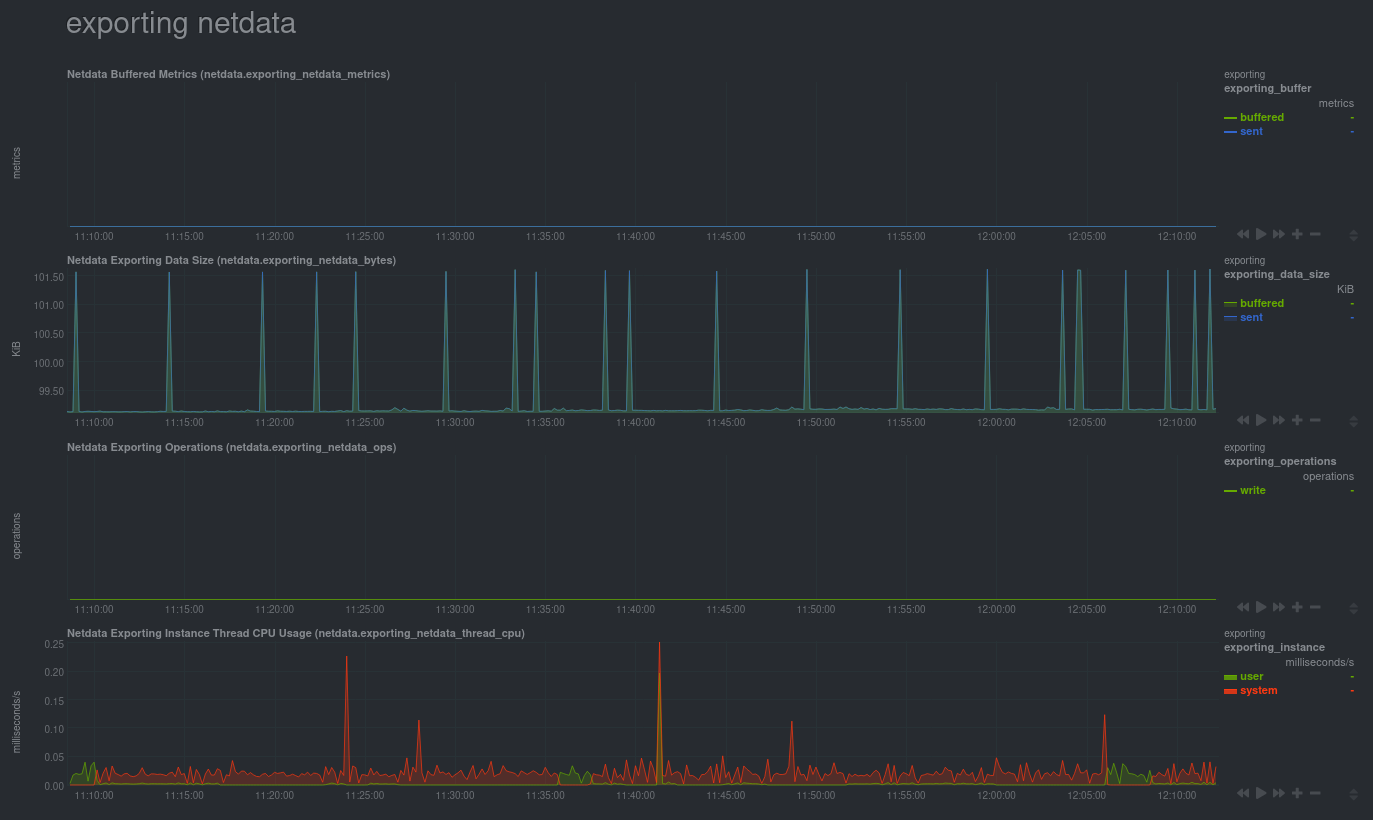 + You can use these charts to verify that Netdata is properly exporting metrics to Graphite. You can even add these exporting charts to your Graphite dashboard! ### Add exporting charts to Netdata Cloud -You can also show these exporting engine metrics on Netdata Cloud. If you don't have an account already, go [sign -in](https://app.netdata.cloud) and get started for free. If you need some help along the way, read the [get started with -Cloud guide](https://learn.netdata.cloud/docs/cloud/get-started). +You can also show these exporting engine metrics on Netdata Cloud. If you don't have an account already, +go [sign in](https://app.netdata.cloud) and get started for free. If you need some help along the way, read +the [get started with Cloud guide](https://github.com/netdata/netdata/blob/master/docs/cloud/get-started.mdx). Add more metrics to a War Room's Nodes view by clicking on the **Add metric** button, then typing `exporting` into the context field. Choose the exporting contexts you want to add, then click **Add**. You'll see these charts alongside any others you've customized in Netdata Cloud. -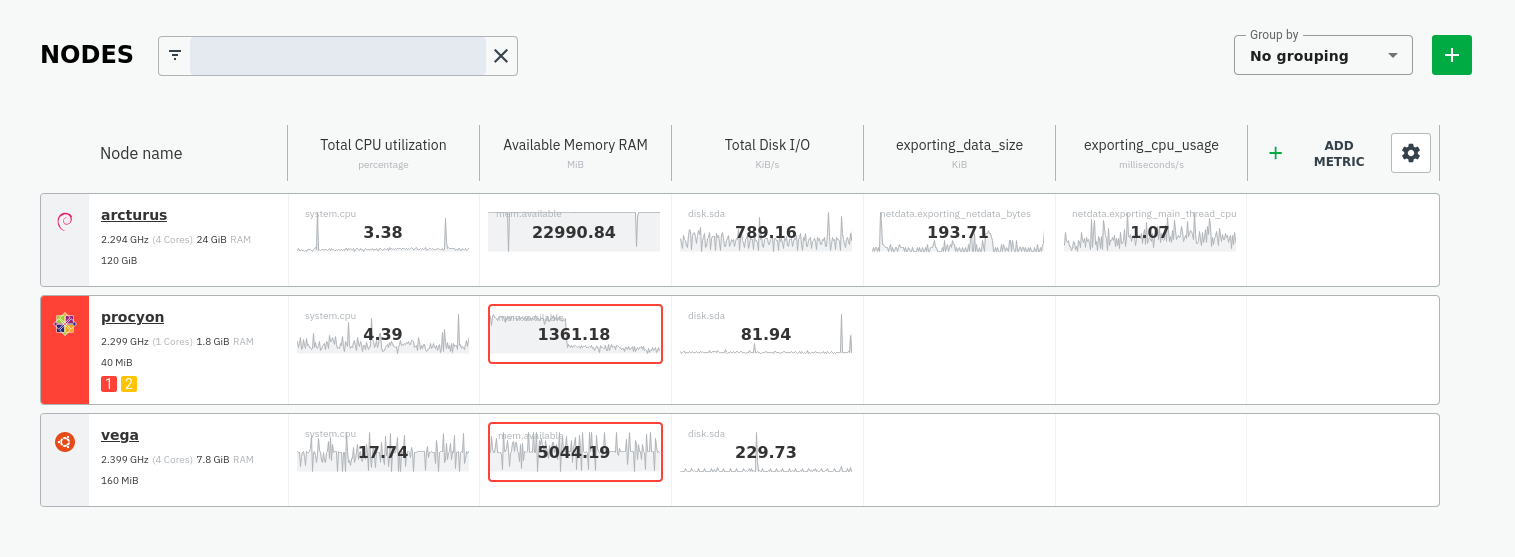 + ## What's next? What you do with your exported metrics is entirely up to you, but as you might have seen in the Graphite connector configuration block, there are many other ways to tweak and customize which metrics you export to Graphite and how -often. +often. -For full details about each configuration option and what it does, see the [exporting reference -guide](/exporting/README.md). +For full details about each configuration option and what it does, see +the [exporting reference guide](https://github.com/netdata/netdata/blob/master/exporting/README.md). diff --git a/docs/guides/monitor-cockroachdb.md b/docs/guides/monitor-cockroachdb.md index 46dd2535e2..3c6e1b2cf6 100644 --- a/docs/guides/monitor-cockroachdb.md +++ b/docs/guides/monitor-cockroachdb.md @@ -6,8 +6,9 @@ custom_edit_url: https://github.com/netdata/netdata/edit/master/docs/guides/moni # Monitor CockroachDB metrics with Netdata [CockroachDB](https://github.com/cockroachdb/cockroach) is an open-source project that brings SQL databases into -scalable, disaster-resilient cloud deployments. Thanks to a [new CockroachDB -collector](https://learn.netdata.cloud/docs/agent/collectors/go.d.plugin/modules/cockroachdb/) released in +scalable, disaster-resilient cloud deployments. Thanks to +a [new CockroachDB collector](https://github.com/netdata/go.d.plugin/blob/master/modules/cockroachdb/README.md) +released in [v1.20](https://blog.netdata.cloud/posts/release-1.20/), you can now monitor any number of CockroachDB databases with maximum granularity using Netdata. Collect more than 50 unique metrics and put them on interactive visualizations designed for better visual anomaly detection. @@ -19,9 +20,9 @@ Let's dive in and walk through the process of monitoring CockroachDB metrics wit ## What's in this guide -- [Configure the CockroachDB collector](#configure-the-cockroachdb-collector) - - [Manual setup for a local CockroachDB database](#manual-setup-for-a-local-cockroachdb-database) -- [Tweak CockroachDB alarms](#tweak-cockroachdb-alarms) +- [Configure the CockroachDB collector](#configure-the-cockroachdb-collector) + - [Manual setup for a local CockroachDB database](#manual-setup-for-a-local-cockroachdb-database) +- [Tweak CockroachDB alarms](#tweak-cockroachdb-alarms) ## Configure the CockroachDB collector @@ -31,7 +32,7 @@ display them on the dashboard. If your CockroachDB instance is accessible through `http://localhost:8080/` or `http://127.0.0.1:8080`, your setup is complete. Restart Netdata with `sudo systemctl restart netdata`, or the [appropriate -method](/docs/configure/start-stop-restart.md) for your system, and refresh your browser. You should see CockroachDB +method](https://github.com/netdata/netdata/blob/master/docs/configure/start-stop-restart.md) for your system, and refresh your browser. You should see CockroachDB metrics in your Netdata dashboard! <figure> @@ -59,8 +60,8 @@ edit, or create a new job with any of the parameters listed above in the file. B required, and everything else is optional. For a production cluster, you'll use either an IP address or the system's hostname. Be sure that your remote system -allows TCP communication on port 8080, or whichever port you have configured CockroachDB's [Admin -UI](https://www.cockroachlabs.com/docs/stable/monitoring-and-alerting.html#prometheus-endpoint) to listen on. +allows TCP communication on port 8080, or whichever port you have configured CockroachDB's +[Admin UI](https://www.cockroachlabs.com/docs/stable/monitoring-and-alerting.html#prometheus-endpoint) to listen on. ```yaml # [ JOBS ] @@ -80,7 +81,7 @@ jobs: - name: remote url: https://203.0.113.0:8080/_status/vars tls_skip_verify: yes # If your certificate is self-signed - + - name: remote_hostname url: https://cockroachdb.example.com:8080/_status/vars tls_skip_verify: yes # If your certificate is self-signed @@ -109,28 +110,24 @@ cd /etc/netdata/ # Replace with your Netdata configuration directory, if not /et ``` For more information about editing the defaults or writing new alarm entities, see our health monitoring [quickstart -guide](/health/QUICKSTART.md). +guide](https://github.com/netdata/netdata/blob/master/health/QUICKSTART.md). ## What's next? Now that you're collecting metrics from your CockroachDB databases, let us know how it's working for you! There's always room for improvement or refinement based on real-world use cases. Feel free to [file an -issue](https://github.com/netdata/netdata/issues/new?assignees=&labels=bug%2Cneeds+triage&template=BUG_REPORT.yml) with your +issue](https://github.com/netdata/netdata/issues/new?assignees=&labels=bug%2Cneeds+triage&template=BUG_REPORT.yml) with +your thoughts. Also, be sure to check out these useful resources: -- [Netdata's CockroachDB - documentation](https://learn.netdata.cloud/docs/agent/collectors/go.d.plugin/modules/cockroachdb/) -- [Netdata's CockroachDB - configuration](https://github.com/netdata/go.d.plugin/blob/master/config/go.d/cockroachdb.conf) -- [Netdata's CockroachDB - alarms](https://github.com/netdata/netdata/blob/29d9b5e51603792ee27ef5a21f1de0ba8e130158/health/health.d/cockroachdb.conf) -- [CockroachDB homepage](https://www.cockroachlabs.com/product/) -- [CockroachDB documentation](https://www.cockroachlabs.com/docs/stable/) -- [`_status/vars` endpoint - docs](https://www.cockroachlabs.com/docs/stable/monitoring-and-alerting.html#prometheus-endpoint) -- [Monitor CockroachDB with - Prometheus](https://www.cockroachlabs.com/docs/stable/monitor-cockroachdb-with-prometheus.html) +- [Netdata's CockroachDB documentation](https://github.com/netdata/go.d.plugin/blob/master/modules/cockroachdb/README.md) +- [Netdata's CockroachDB configuration](https://github.com/netdata/go.d.plugin/blob/master/config/go.d/cockroachdb.conf) +- [Netdata's CockroachDB alarms](https://github.com/netdata/netdata/blob/29d9b5e51603792ee27ef5a21f1de0ba8e130158/health/health.d/cockroachdb.conf) +- [CockroachDB homepage](https://www.cockroachlabs.com/product/) +- [CockroachDB documentation](https://www.cockroachlabs.com/docs/stable/) +- [`_status/vars` endpoint docs](https://www.cockroachlabs.com/docs/stable/monitoring-and-alerting.html#prometheus-endpoint) +- [Monitor CockroachDB with Prometheus](https://www.cockroachlabs.com/docs/stable/monitor-cockroachdb-with-prometheus.html) diff --git a/docs/guides/monitor-hadoop-cluster.md b/docs/guides/monitor-hadoop-cluster.md index 62403f8976..cce261feec 100644 --- a/docs/guides/monitor-hadoop-cluster.md +++ b/docs/guides/monitor-hadoop-cluster.md @@ -23,8 +23,8 @@ alternative, like the guide available from For more specifics on the collection modules used in this guide, read the respective pages in our documentation: -- [HDFS](https://learn.netdata.cloud/docs/agent/collectors/go.d.plugin/modules/hdfs) -- [Zookeeper](https://learn.netdata.cloud/docs/agent/collectors/go.d.plugin/modules/zookeeper) +- [HDFS](https://github.com/netdata/go.d.plugin/blob/master/modules/hdfs/README.md) +- [Zookeeper](https://github.com/netdata/go.d.plugin/blob/master/modules/zookeeper/README.md) ## Set up your HDFS and Zookeeper installations @@ -160,7 +160,7 @@ jobs: address : 203.0.113.10:2182 ``` -Finally, [restart Netdata](/docs/configure/start-stop-restart.md). +Finally, [restart Netdata](https://github.com/netdata/netdata/blob/master/docs/configure/start-stop-restart.md). ```sh sudo systemctl restart netdata @@ -185,7 +185,7 @@ sudo /etc/netdata/edit-config health.d/zookeeper.conf ``` For more information about editing the defaults or writing new alarm entities, see our [health monitoring -documentation](/health/README.md). +documentation](https://github.com/netdata/netdata/blob/master/health/README.md). |