
diff options
Diffstat (limited to 'docs')
98 files changed, 1540 insertions, 1327 deletions
diff --git a/docs/Add-more-charts-to-netdata.md b/docs/Add-more-charts-to-netdata.md index 6090644e38..35a89fba07 100644 --- a/docs/Add-more-charts-to-netdata.md +++ b/docs/Add-more-charts-to-netdata.md @@ -5,9 +5,9 @@ custom_edit_url: https://github.com/netdata/netdata/edit/master/docs/Add-more-ch # Add more charts to Netdata -This file has been deprecated. Please see our [collectors docs](/collectors/README.md) for more information. +This file has been deprecated. Please see our [collectors docs](https://github.com/netdata/netdata/blob/master/collectors/README.md) for more information. ## Available data collection modules -See the [list of supported collectors](/collectors/COLLECTORS.md) to see all the sources Netdata can collect metrics +See the [list of supported collectors](https://github.com/netdata/netdata/blob/master/collectors/COLLECTORS.md) to see all the sources Netdata can collect metrics from. diff --git a/docs/Running-behind-apache.md b/docs/Running-behind-apache.md index 6ee90e6239..d152306ffd 100644 --- a/docs/Running-behind-apache.md +++ b/docs/Running-behind-apache.md @@ -353,7 +353,7 @@ If your apache server is not on localhost, you can set: *note: Netdata v1.9+ support `allow connections from`* -`allow connections from` accepts [Netdata simple patterns](/libnetdata/simple_pattern/README.md) to match against the connection IP address. +`allow connections from` accepts [Netdata simple patterns](https://github.com/netdata/netdata/blob/master/libnetdata/simple_pattern/README.md) to match against the connection IP address. ## prevent the double access.log diff --git a/docs/Running-behind-h2o.md b/docs/Running-behind-h2o.md index f39f15fee2..8a1e22b2fc 100644 --- a/docs/Running-behind-h2o.md +++ b/docs/Running-behind-h2o.md @@ -105,7 +105,7 @@ Using the above, you access Netdata on the backend servers, like this: ### Encrypt the communication between H2O and Netdata -In case Netdata's web server has been [configured to use TLS](/web/server/README.md#enabling-tls-support), it is +In case Netdata's web server has been [configured to use TLS](https://github.com/netdata/netdata/blob/master/web/server/README.md#enabling-tls-support), it is necessary to specify inside the H2O configuration that the final destination is using TLS. To do this, change the `http://` on the `proxy.reverse.url` line in your H2O configuration with `https://` @@ -173,7 +173,7 @@ If your H2O server is not on localhost, you can set: *note: Netdata v1.9+ support `allow connections from`* -`allow connections from` accepts [Netdata simple patterns](/libnetdata/simple_pattern/README.md) to match against +`allow connections from` accepts [Netdata simple patterns](https://github.com/netdata/netdata/blob/master/libnetdata/simple_pattern/README.md) to match against the connection IP address. ## Prevent the double access.log diff --git a/docs/Running-behind-nginx.md b/docs/Running-behind-nginx.md index ac329a9921..a94f4058db 100644 --- a/docs/Running-behind-nginx.md +++ b/docs/Running-behind-nginx.md @@ -173,7 +173,7 @@ Using the above, you access Netdata on the backend servers, like this: ### Encrypt the communication between Nginx and Netdata -In case Netdata's web server has been [configured to use TLS](/web/server/README.md#enabling-tls-support), it is +In case Netdata's web server has been [configured to use TLS](https://github.com/netdata/netdata/blob/master/web/server/README.md#enabling-tls-support), it is necessary to specify inside the Nginx configuration that the final destination is using TLS. To do this, please, append the following parameters in your `nginx.conf` @@ -247,7 +247,7 @@ If your Nginx server is not on localhost, you can set: *note: Netdata v1.9+ support `allow connections from`* -`allow connections from` accepts [Netdata simple patterns](/libnetdata/simple_pattern/README.md) to match against the +`allow connections from` accepts [Netdata simple patterns](https://github.com/netdata/netdata/blob/master/libnetdata/simple_pattern/README.md) to match against the connection IP address. ## Prevent the double access.log diff --git a/docs/agent-cloud.md b/docs/agent-cloud.md index ed54325c35..b5b9966175 100644 --- a/docs/agent-cloud.md +++ b/docs/agent-cloud.md @@ -13,24 +13,24 @@ hosted web interface that gives you real-time visibility into your entire infras There are two main ways to use your Agent(s) with Netdata Cloud. You can use both these methods simultaneously, or just one, based on your needs: -- Use Netdata Cloud's web interface for monitoring an entire infrastructure, with any number of Agents, in one - centralized dashboard. -- Use **Visited nodes** to quickly navigate between the dashboards of nodes you've recently visited. +- Use Netdata Cloud's web interface for monitoring an entire infrastructure, with any number of Agents, in one + centralized dashboard. +- Use **Visited nodes** to quickly navigate between the dashboards of nodes you've recently visited. ## Monitor an infrastructure with Netdata Cloud We designed Netdata Cloud to help you see health and performance metrics, plus active alarms, in a single interface. Here's what a small infrastructure might look like: - + -[Read more about Netdata Cloud](https://learn.netdata.cloud/docs/cloud/) to better understand how it gives you real-time +[Read more about Netdata Cloud](https://github.com/netdata/netdata/blob/master/docs/cloud/cloud.mdx) to better +understand how it gives you real-time visibility into your entire infrastructure, and why you might consider using it. -Next, [get started in 5 minutes](https://learn.netdata.cloud/docs/cloud/get-started/), or read our [connection to Cloud -reference](/claim/README.md) for a complete investigation of Cloud's security and encryption features, plus instructions -for Docker containers. +Next, [get started in 5 minutes](https://github.com/netdata/netdata/blob/master/docs/cloud/get-started.mdx), or read our +[connection to Cloud reference](https://github.com/netdata/netdata/blob/master/claim/README.md) for a complete +investigation of Cloud's security and encryption features, plus instructions for Docker containers. ## Navigate between dashboards with Visited nodes @@ -46,15 +46,13 @@ Netdata Cloud account, sign in with your preferred method. Cloud redirects you back to your node's dashboard, which is now connected to your Netdata Cloud account. You can now see the Visited nodes menu, which is populated by a single node. -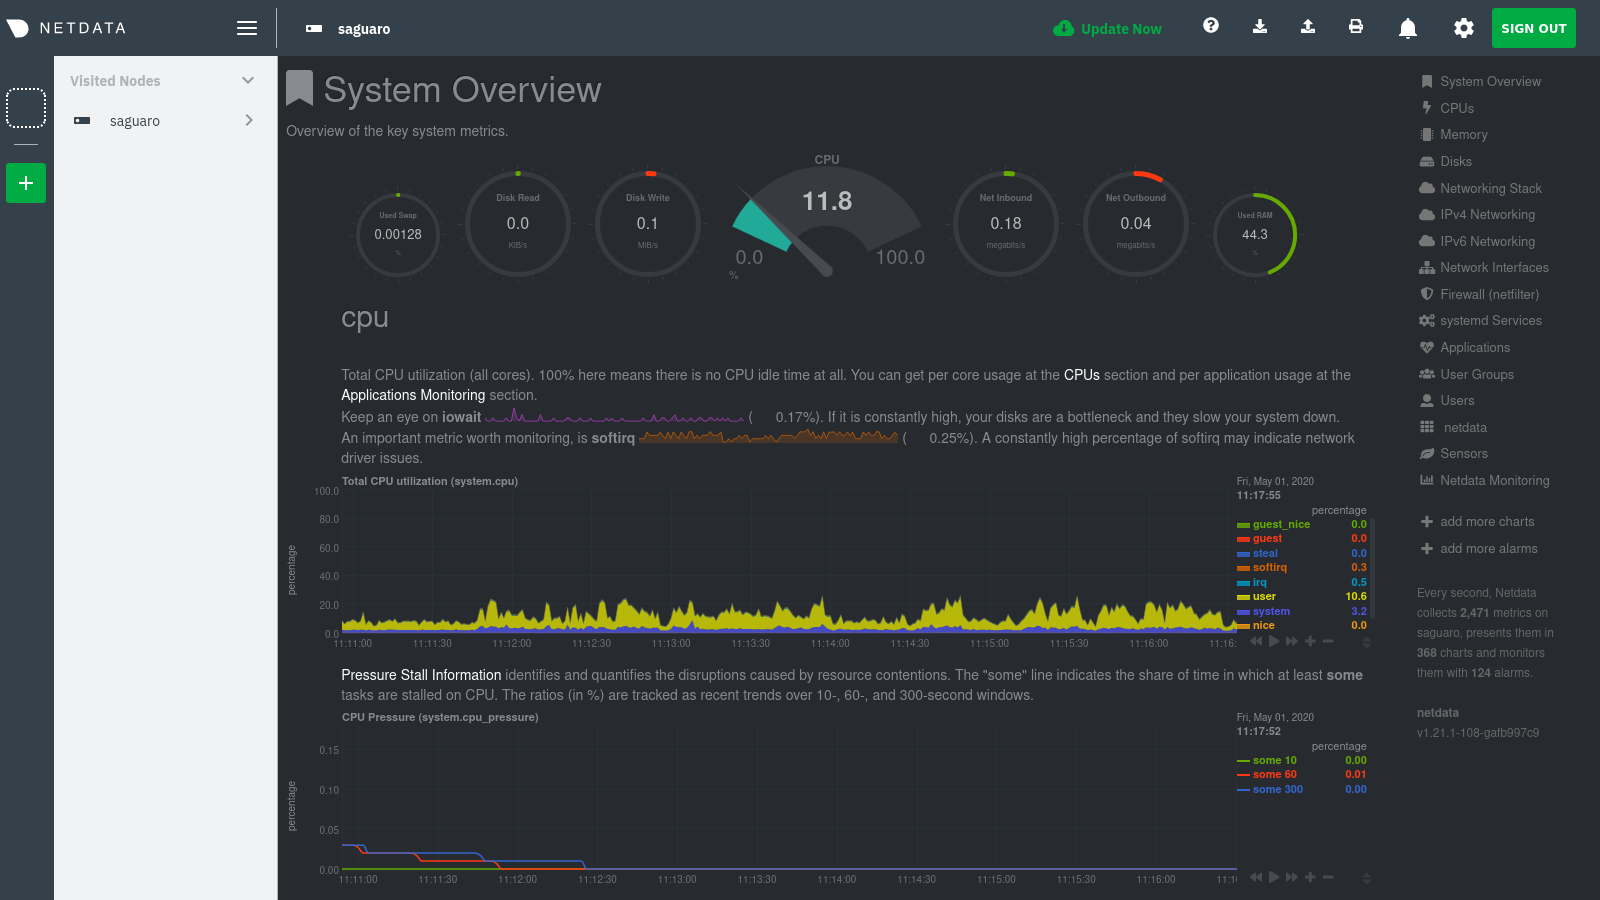 + If you previously went through the Cloud onboarding process to create a Space and War Room, you will also see these in the Visited Nodes menu. You can click on your Space or any of your War Rooms to navigate to Netdata Cloud and continue monitoring your infrastructure from there. -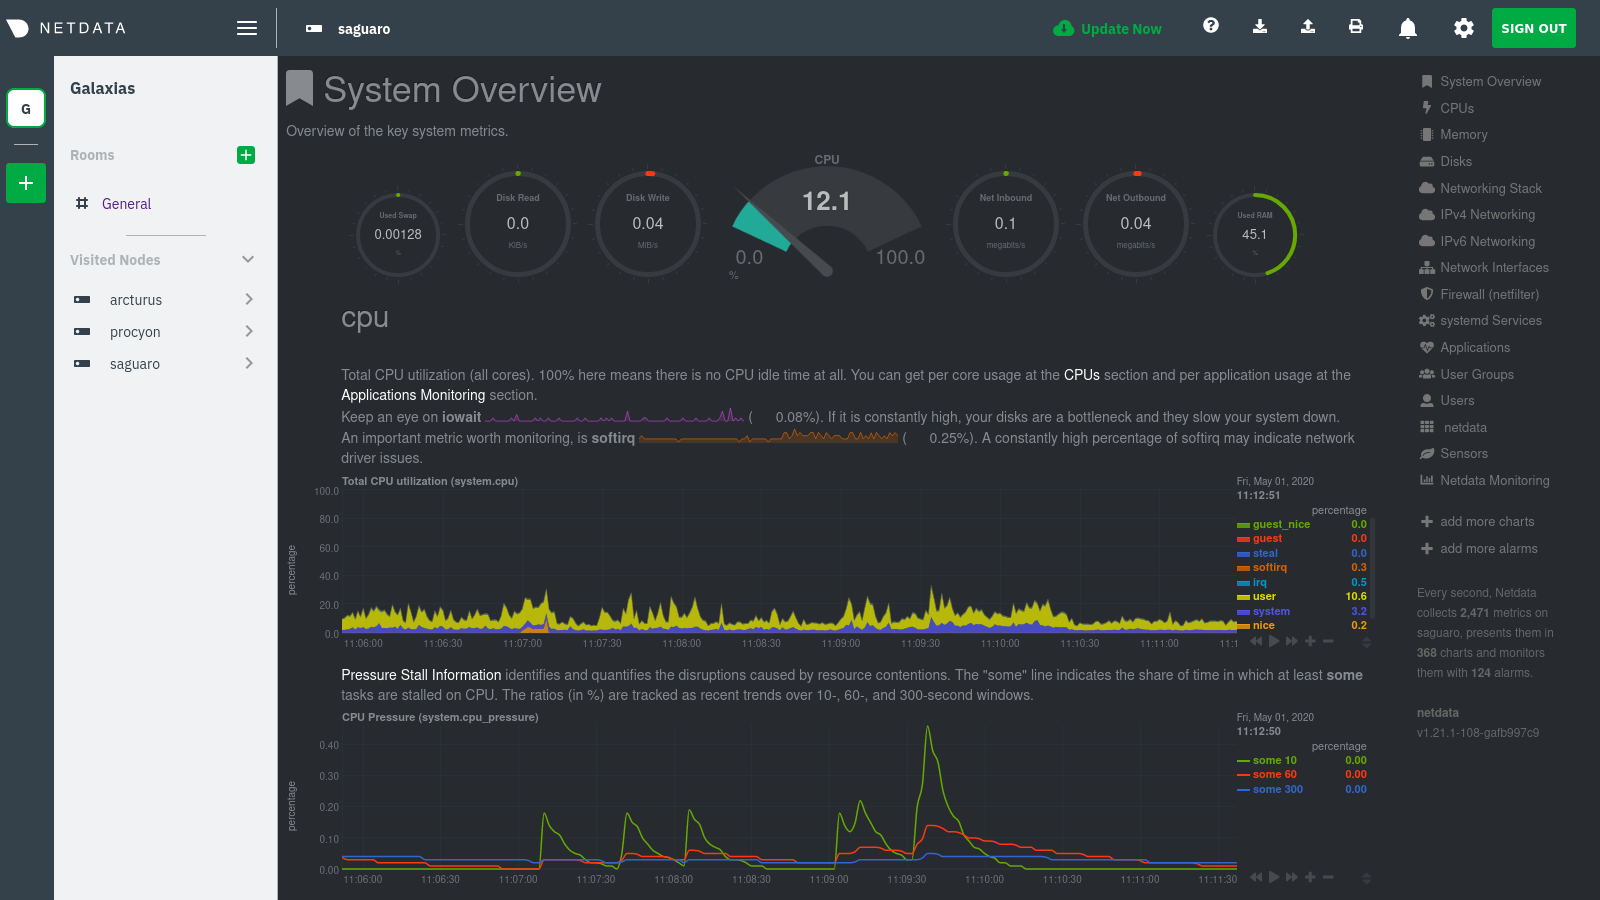 + To add more Agents to your Visited nodes menu, visit them and sign in again. This process connects that node to your Cloud account and further populates the menu. @@ -62,16 +60,19 @@ Cloud account and further populates the menu. Once you've added more than one node, you can use the menu to switch between various dashboards without remembering IP addresses or hostnames or saving bookmarks for every node you want to monitor. - + ## What's next? The Agent-Cloud integration is highly adaptable to the needs of any infrastructure or user. If you want to learn more about how you might want to use or configure Cloud, we recommend the following: -- Get an overview of Cloud's features by reading [Cloud documentation](https://learn.netdata.cloud/docs/cloud/). -- Follow the 5-minute [get started with Cloud](https://learn.netdata.cloud/docs/cloud/get-started/) guide to finish - onboarding and connect your first nodes. -- Better understand how agents connect securely to the Cloud with [connect agent to Cloud](/claim/README.md) and [Agent-Cloud - link](/aclk/README.md) documentation. +- Get an overview of Cloud's features by + reading [Cloud documentation](https://github.com/netdata/netdata/blob/master/docs/cloud/cloud.mdx). +- Follow the + 5-minute [get started with Cloud](https://github.com/netdata/netdata/blob/master/docs/cloud/cloud.mdx) + guide to finish + onboarding and connect your first nodes. +- Better understand how agents connect securely to the Cloud + with [connect agent to Cloud](https://github.com/netdata/netdata/blob/master/claim/README.md) and + [Agent-Cloud link](https://github.com/netdata/netdata/blob/master/aclk/README.md) documentation. diff --git a/docs/anonymous-statistics.md b/docs/anonymous-statistics.md index 99bd3dc7f0..13eb465c64 100644 --- a/docs/anonymous-statistics.md +++ b/docs/anonymous-statistics.md @@ -20,7 +20,7 @@ We use the statistics gathered from this information for two purposes: Netdata collects usage information via two different channels: -- **Agent dashboard**: We use the [PostHog JavaScript integration](https://posthog.com/docs/integrations/js-integration) (with sensitive event attributes overwritten to be anonymized) to send product usage events when you access an [Agent's dashboard](/web/gui/README.md). +- **Agent dashboard**: We use the [PostHog JavaScript integration](https://posthog.com/docs/integrations/js-integration) (with sensitive event attributes overwritten to be anonymized) to send product usage events when you access an [Agent's dashboard](https://github.com/netdata/netdata/blob/master/web/gui/README.md). - **Agent backend**: The `netdata` daemon executes the [`anonymous-statistics.sh`](https://github.com/netdata/netdata/blob/6469cf92724644f5facf343e4bdd76ac0551a418/daemon/anonymous-statistics.sh.in) script when Netdata starts, stops cleanly, or fails. You can opt-out from sending anonymous statistics to Netdata through |