1
2
3
4
5
6
7
8
9
10
11
12
13
14
15
16
17
18
19
20
21
22
23
24
25
26
27
28
29
30
31
32
33
34
35
36
37
38
39
40
41
42
43
44
45
46
47
48
49
50
51
52
53
54
55
56
57
58
59
60
61
62
63
64
65
66
67
68
69
70
71
72
73
74
75
76
77
78
79
80
81
82
83
84
85
86
87
88
89
90
91
92
93
94
95
96
97
98
99
100
101
102
103
104
105
106
107
108
109
110
111
112
113
114
115
116
117
118
119
120
121
122
123
124
125
126
127
128
129
130
131
132
133
134
135
136
137
138
139
140
141
142
143
144
145
146
147
148
149
150
151
152
153
154
155
156
157
158
159
160
161
162
163
164
165
166
167
168
169
170
171
172
173
174
175
176
177
178
179
180
181
182
183
184
185
186
187
188
189
190
191
192
193
194
195
196
197
198
199
200
201
202
203
204
205
206
207
208
209
210
211
212
213
214
215
216
217
218
219
220
221
222
223
224
225
226
227
228
229
230
231
232
233
234
235
236
237
238
239
240
241
242
243
244
245
246
247
248
249
250
251
252
253
254
255
256
257
258
259
260
261
262
263
264
265
266
267
268
269
270
271
272
273
274
275
276
277
278
279
280
281
282
283
284
285
286
287
288
289
290
291
292
293
294
295
296
297
298
299
300
301
302
303
304
305
306
307
308
309
310
311
312
313
314
315
316
317
318
319
320
321
322
323
324
325
326
327
328
329
330
331
332
333
334
335
336
337
338
339
340
341
342
343
344
345
346
347
348
349
350
351
352
353
354
355
356
357
358
359
360
361
362
363
364
365
366
367
368
369
370
371
372
373
374
375
376
377
378
379
380
381
382
383
384
385
386
387
388
389
390
391
392
393
394
395
396
397
398
399
400
401
402
403
404
405
406
407
408
409
410
411
412
413
414
415
416
417
418
419
420
421
422
423
424
425
426
427
428
429
430
431
432
433
434
435
436
437
438
439
440
441
442
443
444
445
446
447
448
449
450
451
452
453
454
455
456
457
458
459
460
461
462
463
464
465
466
467
468
469
470
471
472
473
474
475
476
477
478
479
480
481
482
483
484
485
486
487
488
489
490
491
492
493
494
495
496
497
498
499
500
501
502
503
504
505
506
507
508
509
510
511
512
513
514
515
516
517
518
519
520
521
522
523
524
525
526
527
528
529
530
531
532
533
534
535
536
537
538
539
540
541
542
543
544
545
546
547
548
549
550
551
552
553
554
555
556
557
558
559
560
561
562
563
564
565
566
567
568
569
570
571
572
573
574
575
576
577
578
579
580
581
582
583
584
585
586
587
588
589
590
591
592
593
594
595
596
597
598
599
600
601
602
603
604
605
606
607
608
609
610
611
612
613
614
615
616
617
618
619
620
621
622
623
624
625
626
627
628
629
630
631
632
633
634
635
636
637
638
639
640
641
642
643
644
645
646
647
648
649
650
651
652
653
654
655
656
657
658
659
660
661
662
663
664
665
666
667
668
669
670
671
672
673
674
675
676
677
678
679
680
681
682
683
684
685
686
687
688
689
690
691
692
693
694
695
696
697
698
699
700
701
702
703
704
705
706
707
708
709
710
711
712
713
714
715
716
717
718
719
720
721
722
723
724
725
726
727
728
729
730
731
732
733
734
735
736
737
738
739
740
741
742
743
744
745
746
747
748
749
750
751
752
753
754
755
756
757
758
759
760
761
762
763
764
765
766
767
768
769
770
771
772
773
774
775
776
777
778
779
780
781
782
783
784
785
786
787
788
789
790
791
792
793
794
795
796
797
|
<!--
title: "Health configuration reference"
custom_edit_url: https://github.com/netdata/netdata/edit/master/health/REFERENCE.md
-->
# Health configuration reference
Welcome to the health configuration reference.
This guide contains information about editing health configuration files to tweak existing alarms or create new health
entities that are customized to the needs of your infrastructure.
To learn the basics of locating and editing health configuration files, see the [health
quickstart](/health/QUICKSTART.md).
## Health configuration files
You can configure the Agent's health watchdog service by editing files in two locations:
- The `[health]` section in `netdata.conf`. By editing the daemon's behavior, you can disable health monitoring
altogether, run health checks more or less often, and more. See [daemon
configuration](/daemon/config/README.md#health-section-options) for a table of all the available settings, their
default values, and what they control.
- The individual `.conf` files in `health.d/`. These health entity files are organized by the type of metric they are
performing calculations on or their associated collector. You should edit these files using the `edit-config`
script. For example: `sudo ./edit-config health.d/cpu.conf`.
## Health entity reference
The following reference contains information about the syntax and options of _health entities_, which Netdata attaches
to charts in order to trigger alarms.
### Entity types
There are two entity types: **alarms** and **templates**. They have the same format and feature set—the only difference
is their label.
**Alarms** are attached to specific charts and use the `alarm` label.
**Templates** define rules that apply to all charts of a specific context, and use the `template` label. Templates help
you apply one entity to all disks, all network interfaces, all MySQL databases, and so on.
Alarms have higher precedence and will override templates. If an alarm and template entity have the same name and attach
to the same chart, Netdata will use the alarm.
### Entity format
Netdata parses the following lines. Beneath the table is an in-depth explanation of each line's purpose and syntax.
- The `on` and `lookup` lines are **always required**.
- Each entity **must** have one of the following lines: `calc`, `warn`, or `crit`.
- The `alarm` or `template` line must be the first line of any entity.
- A few lines use space-separated lists to define how the entity behaves. You can use `*` as a wildcard or prefix with
`!` for a negative match. Order is important, too! See our [simple patterns docs](../libnetdata/simple_pattern/) for
more examples.
| line | required | functionality |
| --------------------------------------------------- | --------------- | ------------------------------------------------------------------------------------- |
| [`alarm`/`template`](#alarm-line-alarm-or-template) | yes | Name of the alarm/template. |
| [`on`](#alarm-line-on) | yes | The chart this alarm should attach to. |
| [`os`](#alarm-line-os) | no | Which operating systems to run this chart. |
| [`hosts`](#alarm-line-hosts) | no | Which hostnames will run this alarm. |
| [`plugin`](#alarm-line-plugin) | no | Restrict an alarm or template to only a certain plugin. |
| [`module`](#alarm-line-module) | no | Restrict an alarm or template to only a certain module. |
| [`families`](#alarm-line-families) | no | Restrict a template to only certain families. |
| [`lookup`](#alarm-line-lookup) | yes | The database lookup to find and process metrics for the chart specified through `on`. |
| [`calc`](#alarm-line-calc) | yes (see above) | A calculation to apply to the value found via `lookup` or another variable. |
| [`every`](#alarm-line-every) | no | The frequency of the alarm. |
| [`green`/`red`](#alarm-lines-green-and-red) | no | Set the green and red thresholds of a chart. |
| [`warn`/`crit`](#alarm-lines-warn-and-crit) | yes (see above) | Expressions evaluating to true or false, and when true, will trigger the alarm. |
| [`to`](#alarm-line-to) | no | A list of roles to send notifications to. |
| [`exec`](#alarm-line-exec) | no | The script to execute when the alarm changes status. |
| [`delay`](#alarm-line-delay) | no | Optional hysteresis settings to prevent floods of notifications. |
| [`repeat`](#alarm-line-repeat) | no | The interval for sending notifications when an alarm is in WARNING or CRITICAL mode. |
| [`option`](#alarm-line-option) | no | Add an option to not clear alarms. |
| [`host labels`](#alarm-line-host-labels) | no | List of labels present on a host. |
The `alarm` or `template` line must be the first line of any entity.
#### Alarm line `alarm` or `template`
This line starts an alarm or template based on the [entity type](#entity-types) you're interested in creating.
**Alarm:**
```yaml
alarm: NAME
```
**Template:**
```yaml
template: NAME
```
`NAME` can be any alpha character, with `.` (period) and `_` (underscore) as the only allowed symbols, but the names
cannot be `chart name`, `dimension name`, `family name`, or `chart variables names`.
#### Alarm line `on`
This line defines the chart this alarm should attach to.
**Alarms:**
```yaml
on: CHART
```
The value `CHART` should be the unique ID or name of the chart you're interested in, as shown on the dashboard. In the
image below, the unique ID is `system.cpu`.

**Template:**
```yaml
on: CONTEXT
```
The value `CONTEXT` should be the context you want this template to attach to.
Need to find the context? Hover over the date on any given chart and look at the tooltip. In the image below, which
shows a disk I/O chart, the tooltip reads: `proc:/proc/diskstats, disk.io`.
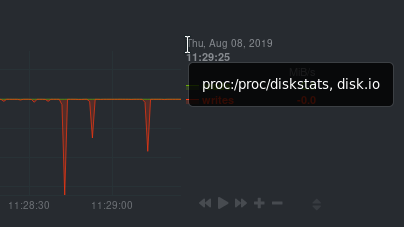
You're interested in what comes after the comma: `disk.io`. That's the name of the chart's context.
If you create a template using the `disk.io` context, it will apply an alarm to every disk available on your system.
#### Alarm line `os`
The alarm or template will be used only if the operating system of the host matches this list specified in `os`. The
value is a space-separated list.
The following example enables the entity on Linux, FreeBSD, and macOS, but no other operating systems.
```yaml
os: linux freebsd macos
```
#### Alarm line `hosts`
The alarm or template will be used only if the hostname of the host matches this space-separated list.
The following example will load on systems with the hostnames `server` and `server2`, and any system with hostnames that
begin with `database`. It _will not load_ on the host `redis3`, but will load on any _other_ systems with hostnames that
begin with `redis`.
```yaml
hosts: server1 server2 database* !redis3 redis*
```
#### Alarm line `plugin`
The `plugin` line filters which plugin within the context this alarm should apply to. The value is a space-separated
list of [simple patterns](/libnetdata/simple_pattern/README.md). For example,
you can create a filter for an alarm that applies specifically to `python.d.plugin`:
```yaml
plugin: python.d.plugin
```
The `plugin` line is best used with other options like `module`. When used alone, the `plugin` line creates a very
inclusive filter that is unlikely to be of much use in production. See [`module`](#alarm-line-module) for a
comprehensive example using both.
#### Alarm line `module`
The `module` line filters which module within the context this alarm should apply to. The value is a space-separated
list of [simple patterns](/libnetdata/simple_pattern/README.md). For
example, you can create an alarm that applies only on the `isc_dhcpd` module started by `python.d.plugin`:
```yaml
plugin: python.d.plugin
module: isc_dhcpd
```
#### Alarm line `families`
The `families` line, used only alongside templates, filters which families within the context this alarm should apply
to. The value is a space-separated list.
The value is a space-separate list of simple patterns. See our [simple patterns docs](../libnetdata/simple_pattern/) for
some examples.
For example, you can create a template on the `disk.io` context, but filter it to only the `sda` and `sdb` families:
```yaml
families: sda sdb
```
#### Alarm line `lookup`
This line makes a database lookup to find a value. This result of this lookup is available as `$this`.
The format is:
```yaml
lookup: METHOD AFTER [at BEFORE] [every DURATION] [OPTIONS] [of DIMENSIONS] [foreach DIMENSIONS]
```
Everything is the same with [badges](../web/api/badges/). In short:
- `METHOD` is one of `average`, `min`, `max`, `sum`, `incremental-sum`.
This is required.
- `AFTER` is a relative number of seconds, but it also accepts a single letter for changing
the units, like `-1s` = 1 second in the past, `-1m` = 1 minute in the past, `-1h` = 1 hour
in the past, `-1d` = 1 day in the past. You need a negative number (i.e. how far in the past
to look for the value). **This is required**.
- `at BEFORE` is by default 0 and is not required. Using this you can define the end of the
lookup. So data will be evaluated between `AFTER` and `BEFORE`.
- `every DURATION` sets the updated frequency of the lookup (supports single letter units as
above too).
- `OPTIONS` is a space separated list of `percentage`, `absolute`, `min2max`, `unaligned`,
`match-ids`, `match-names`. Check the badges documentation for more info.
- `of DIMENSIONS` is optional and has to be the last parameter. Dimensions have to be separated
by `,` or `|`. The space characters found in dimensions will be kept as-is (a few dimensions
have spaces in their names). This accepts Netdata simple patterns _(with `words` separated by
`,` or `|` instead of spaces)_ and the `match-ids` and `match-names` options affect the searches
for dimensions.
- `foreach DIMENSIONS` is optional, will always be the last parameter, and uses the same `,`/`|`
rules as the `of` parameter. Each dimension you specify in `foreach` will use the same rule
to trigger an alarm. If you set both `of` and `foreach`, Netdata will ignore the `of` parameter
and replace it with one of the dimensions you gave to `foreach`.
The result of the lookup will be available as `$this` and `$NAME` in expressions.
The timestamps of the timeframe evaluated by the database lookup is available as variables
`$after` and `$before` (both are unix timestamps).
#### Alarm line `calc`
A `calc` is designed to apply some calculation to the values or variables available to the entity. The result of the
calculation will be made available at the `$this` variable, overwriting the value from your `lookup`, to use in warning
and critical expressions.
When paired with `lookup`, `calc` will perform the calculation just after `lookup` has retrieved a value from Netdata's
database.
You can use `calc` without `lookup` if you are using [other available variables](#variables).
The `calc` line uses [expressions](#expressions) for its syntax.
```yaml
calc: EXPRESSION
```
#### Alarm line `every`
Sets the update frequency of this alarm. This is the same to the `every DURATION` given
in the `lookup` lines.
Format:
```yaml
every: DURATION
```
`DURATION` accepts `s` for seconds, `m` is minutes, `h` for hours, `d` for days.
#### Alarm lines `green` and `red`
Set the green and red thresholds of a chart. Both are available as `$green` and `$red` in expressions. If multiple
alarms define different thresholds, the ones defined by the first alarm will be used. These will eventually visualized
on the dashboard, so only one set of them is allowed. If you need multiple sets of them in different alarms, use
absolute numbers instead of `$red` and `$green`.
Format:
```yaml
green: NUMBER
red: NUMBER
```
#### Alarm lines `warn` and `crit`
Define the expression that triggers either a warning or critical alarm. These are optional, and should evaluate to
either true or false (or zero/non-zero).
The format uses Netdata's [expressions syntax](#expressions).
```yaml
warn: EXPRESSION
crit: EXPRESSION
```
#### Alarm line `to`
This will be the first parameter of the script to be executed when the alarm switches status. Its meaning is left up to
the `exec` script.
The default `exec` script, `alarm-notify.sh`, uses this field as a space separated list of roles, which are then
consulted to find the exact recipients per notification method.
Format:
```yaml
to: ROLE1 ROLE2 ROLE3 ...
```
#### Alarm line `exec`
The script that will be executed when the alarm changes status.
Format:
```yaml
exec: SCRIPT
```
The default `SCRIPT` is Netdata's `alarm-notify.sh`, which supports all the notifications methods Netdata supports,
including custom hooks.
#### Alarm line `delay`
This is used to provide optional hysteresis settings for the notifications, to defend against notification floods. These
settings do not affect the actual alarm - only the time the `exec` script is executed.
Format:
```yaml
delay: [[[up U] [down D] multiplier M] max X]
```
- `up U` defines the delay to be applied to a notification for an alarm that raised its status
(i.e. CLEAR to WARNING, CLEAR to CRITICAL, WARNING to CRITICAL). For example, `up 10s`, the
notification for this event will be sent 10 seconds after the actual event. This is used in
hope the alarm will get back to its previous state within the duration given. The default `U`
is zero.
- `down D` defines the delay to be applied to a notification for an alarm that moves to lower
state (i.e. CRITICAL to WARNING, CRITICAL to CLEAR, WARNING to CLEAR). For example, `down 1m`
will delay the notification by 1 minute. This is used to prevent notifications for flapping
alarms. The default `D` is zero.
- `multiplier M` multiplies `U` and `D` when an alarm changes state, while a notification is
delayed. The default multiplier is `1.0`.
- `max X` defines the maximum absolute notification delay an alarm may get. The default `X`
is `max(U * M, D * M)` (i.e. the max duration of `U` or `D` multiplied once with `M`).
Example:
`delay: up 10s down 15m multiplier 2 max 1h`
The time is `00:00:00` and the status of the alarm is CLEAR.
| time of event | new status | delay | notification will be sent | why |
| ------------- | ---------- | --- | ------------------------- | --- |
| 00:00:01 | WARNING | `up 10s` | 00:00:11 | first state switch |
| 00:00:05 | CLEAR | `down 15m x2` | 00:30:05 | the alarm changes state while a notification is delayed, so it was multiplied |
| 00:00:06 | WARNING | `up 10s x2 x2` | 00:00:26 | multiplied twice |
| 00:00:07 | CLEAR | `down 15m x2 x2 x2` | 00:45:07 | multiplied 3 times. |
So:
- `U` and `D` are multiplied by `M` every time the alarm changes state (any state, not just
their matching one) and a delay is in place.
- All are reset to their defaults when the alarm switches state without a delay in place.
#### Alarm line `repeat`
Defines the interval between repeating notifications for the alarms in CRITICAL or WARNING mode. This will override the
default interval settings inherited from health settings in `netdata.conf`. The default settings for repeating
notifications are `default repeat warning = DURATION` and `default repeat critical = DURATION` which can be found in
health stock configuration, when one of these interval is bigger than 0, Netdata will activate the repeat notification
for `CRITICAL`, `CLEAR` and `WARNING` messages.
Format:
```yaml
repeat:
|
