1
2
3
4
5
6
7
8
9
10
11
12
13
14
15
16
17
18
19
20
21
22
23
24
25
26
27
28
29
30
31
32
33
34
35
36
37
38
39
40
41
42
43
44
45
46
47
48
49
50
51
52
53
54
55
56
57
58
59
60
61
62
63
64
65
66
67
68
69
70
71
72
73
74
75
76
77
78
79
80
81
82
83
84
85
86
87
88
89
90
91
92
93
94
95
96
97
98
99
100
101
102
103
104
105
106
107
108
109
110
111
112
113
114
115
116
117
118
119
120
121
122
123
124
125
126
127
128
129
130
131
132
133
134
135
136
137
138
139
140
141
142
143
144
145
146
147
148
149
150
151
152
153
154
155
156
157
158
159
160
161
162
163
164
165
166
167
168
169
170
171
172
173
174
175
176
177
178
179
180
181
182
183
184
185
186
187
188
189
190
191
192
193
194
195
196
197
198
199
200
201
202
203
204
205
206
207
208
209
210
211
212
213
214
215
216
217
218
219
220
221
222
223
224
225
226
227
228
229
230
231
232
233
234
235
236
237
238
239
240
241
242
243
244
245
246
247
248
249
250
251
252
253
254
255
256
257
258
259
260
261
262
263
264
265
266
267
268
269
270
271
272
273
274
275
276
277
278
279
280
281
282
283
284
285
286
287
288
289
290
291
292
293
294
295
296
297
298
299
300
301
302
303
304
305
306
307
308
309
310
311
312
313
314
315
316
317
318
319
320
321
322
323
324
325
326
327
328
329
330
331
332
333
334
335
336
337
338
339
340
341
342
343
344
345
346
347
348
349
350
351
352
353
354
355
356
357
358
359
360
361
362
363
364
365
366
367
368
369
370
371
372
373
374
375
376
377
378
379
380
381
382
383
384
385
386
387
388
389
390
391
392
393
394
395
396
397
398
399
400
401
402
403
404
405
406
407
408
409
410
411
412
413
414
415
416
417
418
419
420
421
422
423
424
425
426
427
428
429
430
431
432
433
434
435
436
437
438
439
440
441
442
443
444
445
446
447
448
449
450
451
452
453
454
455
456
457
458
459
460
461
462
463
464
465
466
467
468
469
470
471
472
473
474
475
476
477
478
479
480
481
482
483
484
485
486
487
488
489
490
491
492
493
494
495
496
497
498
499
500
501
502
503
504
505
506
507
508
509
510
511
512
513
514
515
516
517
518
519
520
|
# netdata [](https://travis-ci.com/netdata/netdata) [](https://bestpractices.coreinfrastructure.org/projects/2231) [](https://www.gnu.org/licenses/gpl-3.0) []()
[](https://codeclimate.com/github/netdata/netdata) [](https://www.codacy.com/app/netdata/netdata?utm_source=github.com&utm_medium=referral&utm_content=netdata/netdata&utm_campaign=Badge_Grade) [](https://lgtm.com/projects/g/netdata/netdata/context:cpp) [](https://lgtm.com/projects/g/netdata/netdata/context:javascript) [](https://lgtm.com/projects/g/netdata/netdata/context:python)
---
**Netdata** is **distributed, real-time, performance and health monitoring for systems and applications**. It is a highly optimized monitoring agent you install on all your systems and containers.
Netdata provides **unparalleled insights**, **in real-time**, of everything happening on the systems it runs (including web servers, databases, applications), using **highly interactive web dashboards**. It can run autonomously, without any third party components, or it can be integrated to existing monitoring tool chains (Prometheus, Graphite, OpenTSDB, Kafka, Grafana, etc).
_Netdata is **fast** and **efficient**, designed to permanently run on all systems (**physical** & **virtual** servers, **containers**, **IoT** devices), without disrupting their core function._
Netdata is **free, open-source software** and it currently runs on **Linux**, **FreeBSD**, and **MacOS**.

Netdata is in the [Cloud Native Computing Foundation (CNCF) landscape](https://landscape.cncf.io/format=card-mode&grouping=no&sort=stars) and it is the 3rd most starred open-source project.
Check the [CNCF TOC Netdata presentation](https://docs.google.com/presentation/d/18C8bCTbtgKDWqPa57GXIjB2PbjjpjsUNkLtZEz6YK8s/edit?usp=sharing).
---
People get **addicted to netdata**.<br/>
Once you use it on your systems, **there is no going back**! *You have been warned...*

[](https://twitter.com/intent/tweet?text=Netdata,%20real-time%20performance%20and%20health%20monitoring,%20done%20right!&url=https://my-netdata.io/&via=linuxnetdata&hashtags=netdata,monitoring)
## Contents
1. [How it looks](#how-it-looks) - have a quick look at it
2. [User base](#user-base) - who uses netdata?
3. [Quick Start](#quick-start) - try it now on your systems
4. [Why Netdata](#why-netdata) - why people love netdata, how it compares with other solutions
5. [News](#news) - latest news about netdata
6. [How it works](#how-it-works) - high level diagram of how netdata works
7. [infographic](#infographic) - everything about netdata, in a page
8. [Features](#features) - what features does it have
9. [Visualization](#visualization) - unique visualization features
10. [What does it monitor](#what-does-it-monitor) - which metrics it collects
11. [Documentation](#documentation) - read the docs
12. [Community](#community) - discuss with others and get support
13. [License](#license) - check the license of netdata
14. [Is it any good?](#is-it-any-good) - Yes
15. [Is it awesome?](#is-it-awesome) - Yes
## How it looks
The following animated image, shows the top part of a typical netdata dashboard.

*A typical netdata dashboard, in 1:1 timing. Charts can be panned by dragging them, zoomed in/out with `SHIFT` + `mouse wheel`, an area can be selected for zoom-in with `SHIFT` + `mouse selection`. Netdata is highly interactive and **real-time**, optimized to get the work done!*
> *We have a few online demos to experience it live: [https://my-netdata.io](https://my-netdata.io)*
## User base
Netdata is used by hundreds of thousands of users all over the world.
Check our [GitHub watchers list](https://github.com/netdata/netdata/watchers).
You will find people working for **Amazon**, **Atos**, **Baidu**, **Cisco Systems**, **Citrix**, **Deutsche Telekom**, **DigitalOcean**,
**Elastic**, **EPAM Systems**, **Ericsson**, **Google**, **Groupon**, **Hortonworks**, **HP**, **Huawei**,
**IBM**, **Microsoft**, **NewRelic**, **Nvidia**, **Red Hat**, **SAP**, **Selectel**, **TicketMaster**,
**Vimeo**, and many more!
### Docker pulls
We provide docker images for the most common architectures. These are statistics reported by docker hub:
[](https://hub.docker.com/r/netdata/netdata/) [](https://hub.docker.com/r/firehol/netdata/) [](https://hub.docker.com/r/titpetric/netdata/)
### Registry
When you install multiple netdata, they are integrated into **one distributed application**, via a [netdata registry](registry/#registry). This is a web browser feature and it allows us to count the number of unique users and unique netdata servers installed. The following information comes from the global public netdata registry we run:
[](https://registry.my-netdata.io/#menu_netdata_submenu_registry) [](https://registry.my-netdata.io/#menu_netdata_submenu_registry) [](https://registry.my-netdata.io/#menu_netdata_submenu_registry)
*in the last 24 hours:*<br/> [](https://registry.my-netdata.io/#menu_netdata_submenu_registry) [](https://registry.my-netdata.io/#menu_netdata_submenu_registry) [](https://registry.my-netdata.io/#menu_netdata_submenu_registry)
## Quick Start
You can quickly install netdata on a Linux box (physical, virtual, container, IoT) with the following command:
```sh
# make sure you run `bash` for your shell
bash
# install netdata, directly from github sources
bash <(curl -Ss https://my-netdata.io/kickstart.sh)
```
 
The above command will:
1. install any required packages on your system (it will ask you to confirm before doing so),
2. compile it, install it and start it
More installation methods and additional options can be found at the [installation page](packaging/installer/#installation).
To try netdata in a docker container, run this:
```
docker run -d --name=netdata \
-p 19999:19999 \
-v /proc:/host/proc:ro \
-v /sys:/host/sys:ro \
-v /var/run/docker.sock:/var/run/docker.sock:ro \
--cap-add SYS_PTRACE \
--security-opt apparmor=unconfined \
netdata/netdata
```
For more information about running netdata in docker, check the [docker installation page](packaging/docker/).

## Why Netdata
Netdata has a quite different approach to monitoring.
Netdata is a monitoring agent you install on all your systems. It is:
- a **metrics collector** - for system and application metrics (including web servers, databases, containers, etc)
- a **time-series database** - all stored in memory (does not touch the disks while it runs)
- a **metrics visualizer** - super fast, interactive, modern, optimized for anomaly detection
- an **alarms notification engine** - an advanced watchdog for detecting performance and availability issues
All the above, are packaged together in a very flexible, extremely modular, distributed application.
This is how netdata compares to other monitoring solutions:
netdata|others (open-source and commercial)
:---:|:---:
**High resolution metrics** (1s granularity)|Low resolution metrics (10s granularity at best)
Monitors everything, **thousands of metrics per node**|Monitor just a few metrics
UI is super fast, optimized for **anomaly detection**|UI is good for just an abstract view
**Meaningful presentation**, to help you understand the metrics|You have to know the metrics before you start
Install and get results **immediately**|Long preparation is required to get any useful results
Use it for **troubleshooting** performance problems|Use them to get *statistics of past performance*
**Kills the console** for tracing performance issues|The console is always required for troubleshooting
Requires **zero dedicated resources**|Require large dedicated resources
Netdata is **open-source**, **free**, super **fast**, very **easy**, completely **open**, extremely **efficient**,
**flexible** and integrate-able.
It has been designed by **SysAdmins**, **DevOps** and **Developers** for troubleshooting performance problems,
not just visualize metrics.
## News
`Feb 14th, 2019` - **[netdata v1.12.0 released!](https://github.com/netdata/netdata/releases)**
Release 1.12 is made out of 211 pull requests and 22 bug fixes.
The key improvements are:
- Introducing `netdata.cloud`, the free netdata service for all netdata users
- High performance plugins with go.d.plugin (data collection orchestrator written in Go)
- 7 new data collectors and 11 rewrites of existing data collectors for improved performance
- A new management API for all netdata servers
- Bind different functions of the netdata APIs to different ports
- Improved installation and updates
`Nov 22nd, 2018` - **[netdata v1.11.1 released!](https://github.com/netdata/netdata/releases)**
- Improved internal database to support values above 64bit.
- New data collection plugins: [`openldap`](collectors/python.d.plugin/openldap/), [`tor`](collectors/python.d.plugin/tor/), [`nvidia_smi`](collectors/python.d.plugin/nvidia_smi/).
- Improved data collection plugins: netdata now supports monitoring network interface aliases, [`smartd_log`](collectors/python.d.plugin/smartd_log/), [`cpufreq`](collectors/python.d.plugin/cpufreq/), [`sensors`](collectors/python.d.plugin/sensors/).
- Health monitoring improvements: network interface congestion alarm restored, [`alerta.io`](health/notifications/alerta/), `conntrack_max`.
- `my-netdata`menu has been refactored.
- Packaging: `openrc` service definition got a few improvements.
---
`Sep 18, 2018` - **netdata has its own organization**
Netdata used to be a [firehol.org](https://firehol.org) project, accessible as `firehol/netdata`.
Netdata now has its own github organization `netdata`, so all github URLs are now `netdata/netdata`. The old github URLs, repo clones, forks, etc redirect automatically to the new repo.
## How it works
Netdata is a highly efficient, highly modular, metrics management engine. Its lockless design makes it ideal for concurrent operations on the metrics.
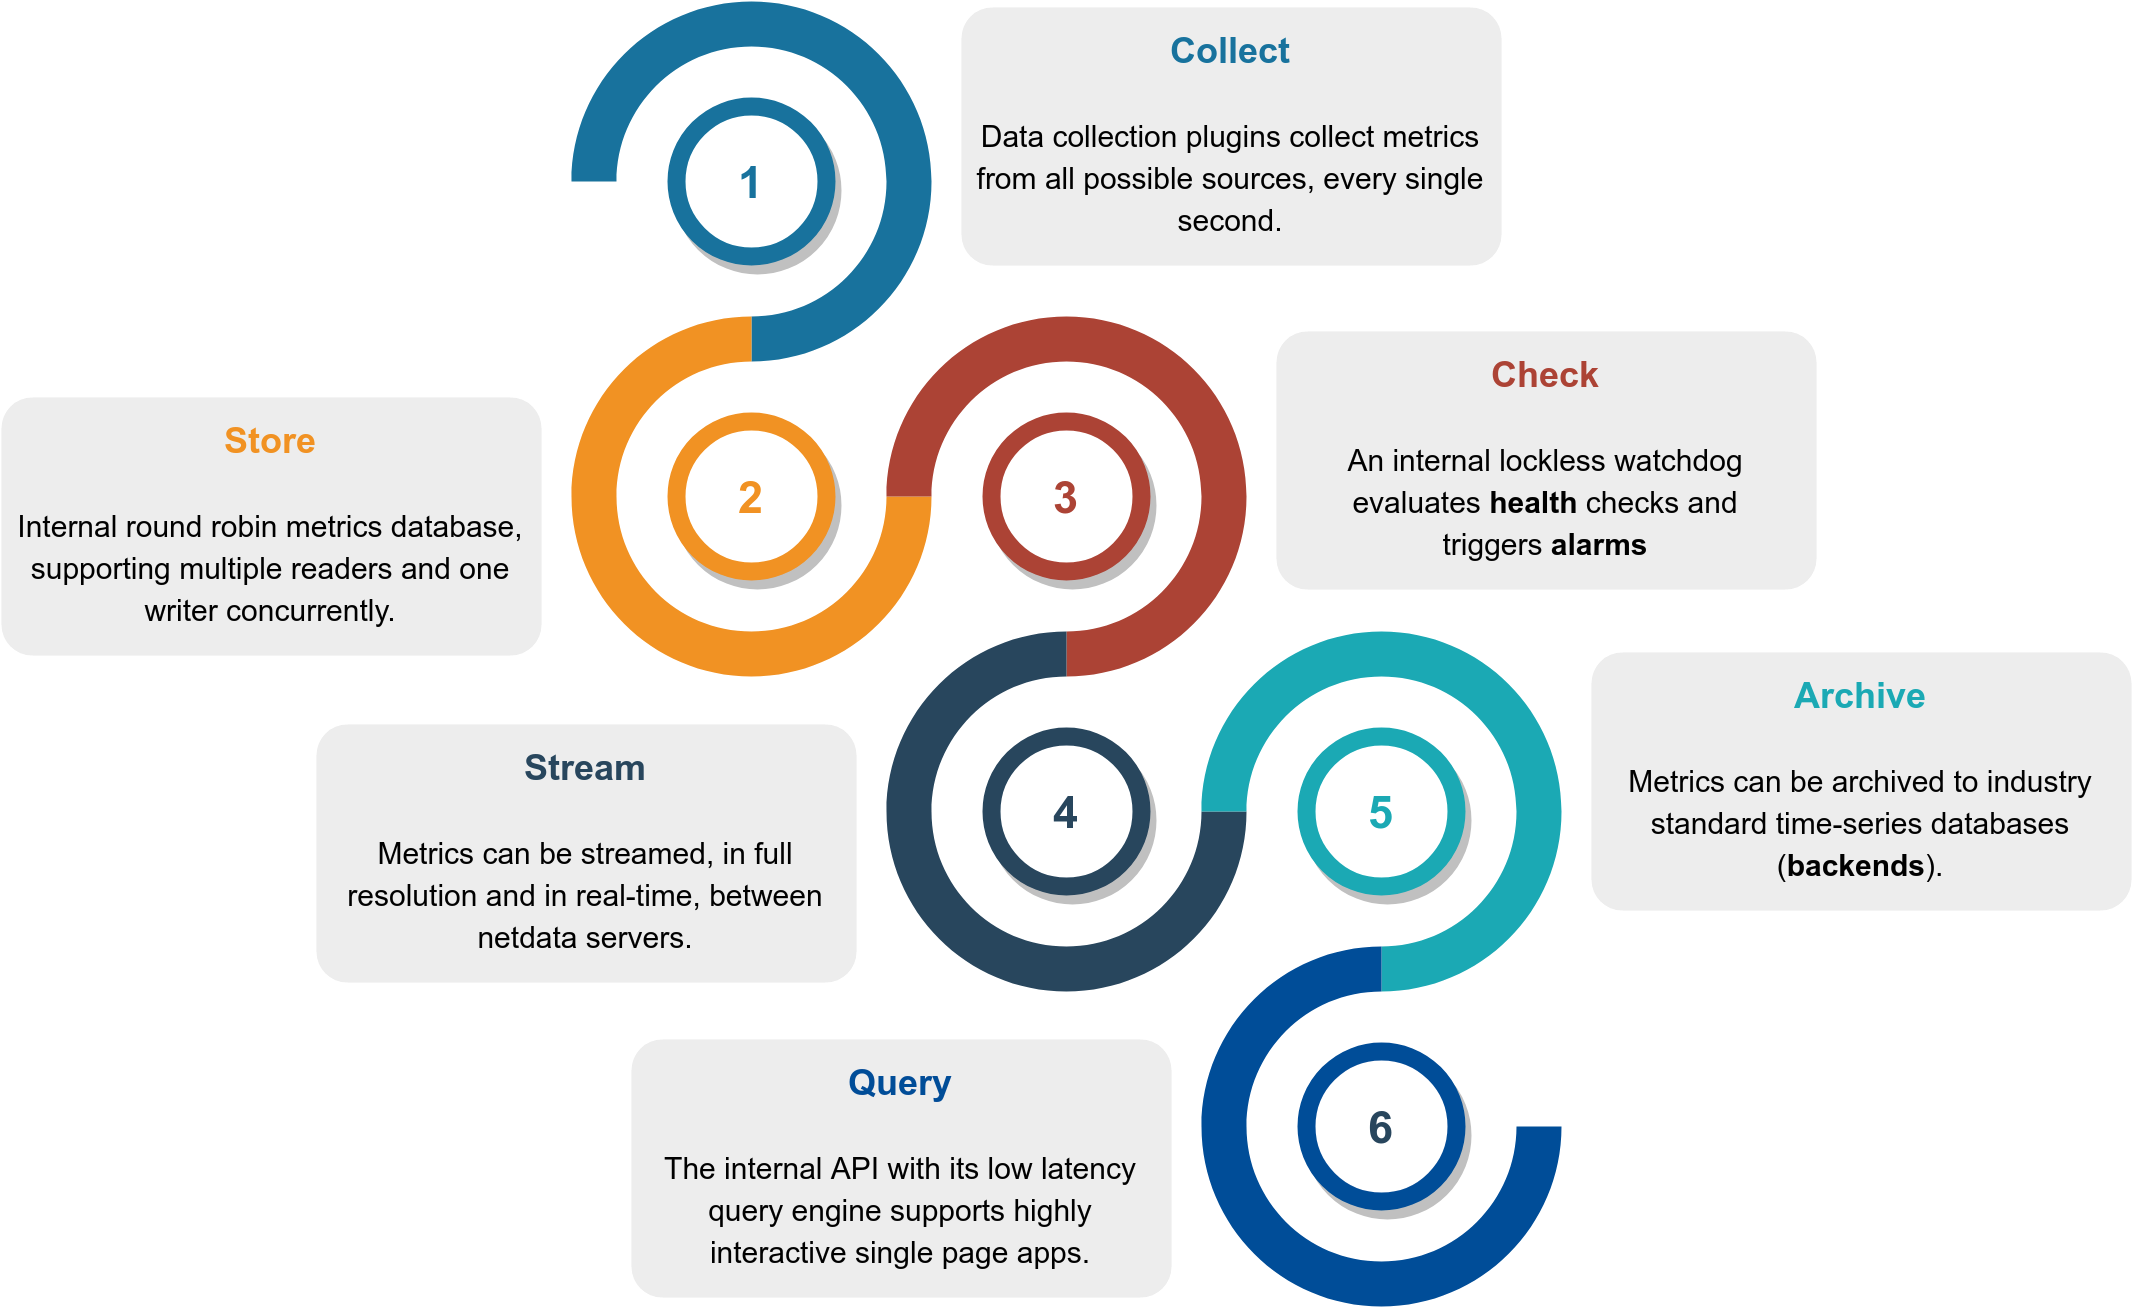
This is how it works:
Function|Description|Documentation
:---:|:---|:---:
**Collect**|Multiple independent data collection workers are collecting metrics from their sources using the optimal protocol for each application and push the metrics to the database. Each data collection worker has lockless write access to the metrics it collects.|[`collectors`](collectors/#data-collection-plugins)
**Store**|Metrics are stored in RAM in a round robin database (ring buffer), using a custom made floating point number for minimal footprint.|[`database`](database/#database)
**Check**|A lockless independent watchdog is evaluating **health checks** on the collected metrics, triggers alarms, maintains a health transaction log and dispatches alarm notifications.|[`health`](health/#health-monitoring)
**Stream**|An lockless independent worker is streaming metrics, in full detail and in real-time, to remote netdata servers, as soon as they are collected.|[`streaming`](streaming/#streaming-and-replication)
**Archive**|A lockless independent worker is down-sampling the metrics and pushes them to **backend** time-series databases.|[`backends`](backends/)
**Query**|Multiple independent workers are attached to the [internal web server](web/server/#web-server), servicing API requests, including [data queries](web/api/queries/#database-queries).|[`web/api`](web/api/#api)
The result is a highly efficient, low latency system, supporting multiple readers and one writer on each metric.
## Infographic
This is a high level overview of netdata feature set and architecture.
Click it to to interact with it (it has direct links to documentation).
[](https://my-netdata.io/infographic.html)
## Features
This is what you should expect from Netdata:
### General
- **1s granularity** - the highest possible resolution for all metrics.
- **Unlimited metrics** - collects all the available metrics, the more the better.
- **1% CPU utilization of a single core** - it is super fast, unbelievably optimized.
- **A few MB of RAM** - by default it uses 25MB RAM. [You size it](database).
- **Zero disk I/O** - while it runs, it does not load or save anything (except `error` and `access` logs).
- **Zero configuration** - auto-detects everything, it can collect up to 10000 metrics per server out of the box.
- **Zero maintenance** - You just run it, it does the rest.
- **Zero dependencies** - it is even its own web server, for its static web files and its web API (though its plugins may require additional libraries, depending on the applications monitored).
- **Scales to infinity** - you can install it on all your servers, containers, VMs and IoTs. Metrics are not centralized by default, so there is no limit.
- **Several operating modes** - Autonomous host monitoring (the default), headless data collector, forwarding proxy, store and forward proxy, central multi-host monitoring, in all possible configurations. Each node may have different metrics retention policy and run with or without health monitoring.
### Health Monitoring & Alarms
- **Sophisticated alerting** - comes with hundreds of alarms, **out of the box**! Supports dynamic thresholds, hysteresis, alarm templates, multiple role-based notification methods.
- **Notifications**: [alerta.io](health/notifications/alerta/), [amazon sns](health/notifications/awssns/), [discordapp.com](health/notifications/discord/), [email](health/notifications/email/), [flock.com](health/notifications/flock/), [irs](health/notifications/irc/), [kavenegar.com](health/notifications/kavenegar/), [messagebird.com](health/notifications/messagebird/), [pagerduty.com](health/notifications/pagerduty/), [pushbullet.com](health/notifications/pushbullet/), [pushover.net](health/notifications/pushover/), [rocket.chat](health/notifications/rocketchat/), [slack.com](health/notifications/slack/), [syslog](health/notifications/syslog/), [telegram.org](health/notifications/telegram/), [twilio.com](health/notifications/twilio/), [web](health/notifications/web/).
### Integrations
- **time-series dbs** - can archive its metrics to `graphite`, `opentsdb`, `prometheus`, json document DBs, in the same or lower resolution (lower: to prevent it from congesting these servers due to the amount of data collected).
## Visualization
- **Stunning interactive dashboards** - mouse, touchpad and touch-screen friendly in 2 themes: `slate` (dark) and `white`.
- **Amazingly fast visualization** - responds to all queries in less than 1 ms per metric, even on low-end hardware.
- **Visual anomaly detection** - the dashboards are optimized for detecting anomalies visually.
- **Embeddable** - its charts can be embedded on your web pages, wikis and blogs. You can even use [Atlassian's Confluence as a monitoring dashboard](web/gui/confluence/).
- **Customizable** - custom dashboards can be built using simple HTML (no javascript necessary).
### Positive and negative values
To improve clarity on charts, netdata dashboards present **positive** values for metrics representing `read`, `input`, `inbound`, `received` and **negative** values for metrics representing `write`, `output`, `outbound`, `sent`.

*Netdata charts showing the bandwidth and packets of a network interface. `received` is positive and `sent` is negative.*
### Autoscaled y-axis
Netdata charts automatically zoom vertically, to visualize the variation of each metric within the visible time-frame.
*A zero based `stacked` chart, automatically switches to an auto-scaled `area` chart when a single dimension is selected.*
### Charts are synchronized
Charts on netdata dashboards are synchronized to each other. There is no master chart. Any chart can be panned or zoomed at any time, and all other charts will follow.

*Charts are panned by dragging them with the mouse. Charts can be zoomed in/out with`SHIFT` + `mouse wheel` while the mouse pointer is over a chart.*
> The visible time-frame (pan and zoom) is propagated from netdata server to netdata server, when navigating via the [`my-netdata` menu](registry#registry).
### Highlighted time-frame
To improve visual anomaly detection across charts, the user can highlight a time-frame (by pressing `ALT` + `mouse selection`) on all charts.
*A highlighted time-frame can be given by pressing `ALT` + `mouse selection` on any chart. Netdata will highlight the same range on all charts.*
> Highlighted ranges are propagated from netdata server to netdata server, when navigating via the [`my-netdata` menu](registry#registry).
## What does it monitor
Netdata data collection is **extensible** - you can monitor anything you can get a metric for.
Its [Plugin API](collectors/plugins.d/) supports all programing languages (anything can be a netdata plugin, BASH, python, perl, node.js, java, Go, ruby, etc).
- For better performance, most system related plugins (cpu, memory, disks, filesystems, networking, etc) have been written in `C`.
- For faster development and easier contributions, most application related plugins (databases, web servers, etc) have been written in `python`.
#### APM (Application Performance Monitoring)
- **[statsd](collectors/statsd.plugin/)** - netdata is a fully featured statsd server.
- **[Go expvar](collectors/python.d.plugin/go_expvar/)** - collects metrics exposed by applications written in the Go programming language using the expvar package.
- **[Spring Boot](collectors/python.d.plugin/springboot/)** - monitors running Java Spring Boot applications that expose their metrics with the use of the Spring Boot Actuator included in Spring Boot library.
- **[uWSGI](collectors/python.d.plugin/uwsgi/)** - collects performance metrics from uWSGI applications.
#### System Resources
- **[CPU Utilization](collectors/proc.plugin/)** - total and per core CPU usage.
- **[Interrupts](collectors/proc.plugin/)** - total and per core CPU interrupts.
- **[SoftIRQs](collectors/proc.plugin/)** - total and per core SoftIRQs.
- **[SoftNet](collectors/proc.plugin/)** - total and per core SoftIRQs related to network activity.
- **[CPU Throttling](collectors/proc.plugin/)** - collects per core CPU throttling.
- **[CPU Frequency](collectors/python.d.plugin/couchdb/)** - collects the current CPU frequency.
- **[CPU Idle](collectors/python.d.plugin/cpuidle/)** - collects the time spent per processor state.
- **[IdleJitter](collectors/idlejitter.plugin/)** - measures CPU latency.
- **[Entropy](collectors/proc.plugin/)** - random numbers pool, using in cryptography.
- **[Interprocess Communication - IPC](collectors/proc.plugin/)** - such as semaphores and semaphores arrays.
#### Memory
- **[ram](collectors/proc.plugin/)** - collects info about RAM usage.
- **[swap](collectors/proc.plugin/)** - collects info about swap memory usage.
- **[available memory](collectors/proc.plugin/)** - collects the amount of RAM available for userspace processes.
- **[committed memory](collectors/proc.plugin/)** - collects the amount of RAM committed to userspace processes.
- **[Page Faults](collectors/proc.plugin/)** - collects the system page faults (major and minor).
- **[writeback memory](collectors/proc.plugin/)** - collects the system dirty memory and writeback activity.
- **[huge pages](collectors/proc.plugin/)** - collects the amount of RAM used for huge pages.
- **[KSM](collectors/proc.plugin/)** - collects info about Kernel Same Merging (memory dedupper).
- **[Numa](collectors/proc.plugin/)** - collects Numa info on systems that support it.
- **[slab](collectors/proc.plugin/)** - collects info about the Linux kernel memory usage.
#### Disks
- **[block devices](collectors/proc.plugin/)** - per disk: I/O, operations, backlog, utilization, space, etc.
- **[BCACHE](collectors/proc.plugin/)** - detailed performance of SSD caching devices.
- **[DiskSpace](collectors/proc.plugin/)** - monitors disk space usage.
- **[mdstat](collectors/python.d.plugin/mdstat/)** - software RAID.
- **[hddtemp](collectors/python.d.plugin/hddtemp/)** - disk temperatures.
- **[smartd](collectors/python.d.plugin/smartd_log/)** - disk S.M.A.R.T. values.
- **[device mapper](collectors/proc.plugin/)** - naming disks.
- **[Veritas Volume Manager](collectors/proc.plugin/)** - naming disks.
- **[megacli](collectors/python.d.plugin/megacli/)** - adapter, physical drives and battery stats.
- **[adaptec_raid](collectors/python.d.plugin/adaptec_raid/)** - logical and physical devices health metrics.
#### Filesystems
- **[BTRFS](collectors/proc.plugin/)** - detailed
|
