1
2
3
4
5
6
7
8
9
10
11
12
13
14
15
16
17
18
19
20
21
22
23
24
25
26
27
28
29
30
31
32
33
34
35
36
37
38
39
40
41
42
43
44
45
46
47
48
49
50
51
52
53
54
55
56
57
58
59
60
61
62
63
64
65
66
67
68
69
70
71
72
73
74
75
76
77
78
79
80
81
82
83
84
85
86
87
88
89
90
91
92
93
94
95
96
97
98
99
100
101
102
103
104
105
106
107
108
109
110
111
112
113
114
115
116
117
118
119
120
121
122
123
124
125
126
127
128
129
130
131
132
133
134
135
136
137
138
139
140
141
142
143
144
145
146
147
148
149
150
151
152
153
154
155
156
157
158
159
160
161
162
163
164
165
166
167
168
169
170
171
172
173
174
175
176
177
178
179
180
181
182
183
184
185
186
187
188
189
190
191
192
193
194
195
196
197
198
199
200
201
202
203
204
205
206
207
208
209
210
211
212
213
214
215
216
217
218
219
220
221
222
223
224
225
226
227
228
229
230
231
232
233
234
235
236
237
238
239
240
241
242
243
244
245
246
247
248
249
250
251
252
253
254
255
256
257
258
259
260
261
262
263
264
265
266
267
268
269
270
271
272
273
274
275
276
277
278
279
280
281
282
283
284
285
286
287
288
289
290
291
292
293
294
295
296
297
298
299
300
301
302
303
304
305
306
307
308
309
310
311
312
313
314
315
316
317
318
319
320
321
322
323
324
325
326
327
328
329
330
331
332
333
334
335
336
337
338
339
340
341
342
343
344
345
346
347
348
349
350
351
352
353
354
355
356
357
358
359
360
361
362
363
364
365
366
367
368
369
370
371
372
373
374
375
376
377
378
379
380
381
382
383
384
385
386
387
388
389
390
391
392
393
394
395
396
397
398
399
400
401
402
403
404
405
406
407
408
409
410
411
412
413
414
415
416
417
418
419
420
421
422
423
424
425
426
427
428
429
430
431
432
433
434
435
436
437
438
439
440
441
442
443
444
445
446
447
448
449
450
451
452
453
454
455
456
457
458
459
460
461
462
463
464
465
466
467
468
469
470
471
472
473
474
475
476
477
478
479
480
481
482
483
484
485
486
487
488
489
490
491
492
493
494
495
496
497
498
499
500
501
502
503
504
505
506
507
508
509
510
511
512
513
514
515
516
517
518
519
520
521
522
523
524
525
526
527
528
529
530
531
532
533
534
535
536
537
538
539
540
541
542
543
544
545
546
547
548
549
550
551
552
553
554
555
556
557
558
559
560
561
562
563
564
565
566
567
568
569
570
571
572
573
574
575
576
577
578
579
580
581
582
583
584
585
586
587
588
589
590
591
592
593
594
595
596
597
598
599
600
601
602
603
604
605
606
607
608
609
610
611
612
613
614
615
616
617
618
619
620
621
622
623
624
625
626
627
628
629
630
631
632
633
634
635
636
637
638
639
640
641
642
643
644
645
646
647
648
649
650
651
652
653
654
655
656
657
658
659
660
661
662
663
664
665
666
667
668
669
670
671
672
673
674
675
676
677
678
679
680
681
682
683
684
685
686
687
688
689
690
691
692
693
694
695
696
697
698
699
700
701
702
703
704
705
706
707
708
709
710
711
712
713
714
715
716
717
718
719
720
721
722
723
724
725
726
727
728
729
730
731
732
733
734
735
736
737
738
739
740
741
742
743
744
745
746
747
748
749
750
751
752
753
754
755
756
757
758
759
760
761
762
763
764
765
766
767
768
769
770
771
772
773
774
775
776
777
778
779
780
781
782
783
784
785
786
787
788
789
790
791
792
793
794
795
796
797
798
799
800
801
802
803
804
805
806
807
808
809
810
811
812
813
814
815
816
817
818
819
820
821
822
823
824
825
826
827
828
829
830
831
832
833
834
835
836
837
838
839
840
841
842
843
844
845
846
847
848
849
850
851
852
853
854
855
856
|
<p align="center">
<a href="https://www.netdata.cloud#gh-light-mode-only">
<img src="https://www.netdata.cloud/img/readme-images/netdata_readme_logo_light.png" alt="Netdata" width="300"/>
</a>
<a href="https://www.netdata.cloud#gh-dark-mode-only">
<img src="https://www.netdata.cloud/img/readme-images/netdata_readme_logo_dark.png" alt="Netdata" width="300"/>
</a>
</p>
<h3 align="center">Monitor your servers, containers, and applications,<br/>in high-resolution and in real-time.</h3>
<br />
<p align="center">
<a href="https://github.com/netdata/netdata/"><img src="https://img.shields.io/github/stars/netdata/netdata?style=social" alt="GitHub Stars"></a>
<br />
<a href="https://app.netdata.cloud/spaces/netdata-demo?utm_campaign=github_readme_demo_badge"><img src="https://img.shields.io/badge/Live Demo-green" alt="Live Demo"></a>
<a href="https://github.com/netdata/netdata/releases/latest"><img src="https://img.shields.io/github/release/netdata/netdata.svg" alt="Latest release"></a>
<a href="https://github.com/netdata/netdata-nightlies/releases/latest"><img src="https://img.shields.io/github/release/netdata/netdata-nightlies.svg" alt="Latest nightly build"></a>
<br />
<a href="https://bestpractices.coreinfrastructure.org/projects/2231"><img src="https://bestpractices.coreinfrastructure.org/projects/2231/badge" alt="CII Best Practices"></a>
<a href="https://scan.coverity.com/projects/netdata-netdata?tab=overview"><img alt="Coverity Scan" src="https://img.shields.io/coverity/scan/netdata"></a>
<a href="https://www.gnu.org/licenses/gpl-3.0"><img src="https://img.shields.io/badge/License-GPL%20v3%2B-blue.svg" alt="License: GPL v3+"></a>
<br />
<a href="https://discord.com/invite/2mEmfW735j"><img alt="Discord" src="https://img.shields.io/discord/847502280503590932?logo=discord&logoColor=white&label=chat%20on%20discord"></a>
<a href="https://community.netdata.cloud"><img alt="Discourse topics" src="https://img.shields.io/discourse/topics?server=https%3A%2F%2Fcommunity.netdata.cloud%2F&logo=discourse&label=discourse%20forum"></a>
<a href="https://github.com/netdata/netdata/discussions"><img alt="GitHub Discussions" src="https://img.shields.io/github/discussions/netdata/netdata?logo=github&label=github%20discussions"></a>
</p>
<p align="center"><b>Visit the <a href="https://www.netdata.cloud">Project's Home Page</a></b></p>
<hr class="solid">
MENU: **[WHAT IS NEW](#whats-new-and-coming)** | **[GETTING STARTED](#getting-started)** | **[HOW IT WORKS](#how-it-works)** | **[FAQ](#faq)** | **[DOCS](#book-documentation)** | **[COMMUNITY](#tada-community)** | **[CONTRIBUTE](#pray-contribute)**
Netdata collects metrics per second and presents them in beautiful low-latency dashboards. It is designed to run on all of your physical and virtual servers, cloud deployments, Kubernetes clusters, and edge/IoT devices, to monitor your systems, containers, and applications.
It scales nicely from just a single server to thousands of servers, even in complex multi/mixed/hybrid cloud environments, and given enough disk space it can keep your metrics for years.
**WHAT CAN BE MONITORED WITH NETDATA**:<br/>
Netdata monitors all the following:
| Component | Linux | FreeBSD | macOS | Windows* |
|----------------------------------------------------------------------------------------------------:|:-------------------------------------:|:-------:|:-----:|:--------------------------------:|
| **System Resources**<small><br/>CPU, Memory and system shared resources</small> | Full | Yes | Yes | Yes |
| **Storage**<small><br/>Disks, Mount points, Filesystems, RAID arrays</small> | Full | Basic | Basic | Basic |
| **Network**<small><br/>Network Interfaces, Protocols, Firewall, etc</small> | Full | Basic | Basic | Basic |
| **Hardware & Sensors**<small><br/>Fans, Temperatures, Controllers, GPUs, etc</small> | Full | Some | Some | Some |
| **O/S Services**<small><br/>Resources, Performance and Status</small> | Yes<small><br/>`systemd`</small> | - | - | Basic |
| **Logs** | Yes<small><br/>`systemd`-journal | - | - | - |
| **Processes**<small><br/>Resources, Performance, OOM, and more</small> | Yes | Yes | Yes | Yes |
| **Network Connections**<small><br/>Live TCP and UDP sockets per PID</small> | Yes | - | - | - |
| **Containers**<small><br/>Docker/containerd, LXC/LXD, Kubernetes, etc</small> | Yes | - | - | - |
| **VMs** (from the host)<small><br/>KVM, qemu, libvirt, Proxmox, etc</small> | Yes<small><br/>`cgroups`</small> | - | - | Yes<small><br/>`Hyper-V`</small> |
| **Synthetic Checks**<small><br/>Test APIs, TCP ports, Ping, Certificates, etc</small> | Yes | Yes | Yes | Yes |
| **Packaged Applications**<small><br/>nginx, apache, postgres, redis, mongodb,<br/>and hundreds more</small> | Yes | Yes | Yes | Yes |
| **Custom Applications**<small><br/>OpenMetrics, StatsD</small> | Yes | Yes | Yes | Yes |
When Netdata runs on Linux, it monitors every kernel feature available, providing full coverage of all kernel technologies that can be monitored.
Netdata provides full **enterprise hardware** coverage, monitoring all components that provide hardware error reporting, like PCI AER, RAM EDAC, IPMI, S.M.A.R.T., NVMe, Fans, Power, Voltages, and more.
<small> * Netdata runs on Linux, FreeBSD and macOS. For Windows, we rely on Windows Exporter (so a Netdata running on Linux, FreeBSD or macOS is required, next to the monitored Windows servers).</small>
**KEY CHARACTERISTICS**:<br/>
- :boom: **Collects data from 800+ integrations**<br/>
Operating system metrics, container metrics, virtual machines, hardware sensors, applications metrics, OpenMetrics exporters, StatsD, and logs.
- :muscle: **Real-Time, Low-Latency, High-Resolution**<br/>
All data are collected per second and are on the dashboard immediately after data collection.
- :face_in_clouds: **Unsupervised Anomaly Detection**<br/>
Trains multiple Machine-Learning (ML) models for each metric and uses AI to detect anomalies based on the past behavior of each metric.
- :fire: **Powerful Visualization**<br/>
Fully automated dashboard providing corellated visualization of all metrics, allowing you to understand any dataset at first sight, but also to filter, slice and dice the data directly on the dashboards, without the need to learn a query language.
- :bell: **Out of box Alerts**<br/>
Comes with hundreds of alerts out of the box to detect common issues and pitfalls, revealing issues that can easily go unnoticed. It supports several notification methods to let you know when your attention is needed.
- :sunglasses: **Low Maintenance**<br/>
Fully automated in every aspect: automated dashboards, out-of-the-box alerts, auto-detection and auto-discovery of metrics, zero-touch machine-learning, easy scalability and high availability, and CI/CD friendly.
- :star: **Open and Extensible**<br/>
Netdata is a modular platform that can be extended in all possible ways and it also integrates nicely with other monitoring solutions.
---
### :boom: NEW: Network Connections Explorer :boom:
Network Connections viewer is currently in the nightly builds of Netdata!
This tool visualizes all the sockets each server has (IPv4 and IPv6, TCP and UDP). It can classify them as `inbound`, `outbound`, `listen` and `local` and allow filtering on them.
The visualization has 4 sides:
- `public` (ie. public IPs),
- `private` (ie. private and reserved IPs),
- `servers` (ie. listening and inbound sockets),
- `clients` (ie. sockets towards other servers).
The position of each application on the chart is determined by the classification of the sockets it has. To the top are clients, to the bottom are servers, to the right are internet facing applications, to the left is internal network applications.
The size of each application in the chart is determined by the number of sockets it has, and each application is a pie chart representing the percentage of each kind of sockets it has.
---
### :star: Netdata is the most energy-efficient monitoring tool :star:
<p align="center">
<a href="https://www.ivanomalavolta.com/files/papers/ICSOC_2023.pdf#gh-dark-mode-only">
<img src="https://github.com/netdata/netdata/assets/139226121/7118757a-38fb-48d7-b12a-53e709a8e8c0" alt="Energy Efficiency" width="1000"/>
</a>
<a href="https://www.ivanomalavolta.com/files/papers/ICSOC_2023.pdf#gh-light-mode-only">
<img src="https://github.com/netdata/netdata/assets/139226121/4f64cbb6-05e4-48e3-b7c0-d1b79e37e219" alt="Energy efficiency" width="1000"/>
</a>
</p>
Dec 11, 2023: [University of Amsterdam published a study](https://twitter.com/IMalavolta/status/1734208439096676680) related to the impact of monitoring tools for Docker based systems, aiming to answer 2 questions:
1. **What is the impact of monitoring tools on the energy efficiency of Docker-based systems?**
2. **What is the impact of monitoring tools on the performance of Docker-based systems?**
- 🚀 Netdata excels in energy efficiency: **"... Netdata being the most energy-efficient tool ..."**, as the study says.
- 🚀 Netdata excels in CPU Usage, RAM Usage and Execution Time, and has a similar impact in Network Traffic as Prometheus.
The study did not normalize the results based on the number of metrics collected. Given that Netdata usually collects significantly more metrics than the other tools, Netdata managed to outperform the other tools, while ingesting a much higher number of metrics. [Read the full study here](https://www.ivanomalavolta.com/files/papers/ICSOC_2023.pdf).
---
<p align="center">
<a href="https://blog.netdata.cloud/netdata-vs-prometheus-performance-analysis#gh-light-mode-only">
<img src="https://github.com/netdata/netdata/assets/139226121/6c21ae39-8656-45c3-bc85-4b012679d2bb" alt="Netdata" width="1000"/>
</a>
<a href="https://blog.netdata.cloud/netdata-vs-prometheus-performance-analysis#gh-dark-mode-only">
<img src="https://github.com/netdata/netdata/assets/139226121/f2dbde46-d3dd-4807-bd34-966da4d0ec22" alt="Netdata" width="1000"/>
</a>
</p>
On the same workload, Netdata uses **35% less CPU**, **49% less RAM**, **12% less bandwidth**, **98% less disk I/O**, and is **75% more disk space efficient** on high resolution metrics storage, while providing more than a year of overall retention on the same disk footprint Prometheus offers 7 days of retention. [Read the full analysis in our blog](https://blog.netdata.cloud/netdata-vs-prometheus-performance-analysis/).
---
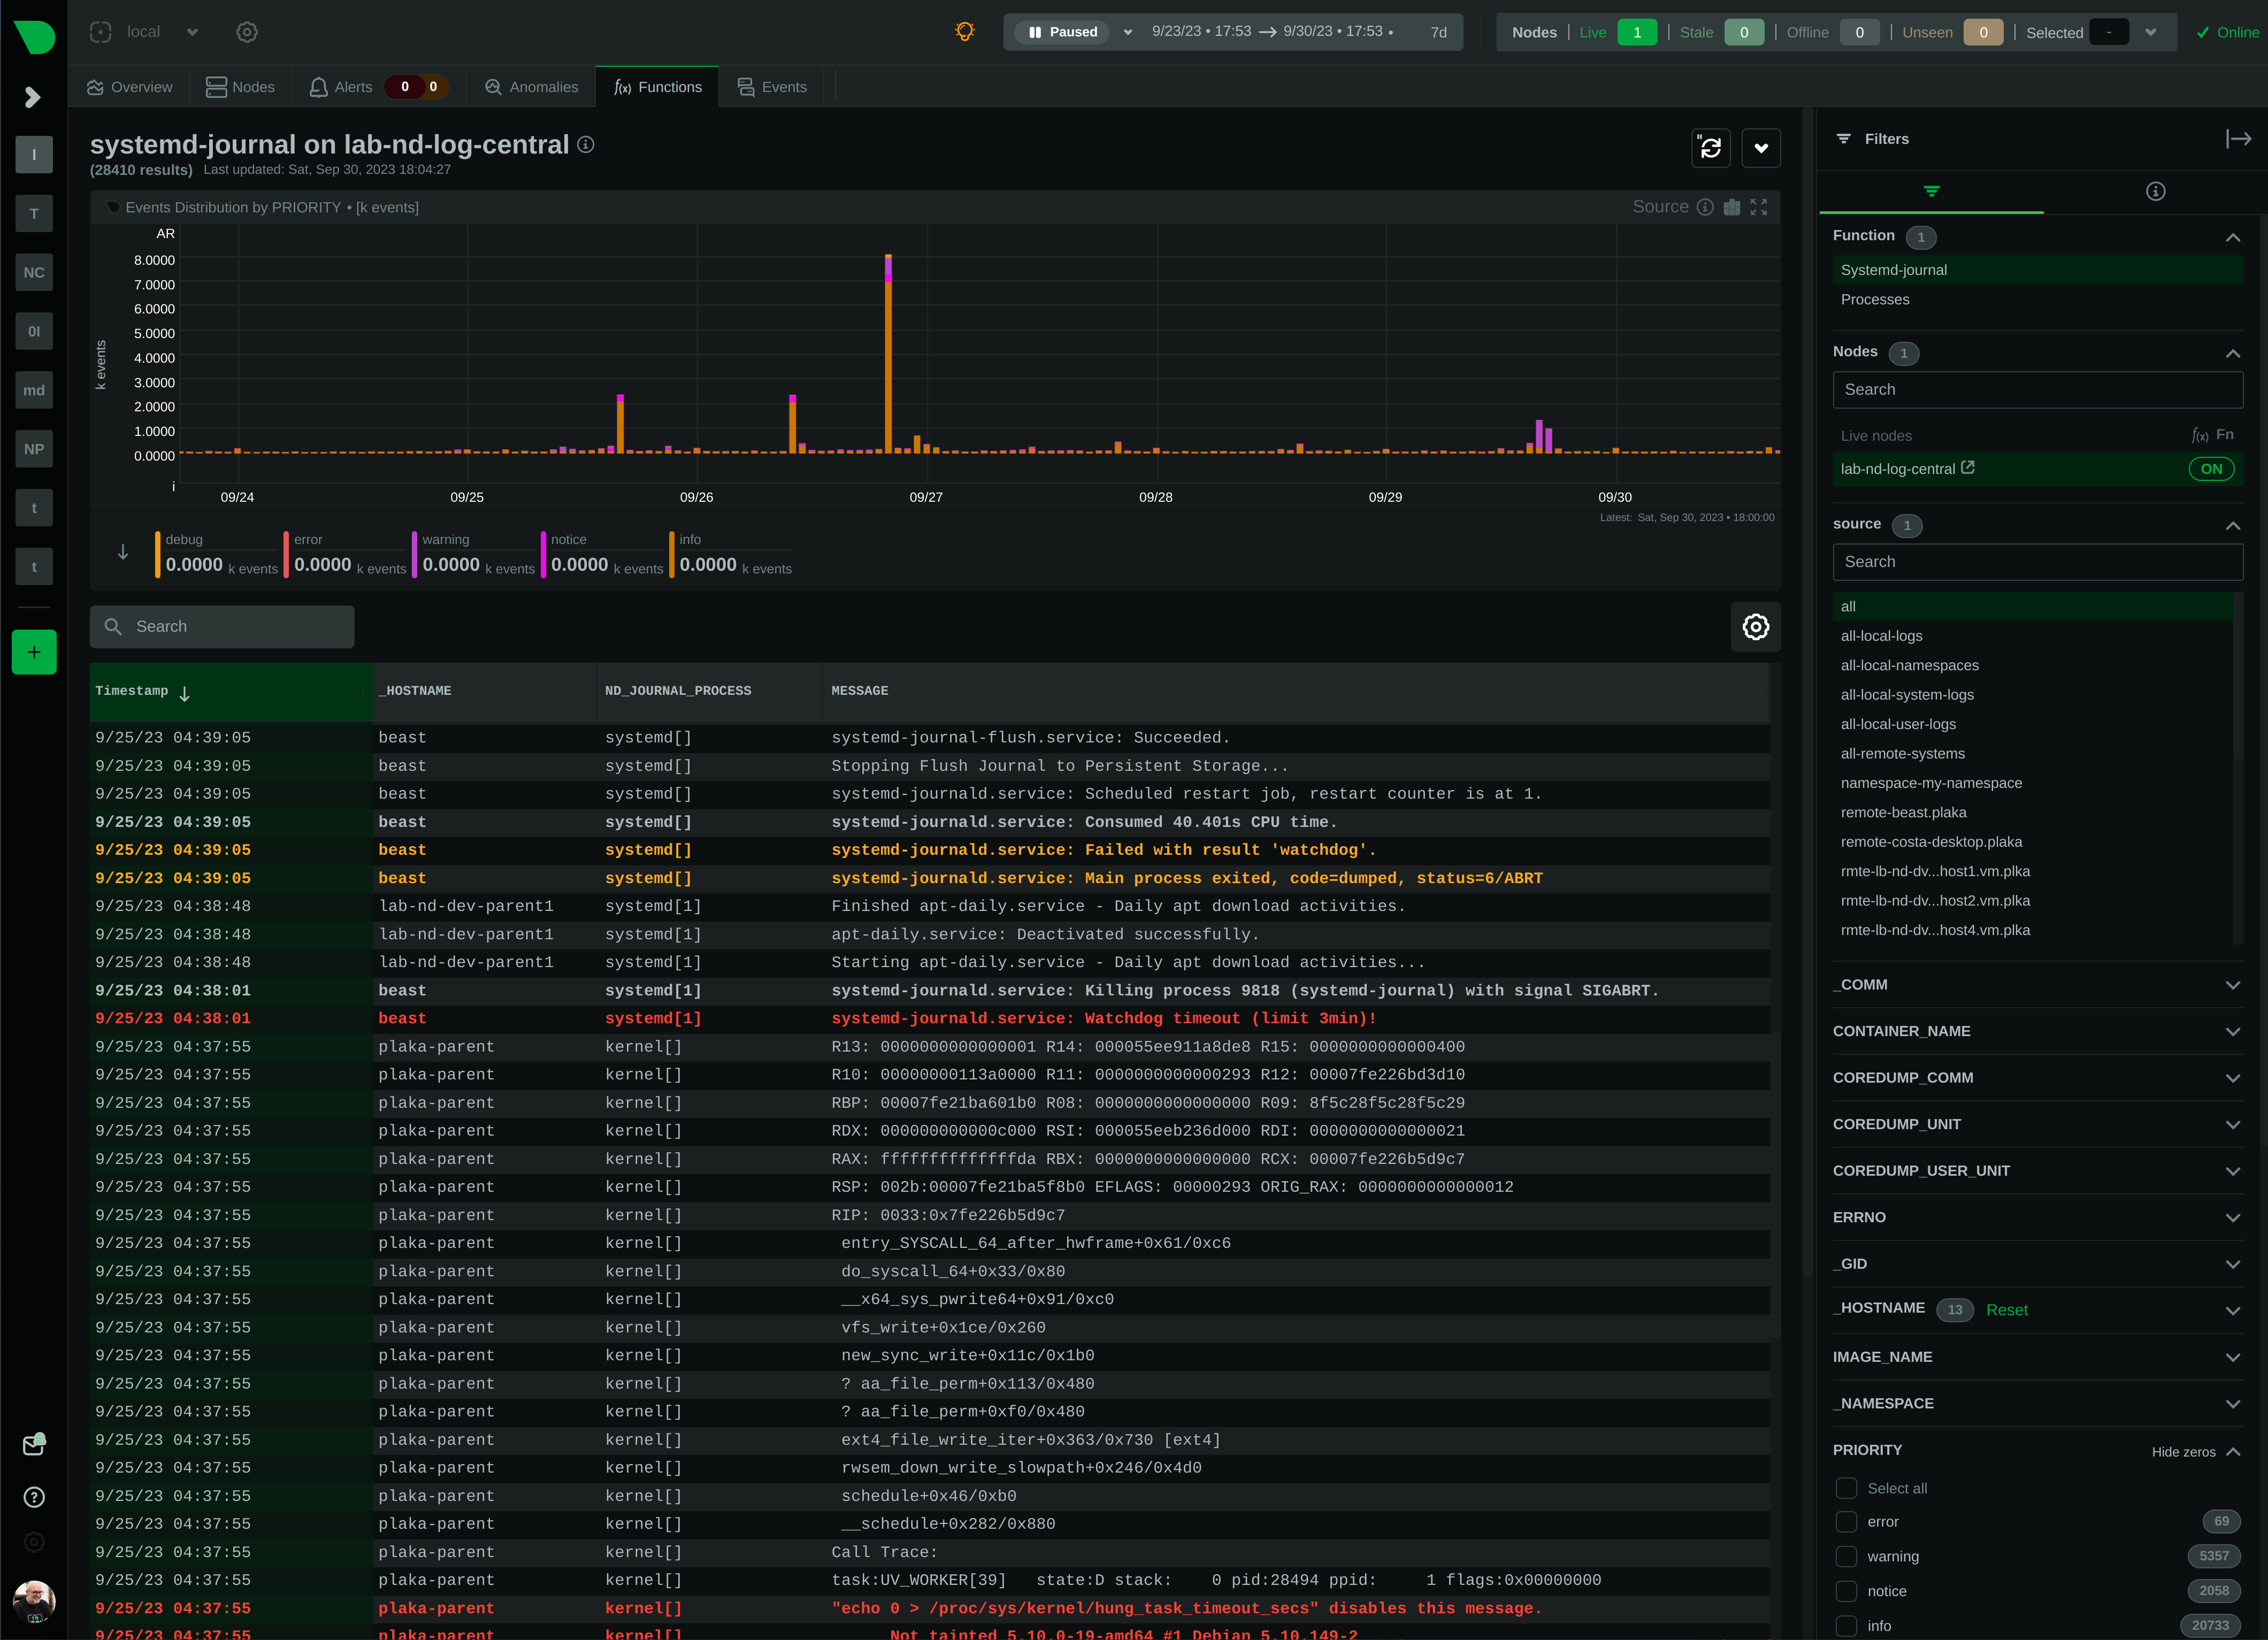
NEW: **Netdata and LOGS !** 🥳</br>
Check the [systemd-journal plugin of Netdata](https://github.com/netdata/netdata/tree/master/src/collectors/systemd-journal.plugin), that allows you to view, explore, analyze and query `systemd` journal logs!
---
<br/>
<p align="center">
<img src="https://raw.githubusercontent.com/cncf/artwork/master/other/cncf/horizontal/white/cncf-white.svg#gh-dark-mode-only" alt="CNCF" width="300">
<img src="https://raw.githubusercontent.com/cncf/artwork/master/other/cncf/horizontal/black/cncf-black.svg#gh-light-mode-only" alt="CNCF" width="300">
<br />
Netdata actively supports and is a member of the Cloud Native Computing Foundation (CNCF)<br />
<br/>
...and due to your love :heart:, it is one of the most :star:'d projects in the <a href="https://landscape.cncf.io/?item=observability-and-analysis--observability--netdata">CNCF landscape</a>!
</p>
<br/>
<hr class="solid">
<p align="center">
<b>Below is an animated image, but you can see Netdata live!</b><br/>
<a href="https://frankfurt.netdata.rocks"><b>FRANKFURT</b></a> |
<a href="https://newyork.netdata.rocks"><b>NEWYORK</b></a> |
<a href="https://atlanta.netdata.rocks"><b>ATLANTA</b></a> |
<a href="https://sanfrancisco.netdata.rocks"><b>SANFRANCISCO</b></a> |
<a href="https://toronto.netdata.rocks"><b>TORONTO</b></a> |
<a href="https://singapore.netdata.rocks"><b>SINGAPORE</b></a> |
<a href="https://bangalore.netdata.rocks"><b>BANGALORE</b></a>
<br/>
<i>They are clustered Netdata Parents. They all have the same data. <b>Select the one closer to you.</b></i>
<br/>
<i>All these run with the default configuration. We only clustered them to have multi-node dashboards.</i>
</p>
<hr class="solid">
> **Important** :bulb:<br/>
> People get addicted to Netdata. Once you use it on your systems, **there's no going back!**<br/>
<hr class="solid">
## What's New and Coming?
<details><summary>Click to see our immediate development plans and a summary view of the last 12 months' releases...</summary>
<br/>
| What | Description | When | Status |
|:---------------------------------------:|:---------------------------------------------------------------------------------------------------:|:-------------:|:-----------------------------------------------------------------------------------------------------------------------:|
| **Netdata Cloud<br/>On-Prem** | **Netdata Cloud available for On-Prem installation!** | **available** | [fill this form](https://www.netdata.cloud/contact-us/?subject=on-prem) |
| State manager monitor | Centralized and immediate visibility to the state of your apps and services. | soon | planned |
| More Customizable | Set default settings for all charts and views! | soon | in progress |
| AWS Integrated billing | Run Netdata our your AWS instances and get your billing integrated on your AWS account. | soon | in progress |
| Alert Silence Manager R2 | Improvements to the Alert Silencing Manager with recurring schedules and more! | soon | in progress |
| Okta SSO | Facilitate the integration of Netdata into your organizations user management process. | soon | in progress |
| Prometheus/OpenMetrics<br/>improvements | Allow users to configure how metrics should be ingested and presented. | soon | in progress |
| Loki logs | Another Logs integration, bring your Loki logs onto the UI! | soon | in progress |
| UCUM Units | Migrate all metrics to the Unified Code for Units of Measure. | soon | in progress |
| Dynamic Configurations | Configure Alerts and Data Collectors from the UI! | soon | Beta release [v1.45](https://github.com/netdata/netdata/releases/tag/v1.45.0#v1450-dynamic-configuration) - in progress |
| WebRTC | Browser to Agent communication via WebRTC. | later | interrupted |
| Advanced Troubleshooting | Expanded view of dashboard charts integrating Metrics Correlations, Anomaly Advisor, and many more. | later | interrupted |
| Homelab plan | Unlimited Netdata plan targeted for homelabbers or students. | Feb<br/>2024 | [v1.45](https://github.com/netdata/netdata/releases/tag/v1.45.0#v1450-homelab-plan) |
| Easy Custom<br/>Dashboards | Drag and drop charts to create custom dashboards on the fly, while troubleshooting! | Feb<br/>2024 | [v1.45](https://github.com/netdata/netdata/releases/tag/v1.45.0#v1450-custom-dashboards) |
| Netdata Notifications<br/>Mobile App | You can receive and manage alert and reachability notifications from your subscribed spaces. | Jan<br/>2024 | [v1.45](https://github.com/netdata/netdata/releases/tag/v1.45.0#v1450-mobile-app) |
| `systemd` journal | View the `systemd` journal logs of your systems on the dashboard. | Oct<br/>2023 | [v1.43](https://github.com/netdata/netdata/releases/tag/v1.43.0) |
| Integrations | Netdata Integrations Marketplace! | Aug<br/>2023 | [v1.42](https://github.com/netdata/netdata/releases#v1420-integrations-marketplace) |
| New Agent UI | Now Netdata Cloud and Netdata Agent share the same dashboard! | Jul<br/>2023 | [v1.41](https://github.com/netdata/netdata/releases/tag/v1.41.0#v1410-one-dashboard) |
| Summary Dashboards | High level tiles everywhere! | Jun<br/>2023 | [v1.40](https://github.com/netdata/netdata/releases/tag/v1.40.0#v1400-visualization-summary-dashboards) |
| Machine Learning | Multiple ML models per metric. | Jun<br/>2023 | [v1.40](https://github.com/netdata/netdata/releases/tag/v1.40.0#v1400-ml-extended-training) |
| SSL | Netdata Agent gets a new SSL layer. | Jun<br/>2023 | [v1.40](https://github.com/netdata/netdata/releases/tag/v1.40.0#v1400-streaming) |
| New Cloud UI | Filter, slice and dice any dataset from the UI! ML-first! | May<br/>2023 | [v1.39](https://github.com/netdata/netdata/releases/tag/v1.39.0) |
| Microsoft Windows | Monitor Windows hosts and apps! | May<br/>2023 | [v1.39](https://github.com/netdata/netdata/releases/tag/v1.39.0#v1390-windows-support) |
| Virtual Nodes | Go collectors can now be assigned to virtual nodes! | May<br/>2023 |
|
