
diff options
Diffstat (limited to 'docs/guides/monitor/anomaly-detection.md')
| -rw-r--r-- | docs/guides/monitor/anomaly-detection.md | 6 |
1 files changed, 3 insertions, 3 deletions
diff --git a/docs/guides/monitor/anomaly-detection.md b/docs/guides/monitor/anomaly-detection.md index e98c5c02e5..7f7727f53c 100644 --- a/docs/guides/monitor/anomaly-detection.md +++ b/docs/guides/monitor/anomaly-detection.md @@ -16,7 +16,7 @@ As of [`v1.32.0`](https://github.com/netdata/netdata/releases/tag/v1.32.0), Netd This means that in addition to collecting raw value metrics, the Netdata agent will also produce an [`anomaly-bit`](https://learn.netdata.cloud/docs/agent/ml#anomaly-bit---100--anomalous-0--normal) every second which will be `100` when recent raw metric values are considered anomalous by Netdata and `0` when they look normal. Once we aggregate beyond one second intervals this aggregated `anomaly-bit` becomes an ["anomaly rate"](https://learn.netdata.cloud/docs/agent/ml#anomaly-rate---averageanomaly-bit). -To be as concrete as possible, the below api call shows how to access the raw anomaly bit of the `system.cpu` chart from the [london.my-netdata.io](https://london.my-netdata.io) Netdata demo server. Passing `options=anomaly-bit` returns the anomay bit instead of the raw metric value. +To be as concrete as possible, the below api call shows how to access the raw anomaly bit of the `system.cpu` chart from the [london.my-netdata.io](https://london.my-netdata.io) Netdata demo server. Passing `options=anomaly-bit` returns the anomaly bit instead of the raw metric value. ``` https://london.my-netdata.io/api/v1/data?chart=system.cpu&options=anomaly-bit @@ -28,13 +28,13 @@ If we aggregate the above to just 1 point by adding `points=1` we get an "[Anoma https://london.my-netdata.io/api/v1/data?chart=system.cpu&options=anomaly-bit&points=1 ``` -The fundamentals of Netdata's anomaly detection approach and implmentation are covered in lots more detail in the [agent ML documentation](https://learn.netdata.cloud/docs/agent/ml). +The fundamentals of Netdata's anomaly detection approach and implementation are covered in lots more detail in the [agent ML documentation](https://learn.netdata.cloud/docs/agent/ml). This guide will explain how to get started using these ML based anomaly detection capabilities within Netdata. ## Anomaly Advisor -The [Anomaly Advisor](https://learn.netdata.cloud/docs/cloud/insights/anomaly-advisor) is the flagship anomaly detection feature within Netdata. In the "Anomalies" tab of Netdata you will see an overall "Anomaly Rate" chart that aggregates node level anomaly rate for all nodes in a space. The aim of this chart is to make it easy to quickly spot periods of time where the overall "[node anomaly rate](https://learn.netdata.cloud/docs/agent/ml#node-anomaly-rate)" is evelated in some unusual way and for what node or nodes this relates to. +The [Anomaly Advisor](https://learn.netdata.cloud/docs/cloud/insights/anomaly-advisor) is the flagship anomaly detection feature within Netdata. In the "Anomalies" tab of Netdata you will see an overall "Anomaly Rate" chart that aggregates node level anomaly rate for all nodes in a space. The aim of this chart is to make it easy to quickly spot periods of time where the overall "[node anomaly rate](https://learn.netdata.cloud/docs/agent/ml#node-anomaly-rate)" is elevated in some unusual way and for what node or nodes this relates to. 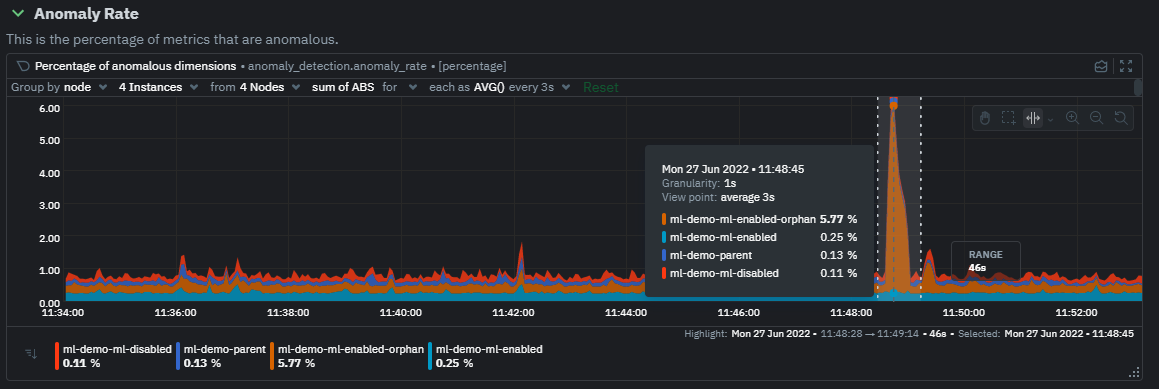 |