
diff options
| -rw-r--r-- | collectors/COLLECTORS.md | 21 | ||||
| -rw-r--r-- | collectors/python.d.plugin/alarms/README.md | 2 | ||||
| -rw-r--r-- | collectors/python.d.plugin/zscores/README.md | 2 | ||||
| -rw-r--r-- | collectors/statsd.plugin/README.md | 2 | ||||
| -rw-r--r-- | docs/cloud/cheatsheet.md | 4 | ||||
| -rw-r--r-- | docs/cloud/insights/anomaly-advisor.md | 9 | ||||
| -rw-r--r-- | docs/cloud/insights/metric-correlations.md | 2 | ||||
| -rw-r--r-- | docs/cloud/manage/view-plan-billing.md | 2 | ||||
| -rw-r--r-- | docs/cloud/visualize/dashboards.md | 3 | ||||
| -rw-r--r-- | docs/guides/monitor/anomaly-detection.md | 8 | ||||
| -rw-r--r-- | docs/guides/monitor/kubernetes-k8s-netdata.md | 2 | ||||
| -rw-r--r-- | docs/guides/monitor/pi-hole-raspberry-pi.md | 25 | ||||
| -rw-r--r-- | docs/guides/troubleshoot/troubleshooting-agent-with-cloud-connection.md | 2 | ||||
| -rw-r--r-- | docs/store/distributed-data-architecture.md | 2 | ||||
| -rw-r--r-- | health/REFERENCE.md | 241 | ||||
| -rw-r--r-- | packaging/installer/methods/kickstart.md | 8 | ||||
| -rw-r--r-- | packaging/installer/methods/macos.md | 10 | ||||
| -rw-r--r-- | packaging/installer/methods/manual.md | 8 | ||||
| -rw-r--r-- | packaging/installer/methods/offline.md | 8 |
19 files changed, 148 insertions, 213 deletions
diff --git a/collectors/COLLECTORS.md b/collectors/COLLECTORS.md index 07efd2174c..54bab313f9 100644 --- a/collectors/COLLECTORS.md +++ b/collectors/COLLECTORS.md @@ -1,12 +1,3 @@ -<!-- -title: "Monitor anything with Netdata" -description: "Netdata gathers real-time metrics from hundreds of data sources using collectors. Most require zero configuration and are pre-configured out of the box." -custom_edit_url: "https://github.com/netdata/netdata/edit/master/collectors/COLLECTORS.md" -sidebar_label: "Monitor" -learn_status: "Published" -learn_rel_path: "Integrations/Monitor" ---> - # Monitor anything with Netdata Netdata uses collectors to help you gather metrics from your favorite applications and services and view them in @@ -31,13 +22,13 @@ accompanying configuration file. If you don't see the app/service you'd like to monitor in this list: -- If your application has a Prometheus endpoint, Netdata can monitor it! Look at our +- If your application has a Prometheus endpoint, Netdata can monitor it! Look at our [generic Prometheus collector](https://github.com/netdata/go.d.plugin/blob/master/modules/prometheus/README.md). -- If your application is instrumented to expose [StatsD](https://blog.netdata.cloud/introduction-to-statsd/) metrics, +- If your application is instrumented to expose [StatsD](https://blog.netdata.cloud/introduction-to-statsd/) metrics, see our [generic StatsD collector](https://github.com/netdata/netdata/blob/master/collectors/statsd.plugin/README.md). -- If you have data in CSV, JSON, XML or other popular formats, you may be able to use our +- If you have data in CSV, JSON, XML or other popular formats, you may be able to use our [generic structured data (Pandas) collector](https://github.com/netdata/netdata/blob/master/collectors/python.d.plugin/pandas/README.md), - Check out our [GitHub issues](https://github.com/netdata/netdata/issues). Use the search bar to look for previous @@ -47,12 +38,12 @@ If you don't see the app/service you'd like to monitor in this list: a [feature request](https://github.com/netdata/netdata/issues/new/choose) on GitHub. - If you have basic software development skills, you can add your own plugin - in [Go](https://learn.netdata.cloud/docs/agent/collectors/go.d.plugin#how-to-develop-a-collector) + in [Go](https://github.com/netdata/go.d.plugin/blob/master/README.md#how-to-develop-a-collector) or [Python](https://github.com/netdata/netdata/blob/master/docs/guides/python-collector.md) ## Available Collectors -- [Supported collectors list](#supported-collectors-list) +- [Monitor anything with Netdata](#monitor-anything-with-netdata) - [Add your application to Netdata](#add-your-application-to-netdata) - [Available Collectors](#available-collectors) - [Service and application collectors](#service-and-application-collectors) @@ -657,7 +648,7 @@ $ sudo echo "clickhouse: yes" >> /etc/netdata/python.d.conf $ sudo vi /etc/netdata/python.d/clickhouse.conf # restart netdata -# see docs for more information: https://learn.netdata.cloud/docs/configure/start-stop-restart +# see docs for more information: https://github.com/netdata/netdata/blob/master/docs/configure/start-stop-restart.md $ sudo systemctl restart netdata ``` diff --git a/collectors/python.d.plugin/alarms/README.md b/collectors/python.d.plugin/alarms/README.md index 6943c54768..0f956b291c 100644 --- a/collectors/python.d.plugin/alarms/README.md +++ b/collectors/python.d.plugin/alarms/README.md @@ -8,7 +8,7 @@ learn_rel_path: "Integrations/Monitor/Netdata" # Alarms -This collector creates an 'Alarms' menu with one line plot showing alarm states over time. Alarm states are mapped to integer values according to the below default mapping. Any alarm status types not in this mapping will be ignored (Note: This mapping can be changed by editing the `status_map` in the `alarms.conf` file). If you would like to learn more about the different alarm statuses check out the docs [here](https://learn.netdata.cloud/docs/agent/health/reference#alarm-statuses). +This collector creates an 'Alarms' menu with one line plot showing alarm states over time. Alarm states are mapped to integer values according to the below default mapping. Any alarm status types not in this mapping will be ignored (Note: This mapping can be changed by editing the `status_map` in the `alarms.conf` file). If you would like to learn more about the different alarm statuses check out the docs [here](https://github.com/netdata/netdata/blob/master/health/REFERENCE.md#alarm-statuses). ``` { diff --git a/collectors/python.d.plugin/zscores/README.md b/collectors/python.d.plugin/zscores/README.md index ded28c1c40..e8003e6b5d 100644 --- a/collectors/python.d.plugin/zscores/README.md +++ b/collectors/python.d.plugin/zscores/README.md @@ -87,7 +87,7 @@ the `zscores.conf` files alone to begin with. Then you can return to it later if more once the collector is running for a while. Edit the `python.d/zscores.conf` configuration file using `edit-config` from the your -agent's [config directory](https://learn.netdata.cloud/guides/step-by-step/step-04#find-your-netdataconf-file), which is +agent's [config directory](https://github.com/netdata/netdata/blob/master/docs/configure/nodes.md#the-netdata-config-directory), which is usually at `/etc/netdata`. ```bash diff --git a/collectors/statsd.plugin/README.md b/collectors/statsd.plugin/README.md index 1526453561..dd74923ec0 100644 --- a/collectors/statsd.plugin/README.md +++ b/collectors/statsd.plugin/README.md @@ -983,7 +983,7 @@ At this point, you have used StatsD to gather metrics for k6, creating a whole n Netdata dashboard in the process. Moreover, you can further customize the icon of the particular section, as well as the description for each chart. -To edit the section, please follow the Netdata [documentation](https://learn.netdata.cloud/docs/agent/web/gui#customizing-the-local-dashboard). +To edit the section, please follow the Netdata [documentation](https://github.com/netdata/netdata/blob/master/web/gui/README.md#customizing-the-local-dashboard). While the following configuration will be placed in a new file, as the documentation suggests, it is instructing to use `dashboard_info.js` as a template. Open the file and see how the rest of sections and collectors have been defined. diff --git a/docs/cloud/cheatsheet.md b/docs/cloud/cheatsheet.md index 531f65f4f2..4dea807274 100644 --- a/docs/cloud/cheatsheet.md +++ b/docs/cloud/cheatsheet.md @@ -25,7 +25,7 @@ To do so, sign in to Netdata Cloud, click the `Claim Nodes` button, choose the ` ## Metrics collection & retention You can tweak your settings in the netdata.conf file. -📄 [Find your netdata.conf file](https://learn.netdata.cloud/guides/step-by-step/step-04#find-your-netdataconf-file) +📄 [Find your netdata.conf file](https://github.com/netdata/netdata/blob/master/daemon/config/README.md) Open a new terminal and navigate to the netdata.conf file. Use the edit-config script to make changes: `sudo ./edit-config netdata.conf` @@ -93,7 +93,7 @@ $ sudo ./edit-config python.d/anomalies.conf #### The Netdata config directory: `/etc/netdata` > If you don't have such a directory: -> 📄 [Find your netdata.conf file](https://learn.netdata.cloud/guides/step-by-step/step-04#find-your-netdataconf-file) +> 📄 [Find your netdata.conf file](https://github.com/netdata/netdata/blob/master/daemon/config/README.md) > The cheatsheet assumes you’re running all commands from within the Netdata config directory! #### Edit Netdata's main config file: `$ sudo ./edit-config netdata.conf` diff --git a/docs/cloud/insights/anomaly-advisor.md b/docs/cloud/insights/anomaly-advisor.md index ff5cce1455..4804dbc161 100644 --- a/docs/cloud/insights/anomaly-advisor.md +++ b/docs/cloud/insights/anomaly-advisor.md @@ -21,7 +21,7 @@ interest. If you are running a Netdata version higher than `v1.35.0-29-nightly` you will be able to use the Anomaly Advisor out of the box with zero configuration. If you are on an earlier Netdata version you will need to first enable ML on your nodes by following the steps below. -To enable the Anomaly Advisor you must first enable ML on your nodes via a small config change in `netdata.conf`. Once the anomaly detection models have trained on the Agent (with default settings this takes a couple of hours until enough data has been seen to train the models) you will then be able to enable the Anomaly Advisor feature in Netdata Cloud. +To enable the Anomaly Advisor you must first enable ML on your nodes via a small config change in `netdata.conf`. Once the anomaly detection models have trained on the Agent (with default settings this takes a couple of hours until enough data has been seen to train the models) you will then be able to enable the Anomaly Advisor feature in Netdata Cloud. ### Enable ML on Netdata Agent @@ -32,7 +32,7 @@ To enable ML on your Netdata Agent, you need to edit the `[ml]` section in your enabled = yes ``` -At a minimum you just need to set `enabled = yes` to enable ML with default params. More details about configuration can be found in the [Netdata Agent ML docs](https://learn.netdata.cloud/docs/agent/ml#configuration). +At a minimum you just need to set `enabled = yes` to enable ML with default params. More details about configuration can be found in the [Netdata Agent ML docs](https://github.com/netdata/netdata/blob/master/ml/README.md#configuration). When you have finished your configuration, restart Netdata with a command like `sudo systemctl restart netdata` for the config changes to take effect. You can find more info on restarting Netdata [here](https://github.com/netdata/netdata/blob/master/docs/configure/start-stop-restart.md). @@ -44,7 +44,7 @@ Once this line flattens out all configured metrics should have models trained an ## Using Anomaly Advisor -To use the Anomaly Advisor, go to the "anomalies" tab. Once you highlight a particular timeframe of interest, a selection of the most anomalous dimensions will appear below. +To use the Anomaly Advisor, go to the "anomalies" tab. Once you highlight a particular timeframe of interest, a selection of the most anomalous dimensions will appear below. The aim here is to surface the most anomalous metrics in the space or room for the highlighted window to try and cut down on the amount of manual searching required to get to the root cause of your issues. @@ -68,7 +68,7 @@ You can expand any sparkline chart to see the underlying raw data to see how it 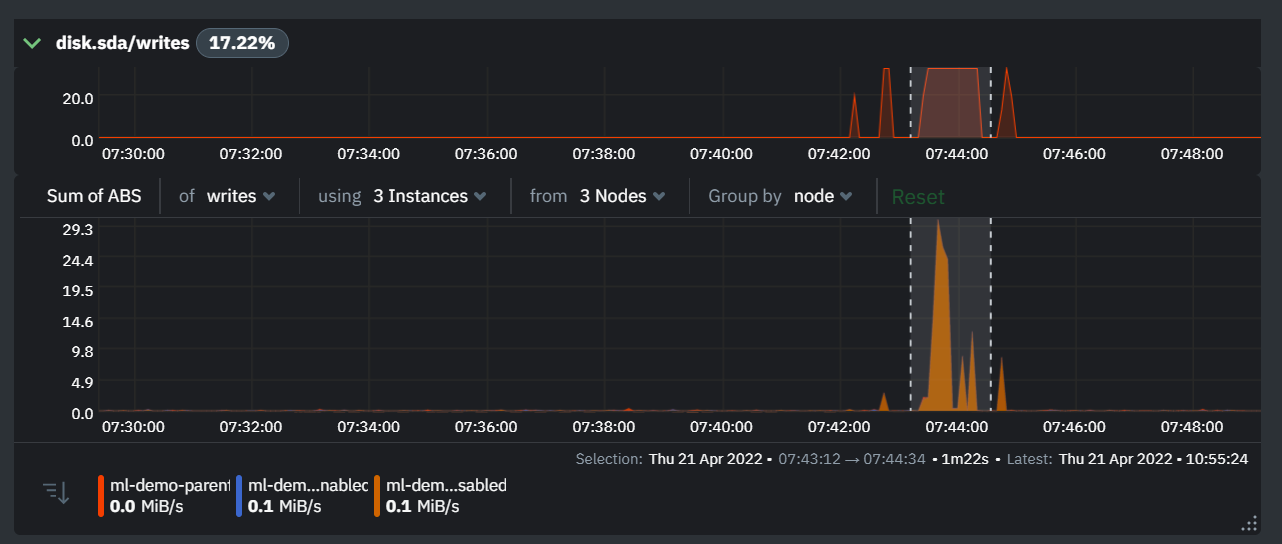 -On the upper right hand side of the page you can select which nodes to filter on if you wish to do so. The ML training status of each node is also displayed. +On the upper right hand side of the page you can select which nodes to filter on if you wish to do so. The ML training status of each node is also displayed. On the lower right hand side of the page an index of anomaly rates is displayed for the highlighted timeline of interest. The index is sorted from most anomalous metric (highest anomaly rate) to least (lowest anomaly rate). Clicking on an entry in the index will scroll the rest of the page to the corresponding anomaly rate sparkline for that metric. @@ -80,6 +80,7 @@ On the lower right hand side of the page an index of anomaly rates is displayed You can read more detail on how anomaly detection in the Netdata Agent works in our [Agent docs](https://github.com/netdata/netdata/blob/master/ml/README.md). 🚧 **Note**: This functionality is still **under active development** and considered experimental. We dogfood it internally and among early adopters within the Netdata community to build the feature. If you would like to get involved and help us with feedback, you can reach us through any of the following channels: + - Email us at analytics-ml-team@netdata.cloud - Comment on the [beta launch post](https://community.netdata.cloud/t/anomaly-advisor-beta-launch/2717) in the Netdata community - Join us in the [🤖-ml-powered-monitoring](https://discord.gg/4eRSEUpJnc) channel of the Netdata discord. diff --git a/docs/cloud/insights/metric-correlations.md b/docs/cloud/insights/metric-correlations.md index 7eb7d17bc5..1ba15c0f5b 100644 --- a/docs/cloud/insights/metric-correlations.md +++ b/docs/cloud/insights/metric-correlations.md @@ -74,7 +74,7 @@ Should you still want to, disabling nodes for Metric Correlation on the agent is ## Usage tips! -- When running Metric Correlations from the [Overview tab](https://learn.netdata.cloud/docs/cloud/visualize/overview#overview) across multiple nodes, you might find better results if you iterate on the initial results by grouping by node to then filter to nodes of interest and run the Metric Correlations again. So a typical workflow in this case would be to: +- When running Metric Correlations from the [Overview tab](https://github.com/netdata/netdata/blob/master/docs/cloud/visualize/overview.md#overview-and-single-node-view) across multiple nodes, you might find better results if you iterate on the initial results by grouping by node to then filter to nodes of interest and run the Metric Correlations again. So a typical workflow in this case would be to: - If unsure which nodes you are interested in then run MC on all nodes. - Within the initial results returned group the most interesting chart by node to see if the changes are across all nodes or a subset of nodes. - If you see a subset of nodes clearly jump out when you group by node, then filter for just those nodes of interest and run the MC again. This will result in less aggregation needing to be done by Netdata and so should help give clearer results as you interact with the slider. diff --git a/docs/cloud/manage/view-plan-billing.md b/docs/cloud/manage/view-plan-billing.md index 8fd3c4380c..5d4c50a7e1 100644 --- a/docs/cloud/manage/view-plan-billing.md +++ b/docs/cloud/manage/view-plan-billing.md @@ -55,7 +55,7 @@ After an initial failed payment, we will attempt to process your payment every w For the next 24 hours, you will be able to use all your current notification method configurations. After 24 hours, any of the notification method configurations that aren't available on your space's plan will be automatically disabled. -Cancellation might affect users in your Space. Please check what roles are available on the [Community plan](https://learn.netdata.cloud/docs/nightly/concepts/netdata-plans#areas-impacted-by-plans). Users with unavailable roles on the Community plan will immediately have restricted access to the Space. +Cancellation might affect users in your Space. Please check what roles are available on the [Community plan](https://github.com/netdata/netdata/blob/master/docs/cloud/manage/plans.md#areas-impacted-by-plans). Users with unavailable roles on the Community plan will immediately have restricted access to the Space. #### 3. Which currencies do you support? diff --git a/docs/cloud/visualize/dashboards.md b/docs/cloud/visualize/dashboards.md index 70fe4d20bc..b5a6120edf 100644 --- a/docs/cloud/visualize/dashboards.md +++ b/docs/cloud/visualize/dashboards.md @@ -50,8 +50,7 @@ node. If you select **All Nodes**, you will add a [composite chart](/docs/cloud/ your new dashboard. Next, select the context. You'll see a preview of the chart before you finish adding it. The charts you add to any dashboard are fully interactive, just like the charts in an Agent dashboard or a single node's -dashboard in Cloud. Zoom in and out, highlight timeframes, and more. See our -[Agent dashboard docs](https://learn.netdata.cloud/docs/agent/web#using-charts) for all the shortcuts. +dashboard in Cloud. Zoom in and out, highlight timeframes, and more. Charts also synchronize as you interact with them, even across contexts _or_ nodes. diff --git a/docs/guides/monitor/anomaly-detection.md b/docs/guides/monitor/anomaly-detection.md index 9c4d74997c..4552e7a723 100644 --- a/docs/guides/monitor/anomaly-detection.md +++ b/docs/guides/monitor/anomaly-detection.md @@ -53,13 +53,13 @@ Pressing the anomalies icon (next to the information icon in the chart header) w ## Anomaly Rate Based Alerts -It is possible to use the `anomaly-bit` when defining traditional Alerts within netdata. The `anomaly-bit` is just another `options` parameter that can be passed as part of an [alarm line lookup](https://learn.netdata.cloud/docs/agent/health/reference#alarm-line-lookup). +It is possible to use the `anomaly-bit` when defining traditional Alerts within netdata. The `anomaly-bit` is just another `options` parameter that can be passed as part of an [alarm line lookup](https://github.com/netdata/netdata/blob/master/docs/configure/start-stop-restart.md#alarm-line-lookup). You can see some example ML based alert configurations below: -- [Anomaly rate based CPU dimensions alarm](https://learn.netdata.cloud/docs/agent/health/reference#example-8---anomaly-rate-based-cpu-dimensions-alarm) -- [Anomaly rate based CPU chart alarm](https://learn.netdata.cloud/docs/agent/health/reference#example-9---anomaly-rate-based-cpu-chart-alarm) -- [Anomaly rate based node level alarm](https://learn.netdata.cloud/docs/agent/health/reference#example-10---anomaly-rate-based-node-level-alarm) +- [Anomaly rate based CPU dimensions alarm](https://github.com/netdata/netdata/blob/master/docs/configure/start-stop-restart.md#example-8---anomaly-rate-based-cpu-dimensions-alarm) +- [Anomaly rate based CPU chart alarm](https://github.com/netdata/netdata/blob/master/docs/configure/start-stop-restart.md#example-9---anomaly-rate-based-cpu-chart-alarm) +- [Anomaly rate based node level alarm](https://github.com/netdata/netdata/blob/master/docs/configure/start-stop-restart.md#example-10---anomaly-rate-based-node-level-alarm) - More examples in the [`/health/health.d/ml.conf`](https://github.com/netdata/netdata/blob/master/health/health.d/ml.conf) file that ships with the agent. ## Learn More diff --git a/docs/guides/monitor/kubernetes-k8s-netdata.md b/docs/guides/monitor/kubernetes-k8s-netdata.md index 1d9ec2782a..cdf482ce11 100644 --- a/docs/guides/monitor/kubernetes-k8s-netdata.md +++ b/docs/guides/monitor/kubernetes-k8s-netdata.md @@ -140,7 +140,7 @@ visualizations](https://user-images.githubusercontent.com/1153921/109049195-349f ### Health map -The first visualization is the [health map](https://learn.netdata.cloud/docs/cloud/visualize/kubernetes#health-map), +The first visualization is the [health map](https://github.com/netdata/netdata/blob/master/docs/cloud/visualize/kubernetes.md#health-map), which places each container into its own box, then varies the intensity of their color to visualize the resource utilization. By default, the health map shows the **average CPU utilization as a percentage of the configured limit** for every container in your cluster. diff --git a/docs/guides/monitor/pi-hole-raspberry-pi.md b/docs/guides/monitor/pi-hole-raspberry-pi.md index 45af1eac94..4f0ff4cd6d 100644 --- a/docs/guides/monitor/pi-hole-raspberry-pi.md +++ b/docs/guides/monitor/pi-hole-raspberry-pi.md @@ -65,9 +65,7 @@ populates its dashboard with more than 250 charts. Open your browser of choice and navigate to `http://NODE:19999/`, replacing `NODE` with the IP address of your Raspberry Pi. Not sure what that IP is? Try running `hostname -I | awk '{print $1}'` from the Pi itself. -You'll see Netdata's dashboard and a few hundred real-time, -[interactive](https://learn.netdata.cloud/guides/step-by-step/step-02#interact-with-charts) charts. Feel free to -explore, but let's turn our attention to installing Pi-hole. +You'll see Netdata's dashboard and a few hundred real-time, interactive charts. Feel free to explore, but let's turn our attention to installing Pi-hole. ## Install Pi-Hole @@ -142,24 +140,3 @@ Use our [database sizing calculator](https://github.com/netdata/netdata/blob/master/docs/store/change-metrics-storage.md#calculate-the-system-resources-ram-disk-space-needed-to-store-metrics) and the [Database configuration documentation](https://github.com/netdata/netdata/blob/master/database/README.md) to help you determine the right setting for your Raspberry Pi. - -## What's next? - -Now that you're monitoring Pi-hole and your Raspberry Pi with Netdata, you can extend its capabilities even further, or -configure Netdata to more specific goals. - -Most importantly, you can always install additional services and instantly collect metrics from many of them with our -[300+ integrations](https://github.com/netdata/netdata/blob/master/collectors/COLLECTORS.md). - -- [Optimize performance](https://github.com/netdata/netdata/blob/master/docs/guides/configure/performance.md) using tweaks developed for IoT devices. -- [Stream Raspberry Pi metrics](https://github.com/netdata/netdata/blob/master/streaming/README.md) to a parent host for easy access or longer-term storage. -- [Tweak alarms](https://github.com/netdata/netdata/blob/master/health/REFERENCE.md) for either Pi-hole or the health of your Raspberry Pi. -- [Export metrics to external databases](https://github.com/netdata/netdata/blob/master/exporting/README.md) with the exporting engine. - -Or, head over to [our guides](https://learn.netdata.cloud/guides/) for even more experiments and insights into -troubleshooting the health of your systems and services. - -If you have any questions about using Netdata to monitor your Raspberry Pi, Pi-hole, or any other applications, head on -over to our [community forum](https://community.netdata.cloud/). - - diff --git a/docs/guides/troubleshoot/troubleshooting-agent-with-cloud-connection.md b/docs/guides/troubleshoot/troubleshooting-agent-with-cloud-connection.md index 472772a4c4..1e1a2bad84 100644 --- a/docs/guides/troubleshoot/troubleshooting-agent-with-cloud-connection.md +++ b/docs/guides/troubleshoot/troubleshooting-agent-with-cloud-connection.md @@ -65,7 +65,7 @@ Read more about [Starting, Stopping and Restarting the Agent](https://github.com ## Claiming on an older, deprecated version of the Agent -Make sure that you are using the latest version of Netdata if you are using the [Claiming script](https://learn.netdata.cloud/docs/agent/claim#claiming-script). +Make sure that you are using the latest version of Netdata if you are using the [Claiming script](https://github.com/netdata/netdata/blob/master/claim/README.md#claiming-script). With the introduction of our new architecture, Agents running versions lower than `v1.32.0` can face claiming problems, so we recommend you [update the Netdata Agent](https://github.com/netdata/netdata/blob/master/packaging/installer/UPDATE.md) to the latest stable version. diff --git a/docs/store/distributed-data-architecture.md b/docs/store/distributed-data-architecture.md index fffedd8ce8..bfd7803426 100644 --- a/docs/store/distributed-data-architecture.md +++ b/docs/store/distributed-data-architecture.md @@ -67,7 +67,7 @@ When you use the database engine to store your metrics, you can always perform a Netdata Cloud does not store metric values. To enable certain features, such as [viewing active alarms](https://github.com/netdata/netdata/blob/master/docs/monitor/view-active-alarms.md) -or [filtering by hostname/service](https://learn.netdata.cloud/docs/cloud/war-rooms#node-filter), Netdata Cloud does +or [filtering by hostname/service](https://github.com/netdata/netdata/blob/master/docs/cloud/war-rooms.md), Netdata Cloud does store configured alarms, their status, and a list of active collectors. Netdata does not and never will sell your personal data or data about your deployment. diff --git a/health/REFERENCE.md b/health/REFERENCE.md index 78cc7f78a5..795986e83d 100644 --- a/health/REFERENCE.md +++ b/health/REFERENCE.md @@ -17,12 +17,12 @@ files. You can configure the Agent's health watchdog service by editing files in two locations: -- The `[health]` section in `netdata.conf`. By editing the daemon's behavior, you can disable health monitoring - altogether, run health checks more or less often, and more. See - [daemon configuration](https://github.com/netdata/netdata/blob/master/daemon/config/README.md#health-section-options) for a table of +- The `[health]` section in `netdata.conf`. By editing the daemon's behavior, you can disable health monitoring + altogether, run health checks more or less often, and more. See + [daemon configuration](https://github.com/netdata/netdata/blob/master/daemon/config/README.md#health-section-options) for a table of all the available settings, their default values, and what they control. -- The individual `.conf` files in `health.d/`. These health entity files are organized by the type of metric they are +- The individual `.conf` files in `health.d/`. These health entity files are organized by the type of metric they are performing calculations on or their associated collector. You should edit these files using the `edit-config` script. For example: `sudo ./edit-config health.d/cpu.conf`. @@ -68,7 +68,7 @@ Save the file and [reload Netdata's health configuration](#reload-health-configu ## Disable or silence alerts Alerts and notifications can be disabled permanently via configuration changes, or temporarily, via the -[health management API](https://github.com/netdata/netdata/blob/master/web/api/health/README.md). The +[health management API](https://github.com/netdata/netdata/blob/master/web/api/health/README.md). The available options are described below. ### Disable all alerts @@ -77,11 +77,11 @@ In the `netdata.conf` `[health]` section, set `enabled` to `no`, and restart the ### Disable some alerts -In the `netdata.conf` `[health]` section, set `enabled alerms` to a +In the `netdata.conf` `[health]` section, set `enabled alerms` to a [simple pattern](https://github.com/netdata/netdata/edit/master/libnetdata/simple_pattern/README.md) that -excludes one or more alerts. e.g. `enabled alarms = !oom_kill *` will load all alarms except `oom_kill`. +excludes one or more alerts. e.g. `enabled alarms = !oom_kill *` will load all alarms except `oom_kill`. -You can also [edit the file where the alert is defined](#edit-individual-alerts), comment out its definition, +You can also [edit the file where the alert is defined](#edit-individual-alerts), comment out its definition, and [reload Netdata's health configuration](#reload-health-configuration). ### Silence an individual alert @@ -96,16 +96,16 @@ This action requires that you [reload Netdata's health configuration](#reload-he ### Temporarily disable alerts at runtime -When you need to frequently disable all or some alerts from triggering during certain times (for instance -when running backups) you can use the +When you need to frequently disable all or some alerts from triggering during certain times (for instance +when running backups) you can use the [health management API](https://github.com/netdata/netdata/blob/master/web/api/health/README.md). The API allows you to issue commands to control the health engine's behavior without changing configuration, or restarting the agent. ### Temporarily silence notifications at runtime -If you want health checks to keep running and alerts to keep getting triggered, but notifications to be -suppressed temporarily, you can use the +If you want health checks to keep running and alerts to keep getting triggered, but notifications to be +suppressed temporarily, you can use the [health management API](https://github.com/netdata/netdata/blob/master/web/api/health/README.md). The API allows you to issue commands to control the health engine's behavior without changing configuration, or restarting the agent. @@ -144,36 +144,36 @@ lookup: average -1m percentage of used Let's look into each of the lines to see how they create a working health entity. -- `alarm`: The name for your new entity. The name needs to follow these requirements: - - Any alphabet letter or number. - - The symbols `.` and `_`. - - Cannot be `chart name`, `dimension name`, `family name`, or `chart variable names`. +- `alarm`: The name for your new entity. The name needs to follow these requirements: + - Any alphabet letter or number. + - The symbols `.` and `_`. + - Cannot be `chart name`, `dimension name`, `family name`, or `chart variable names`. -- `on`: Which chart the entity listens to. +- `on`: Which chart the entity listens to. -- `lookup`: Which metrics the alarm monitors, the duration of time to monitor, and how to process the metrics into a +- `lookup`: Which metrics the alarm monitors, the duration of time to monitor, and how to process the metrics into a usable format. - - `average`: Calculate the average of all the metrics collected. - - `-1m`: Use metrics from 1 minute ago until now to calculate that average. - - `percentage`: Clarify that we're calculating a percentage of RAM usage. - - `of used`: Specify which dimension (`used`) on the `system.ram` chart you want to monitor with this entity. + - `average`: Calculate the average of all the metrics collected. + - `-1m`: Use metrics from 1 minute ago until now to calculate that average. + - `percentage`: Clarify that we're calculating a percentage of RAM usage. + - `of used`: Specify which dimension (`used`) on the `system.ram` chart you want to monitor with this entity. -- `units`: Use percentages rather than absolute units. +- `units`: Use percentages rather than absolute units. -- `every`: How often to perform the `lookup` calculation to decide whether or not to trigger this alarm. +- `every`: How often to perform the `lookup` calculation to decide whether or not to trigger this alarm. -- `warn`/`crit`: The value at which Netdata should trigger a warning or critical alarm. This example uses simple +- `warn`/`crit`: The value at which Netdata should trigger a warning or critical alarm. This example uses simple syntax, but most pre-configured health entities use [hysteresis](#special-use-of-the-conditional-operator) to avoid superfluous notifications. -- `info`: A description of the alarm, which will appear in the dashboard and notifications. +- `info`: A description of the alarm, which will appear in the dashboard and notifications. -In human-readable format: +In human-readable format: > This health entity, named **ram_usage**, watches the **system.ram** chart. It looks up the last **1 minute** of > metrics from the **used** dimension and calculates the **average** of all those metrics in a **percentage** format, -> using a **% unit**. The entity performs this lookup **every minute**. -> +> using a **% unit**. The entity performs this lookup **every minute**. +> > If the average RAM usage percentage over the last 1 minute is **more than 80%**, the entity triggers a warning alarm. > If the usage is **more than 90%**, the entity triggers a critical alarm. @@ -207,14 +207,14 @@ to the same chart, Netdata will use the alarm. Netdata parses the following lines. Beneath the table is an in-depth explanation of each line's purpose and syntax. -- The `alarm` or `template` line must be the first line of any entity. -- The `on` line is **always required**. -- The `every` line is **required** if not using `lookup`. -- Each entity **must** have at least one of the following lines: `lookup`, `calc`, `warn`, or `crit`. -- A few lines use space-separated lists to define how the entity behaves. You can use `*` as a wildcard or prefix with +- The `alarm` or `template` line must be the first line of any entity. +- The `on` line is **always required**. +- The `every` line is **required** if not using `lookup`. +- Each entity **must** have at least one of the following lines: `lookup`, `calc`, `warn`, or `crit`. +- A few lines use space-separated lists to define how the entity behaves. You can use `*` as a wildcard or prefix with `!` for a negative match. Order is important, too! See our [simple patterns docs](https://github.com/netdata/netdata/blob/master/libnetdata/simple_pattern/README.md) for more examples. -- Lines terminated by a `\` are spliced together with the next line. The backslash is removed and the following line is +- Lines terminated by a `\` are spliced together with the next line. The backslash is removed and the following line is joined with the current one. No space is inserted, so you may split a line anywhere, even in the middle of a word. This comes in handy if your `info` line consists of several sentences. @@ -262,7 +262,7 @@ alarm: NAME template: NAME ``` -`NAME` can be any alpha character, with `.` (period) and `_` (underscore) as the only allowed symbols, but the names +`NAME` can be any alpha character, with `.` (period) and `_` (underscore) as the only allowed symbols, but the names cannot be `chart name`, `dimension name`, `family name`, or `chart variables names`. #### Alarm line `on` @@ -294,7 +294,7 @@ shows a disk I/O chart, the tooltip reads: `proc:/proc/diskstats, disk.io`. 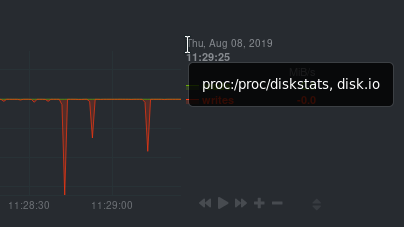 -You're interested in what comes after the comma: `disk.io`. That's the name of the chart's context. +You're interested in what comes after the comma: `disk.io`. That's the name of the chart's context. If you create a template using the `disk.io` context, it will apply an alarm to every disk available on your system. @@ -316,7 +316,6 @@ class: Latency | Utilization | | Workload | - </details> `class` will default to `Unknown` if the line is missing from the alarm configuration. @@ -328,6 +327,7 @@ Type can be used to indicate the broader area of the system that the alarm appli ```yaml type: Database ``` + <details> <summary>Netdata's stock alarms use the following `type` attributes by default, but feel free to adjust for your own requirements.</summary> @@ -368,6 +368,7 @@ Component can be used to narrow down what the previous `type` value specifies fo ```yaml component: MySQL ``` + As with the `class` and `type` line, if `component` is missing from the configuration, its value will default to `Unknown`. #### Alarm line `os` @@ -420,7 +421,7 @@ module: isc_dhcpd #### Alarm line `charts` -The `charts` line filters which chart this alarm should apply to. It is only available on entities using the +The `charts` line filters which chart this alarm should apply to. It is only available on entities using the [`template`](#alarm-line-alarm-or-template) line. The value is a space-separated list of [simple patterns](https://github.com/netdata/netdata/blob/master/libnetdata/simple_pattern/README.md). For example, a template that applies to `disk.svctm` (Average Service Time) context, but excludes the disk `sdb` from alarms: @@ -457,33 +458,33 @@ lookup: METHOD AFTER [at BEFORE] [every DURATION] [OPTIONS] [of DIMENSIONS] [for Everything is the same with [badges](https://github.com/netdata/netdata/blob/master/web/api/badges/README.md). In short: -- `METHOD` is one of `average`, `min`, `max`, `sum`, `incremental-sum`. +- `METHOD` is one of `average`, `min`, `max`, `sum`, `incremental-sum`. This is required. -- `AFTER` is a relative number of seconds, but it also accepts a single letter for changing +- `AFTER` is a relative number of seconds, but it also accepts a single letter for changing the units, like `-1s` = 1 second in the past, `-1m` = 1 minute in the past, `-1h` = 1 hour in the past, `-1d` = 1 day in the past. You need a negative number (i.e. how far in the past to look for the value). **This is required**. </ |