
diff options
| author | Chris Akritidis <43294513+cakrit@users.noreply.github.com> | 2018-11-12 21:34:59 +0100 |
|---|---|---|
| committer | Costa Tsaousis <costa@tsaousis.gr> | 2018-11-12 22:34:59 +0200 |
| commit | 3aae8f6c2ceea7f74cde61a2044aa50c5f252fae (patch) | |
| tree | 781412f323c0183c520e4ff1c9fdac53a900b463 /web | |
| parent | a29b433526f56fe983d88dc4e86585bad65916c4 (diff) | |
Htmldoc (#4607)
* First html documentation debug set
* Test 2
* Relative path changed
* Updated comments
* Cleanup, installation draft added
* fixes
* test
* test
* test
* First html documentation debug set
* Test 2
* Relative path changed
* Updated comments
* Cleanup, installation draft added
* fixes
* test
* test
* test
* First set of major cleanup/deduplication
* 2nd major cleanup
* update getting started structure
* Cleanup in using netdata
* Final cleanup/deduplication
* Added initial CONTRIBUTING.md, updated some info related to contributing on the orchestrators
* Removed Why-Netdata (included in new README in master), added link to CONTRIBUTING.md
* First html documentation debug set
* Updated Makefile.am to ignore the new md and htmldoc generation files
* Removing files from rebase
* First html documentation debug set
* Test 2
* Relative path changed
* Updated comments
* Cleanup, installation draft added
* fixes
* test
* test
* test
* First html documentation debug set
* Test 2
* Relative path changed
* Updated comments
* Cleanup, installation draft added
* test
* test
* First set of major cleanup/deduplication
* 2nd major cleanup
* update getting started structure
* Cleanup in using netdata
* Final cleanup/deduplication
* Added initial CONTRIBUTING.md, updated some info related to contributing on the orchestrators
* Removed Why-Netdata (included in new README in master), added link to CONTRIBUTING.md
* First html documentation debug set
* Updated Makefile.am to ignore the new md and htmldoc generation files
* Removing files from rebase
* Fixed Makefile.am
* Same line header and badges
* Fixed broken link
* CPU monitoring is in apps plugin
* Removed obsolete files
* Remove obsolete files
* - Make the Health API part of health/README.md new file web/api/health/README.md
- Make installer/LAUNCH.md part of deamon/README.md
- Move installer/MAINTAINERS.md to packaging/maintainers/README.md
- Move installer/DOCKER.md to docker/README.md
- Move system/README.md to daemon/config/README.md
- Move web/CUSTOM-DASHBOARDS.md to web/gui/custom/README.md
- Move web/CONFLUENCE-DASHBOARDS.md to web/gui/confluence/README.md
* Resolve codacy issue $(..) syntax instead of `..`
* Fix following warnings and add svgs to the data_structures/README.md
- CHANGELOG.md
- CODE_OF_CONDUCT.md
- CONTRIBUTORS.md
- REDISTRIBUTED.md
- diagrams/data_structures/README.md
- docker/README.md
WARNING - Documentation file 'README.md' contains a link to 'collectors/plugins.d' which does not exist in the documentation directory.
WARNING - Documentation file 'README.md' contains a link to 'collectors/statsd.plugin' which does not exist in the documentation directory.
WARNING - Documentation file 'CONTRIBUTING.md' contains a link to 'web/CUSTOM-DASHBOARDS.md' which does not exist in the documentation directory.
WARNING - Documentation file 'CONTRIBUTING.md' contains a link to 'web/CONFLUENCE-DASHBOARDS.md' which does not exist in the documentation directory.
* Wrong urls in data_structures/README.md svgs
* Fix svg URLs number 2
* Modify the first line of the main README.md, to enable proper static html generation. Executed after copying the file to htmldoc/src
* Added back Why Netdata
* Fixed link to registry in Why-Netdata.md
* Added Why-Netdata to buildyaml and to Makefile.am
* Replaced http links causing mixed content warnings
* Made buildhtml ignore the directory node_modules created by Netlify
* Corrected CONTRIBUTING.MD to CONTRIBUTING.md
Diffstat (limited to 'web')
| -rw-r--r-- | web/Makefile.am | 2 | ||||
| -rw-r--r-- | web/README.md | 26 | ||||
| -rw-r--r-- | web/api/badges/README.md | 28 | ||||
| -rw-r--r-- | web/api/exporters/README.md | 3 | ||||
| -rw-r--r-- | web/api/health/README.md | 43 | ||||
| -rw-r--r-- | web/gui/README.md | 16 | ||||
| -rw-r--r-- | web/gui/confluence/README.md | 1012 | ||||
| -rw-r--r-- | web/gui/custom/README.md | 412 | ||||
| -rw-r--r-- | web/server/README.md | 4 |
9 files changed, 1530 insertions, 16 deletions
diff --git a/web/Makefile.am b/web/Makefile.am index 1ec8d586d4..c4e5fd50a6 100644 --- a/web/Makefile.am +++ b/web/Makefile.am @@ -11,4 +11,6 @@ SUBDIRS = \ dist_noinst_DATA = \ README.md \ + gui/confluence/README.md \ + gui/custom/README.md \ $(NULL) diff --git a/web/README.md b/web/README.md index e69de29bb2..2d93428ee8 100644 --- a/web/README.md +++ b/web/README.md @@ -0,0 +1,26 @@ +# Web Dashboards Overview + +The default port is 19999; for example, to access the dashboard on localhost, use: http://localhost:19999 + +To view netdata collected data you access its **[REST API v1](api/)**. + +For our convenience, netdata provides 2 more layers: + +1. The `dashboard.js` javascript library that allows us to design custom dashboards using plain HTML. For information on creating custom dashboards, see **[Custom Dashboards](gui/custom/)** and **[Atlassian Confluence Dashboards](gui/confluence/)** + +2. Ready to be used web dashboards that render all the charts a netdata server maintains. + +## customizing the standard dashboards + +Charts information is stored at /usr/share/netdata/web/[dashboard_info.js](https://github.com/netdata/netdata/blob/master/web/dashboard_info.js). This file includes information that is rendered on the dashboard, controls chart colors, section and subsection heading, titles, etc. + +If you change that file, your changes will be overwritten when netdata is updated. You can preserve your settings by creating a new such file (there is /usr/share/netdata/web/[dashboard_info_custom.example.js](https://github.com/netdata/netdata/blob/master/web/dashboard_info_custom_example.js) you can use to start with). + +You have to copy the example file under a new name, so that it will not be overwritten with netdata updates. + +To configure your info file set in netdata.conf: + +``` +[web] + custom dashboard_info.js = your_file_name.js +``` diff --git a/web/api/badges/README.md b/web/api/badges/README.md index cf0b22beac..2d85271907 100644 --- a/web/api/badges/README.md +++ b/web/api/badges/README.md @@ -56,14 +56,14 @@ Here is what you can put for `options` (these are standard netdata API options): ```html <a href="#"> - <img src="http://registry.my-netdata.io/api/v1/badge.svg?chart=system.cpu"></img> + <img src="https://registry.my-netdata.io/api/v1/badge.svg?chart=system.cpu"></img> </a> ``` Which produces this: <a href="#"> - <img src="http://registry.my-netdata.io/api/v1/badge.svg?chart=system.cpu"></img> + <img src="https://registry.my-netdata.io/api/v1/badge.svg?chart=system.cpu"></img> </a> - `alarm=NAME` @@ -84,14 +84,14 @@ Here is what you can put for `options` (these are standard netdata API options): ```html <a href="#"> - <img src="http://registry.my-netdata.io/api/v1/badge.svg?chart=system.cpu&dimensions=system%7Cnice"></img> + <img src="https://registry.my-netdata.io/api/v1/badge.svg?chart=system.cpu&dimensions=system%7Cnice"></img> </a> ``` Which produces this: <a href="#"> - <img src="http://registry.my-netdata.io/api/v1/badge.svg?chart=system.cpu&dimensions=system%7Cnice"></img> + <img src="https://registry.my-netdata.io/api/v1/badge.svg?chart=system.cpu&dimensions=system%7Cnice"></img> </a> - `before=SECONDS` and `after=SECONDS` @@ -106,28 +106,28 @@ Here is what you can put for `options` (these are standard netdata API options): ```html <a href="#"> - <img src="http://registry.my-netdata.io/api/v1/badge.svg?chart=system.cpu&after=-60"></img> + <img src="https://registry.my-netdata.io/api/v1/badge.svg?chart=system.cpu&after=-60"></img> </a> ``` Which produces the average of last complete minute (XX:XX:00 - XX:XX:59): <a href="#"> - <img src="http://registry.my-netdata.io/api/v1/badge.svg?chart=system.cpu&after=-60"></img> + <img src="https://registry.my-netdata.io/api/v1/badge.svg?chart=system.cpu&after=-60"></img> </a> While this is the previous minute (one minute before the last one, again aligned XX:XX:00 - XX:XX:59): ```html <a href="#"> - <img src="http://registry.my-netdata.io/api/v1/badge.svg?chart=system.cpu&before=-60&after=-60"></img> + <img src="https://registry.my-netdata.io/api/v1/badge.svg?chart=system.cpu&before=-60&after=-60"></img> </a> ``` It produces this: <a href="#"> - <img src="http://registry.my-netdata.io/api/v1/badge.svg?chart=system.cpu&before=-60&after=-60"></img> + <img src="https://registry.my-netdata.io/api/v1/badge.svg?chart=system.cpu&before=-60&after=-60"></img> </a> - `group=min` or `group=max` or `group=average` (the default) or `group=sum` or `group=incremental-sum` @@ -208,11 +208,11 @@ These are options dedicated to badges: This option scales the svg image. It accepts values above or equal to 100 (100% is the default scale). For example, lets get a few different sizes: - <img src="http://registry.my-netdata.io/api/v1/badge.svg?chart=system.cpu&after=-60&scale=100"></img> original<br/> - <img src="http://registry.my-netdata.io/api/v1/badge.svg?chart=system.cpu&after=-60&scale=125"></img> `scale=125`<br/> - <img src="http://registry.my-netdata.io/api/v1/badge.svg?chart=system.cpu&after=-60&scale=150"></img> `scale=150`<br/> - <img src="http://registry.my-netdata.io/api/v1/badge.svg?chart=system.cpu&after=-60&scale=175"></img> `scale=175`<br/> - <img src="http://registry.my-netdata.io/api/v1/badge.svg?chart=system.cpu&after=-60&scale=200"></img> `scale=200` + <img src="https://registry.my-netdata.io/api/v1/badge.svg?chart=system.cpu&after=-60&scale=100"></img> original<br/> + <img src="https://registry.my-netdata.io/api/v1/badge.svg?chart=system.cpu&after=-60&scale=125"></img> `scale=125`<br/> + <img src="https://registry.my-netdata.io/api/v1/badge.svg?chart=system.cpu&after=-60&scale=150"></img> `scale=150`<br/> + <img src="https://registry.my-netdata.io/api/v1/badge.svg?chart=system.cpu&after=-60&scale=175"></img> `scale=175`<br/> + <img src="https://registry.my-netdata.io/api/v1/badge.svg?chart=system.cpu&after=-60&scale=200"></img> `scale=200` - `refresh=auto` or `refresh=SECONDS` @@ -321,4 +321,4 @@ You can refresh them from your browser console though. Press F12 to open the web ```js var len = document.images.length; while(len--) { document.images[len].src = document.images[len].src.replace(/\?cacheBuster=\d*/, "") + "?cacheBuster=" + new Date().getTime().toString(); }; -```
\ No newline at end of file +``` diff --git a/web/api/exporters/README.md b/web/api/exporters/README.md index e69de29bb2..02e04abbf7 100644 --- a/web/api/exporters/README.md +++ b/web/api/exporters/README.md @@ -0,0 +1,3 @@ +# Exporters + +TBD diff --git a/web/api/health/README.md b/web/api/health/README.md new file mode 100644 index 0000000000..9bab960b1d --- /dev/null +++ b/web/api/health/README.md @@ -0,0 +1,43 @@ +# Health API Calls + +## Enabled Alarms + +NetData enables alarms on demand, i.e. when the chart they should be linked to starts collecting data. So, although many more alarms are configured, only the useful ones are enabled. + +To get the list of all enabled alarms: + +`http://your.netdata.ip:19999/api/v1/alarms?all` + +## Raised Alarms + +This API call will return the alarms currently in WARNING or CRITICAL state. + +`http://your.netdata.ip:19999/api/v1/alarms` + +## Event Log + +The size of the alarm log is configured in `netdata.conf`. There are 2 settings: the rotation of the alarm log file and the in memory size of the alarm log. + +``` +[health] + health db file = /var/lib/netdata/health/health-log.db + in memory max health log entries = 1000 + rotate log every lines = 2000 +``` + +The API call retrieves all entries of the alarm log: + +`http://your.netdata.ip:19999/api/v1/alarm_log` + +## Alarm Log Incremental Updates + +`http://your.netdata.ip:19999/api/v1/alarm_log?after=UNIQUEID` + +The above returns all the events in the alarm log that occurred after UNIQUEID (you poll it once without `after=`, remember the last UNIQUEID of the returned set, which you give back to get incrementally the next events). + +## Alarm badges + +The following will return an SVG badge of the alarm named `NAME`, attached to the chart named `CHART`. + +`http://your.netdata.ip:19999/api/v1/badge.svg?alarm=NAME&chart=CHART` + diff --git a/web/gui/README.md b/web/gui/README.md index 97ba5ceca4..1fce758997 100644 --- a/web/gui/README.md +++ b/web/gui/README.md @@ -10,3 +10,19 @@ make ``` After every change in the `src` directory, the `dashboard.js` file should be regenerated and commited to the repository. + +## Custom Dashboards + +For information on creating custom dashboards, see **[Custom Dashboards](custom/)** and **[Atlassian Confluence Dashboards](confluence/)** + +## Supported chart libraries + +- Dygraph +- jQuery Sparkline +- Peity +- Google Charts +- Morris +- EasyPieChart +- Gauge.js +- D3 +- C3 diff --git a/web/gui/confluence/README.md b/web/gui/confluence/README.md new file mode 100644 index 0000000000..c75e663f3b --- /dev/null +++ b/web/gui/confluence/README.md @@ -0,0 +1,1012 @@ +# Atlassian Confluence Dashboards + +With netdata you can build **live, interactive, monitoring dashboards** directly on Atlassian's **Confluence** pages. + +I see you already asking "why should I do this?" + +Well... think a bit of it.... confluence is the perfect place for something like that: + +1. All the employees of your company already have access to it. + +2. Most probably you have already several spaces on confluence, one for each project or service. Adding live monitoring information there is ideal: everything in one place. Your users will just click on the page and instantly the monitoring page they need will appear with only the information they need to know. + +3. You can create monitoring pages for very specific purposes, hiding all the information that is too detailed for most users, or explaining in detail things that are difficult for them to understand. + +So, what can we expect? What can netdata do on confluence? + +You will be surprised! **Everything a netdata dashboard does!**. Example: + + + +Let me show you how. + +> Let's assume we have 2 web servers we want to monitor. We will create a simple dashboard with key information about them, directly on confluence. + +### Before you begin + +Most likely your confluence is accessible via HTTPS. So, you need to proxy your netdata servers via an apache or nginx to make them HTTPS too. If your Confluence is HTTPS but your netdata are not, you will not be able to fetch the netdata content from the confluence page. The netdata wiki has many examples for proxying netdata through another web server. + +> So, make sure netdata and confluence can be accessed with the same protocol (**http**, or **https**). + +For our example, I will use these 2 servers: + +server|url +----|---- +Server 1 | https://london.my-netdata.io +Server 2 | https://frankfurt.my-netdata.io + +I will use the first server for the static dashboard javascript files. + +--- + +Then, you need to enable the `html` plugin of confluence. We will add some plain html content on that page, and this plugin is required. + +### Create a new page + +Create a new confluence page and paste this into an `html` box: + +```html +<script> +// don't load bootstrap - confluence does not need this +var netdataNoBootstrap = true; + +// select the web notifications to show on this dashboard +// var netdataShowAlarms = true; +// var netdataAlarmsRecipients = [ 'sysadmin', 'webmaster' ]; +</script> + +<script src="https://london.my-netdata.io/dashboard.js"></script> +``` + +like this (type `{html` for the html box to appear - you need the confluence html plugin enabled): + + + +### Add a few badges + +Then, go to your netdata and copy an alarm badge (the `<embed>` version of it): + + + +Then add another HTML box on the page, and paste it, like this: + + + +Hit **update** and you will get this: + + + +This badge is now auto-refreshing. It will update itself based on the update frequency of the alarm. + +> Keep in mind you can add badges with custom netdata queries too. netdata automatically creates badges for all the alarms, but every chart, every dimension on every chart, can be used for a badge. And netdata badges are quite powerful! Check [Creating Badges](https://github.com/netdata/netdata/wiki/Generating-Badges) for more information on badges. + +So, let's create a table and add this badge for both our web servers: + + + +Now we get this: + +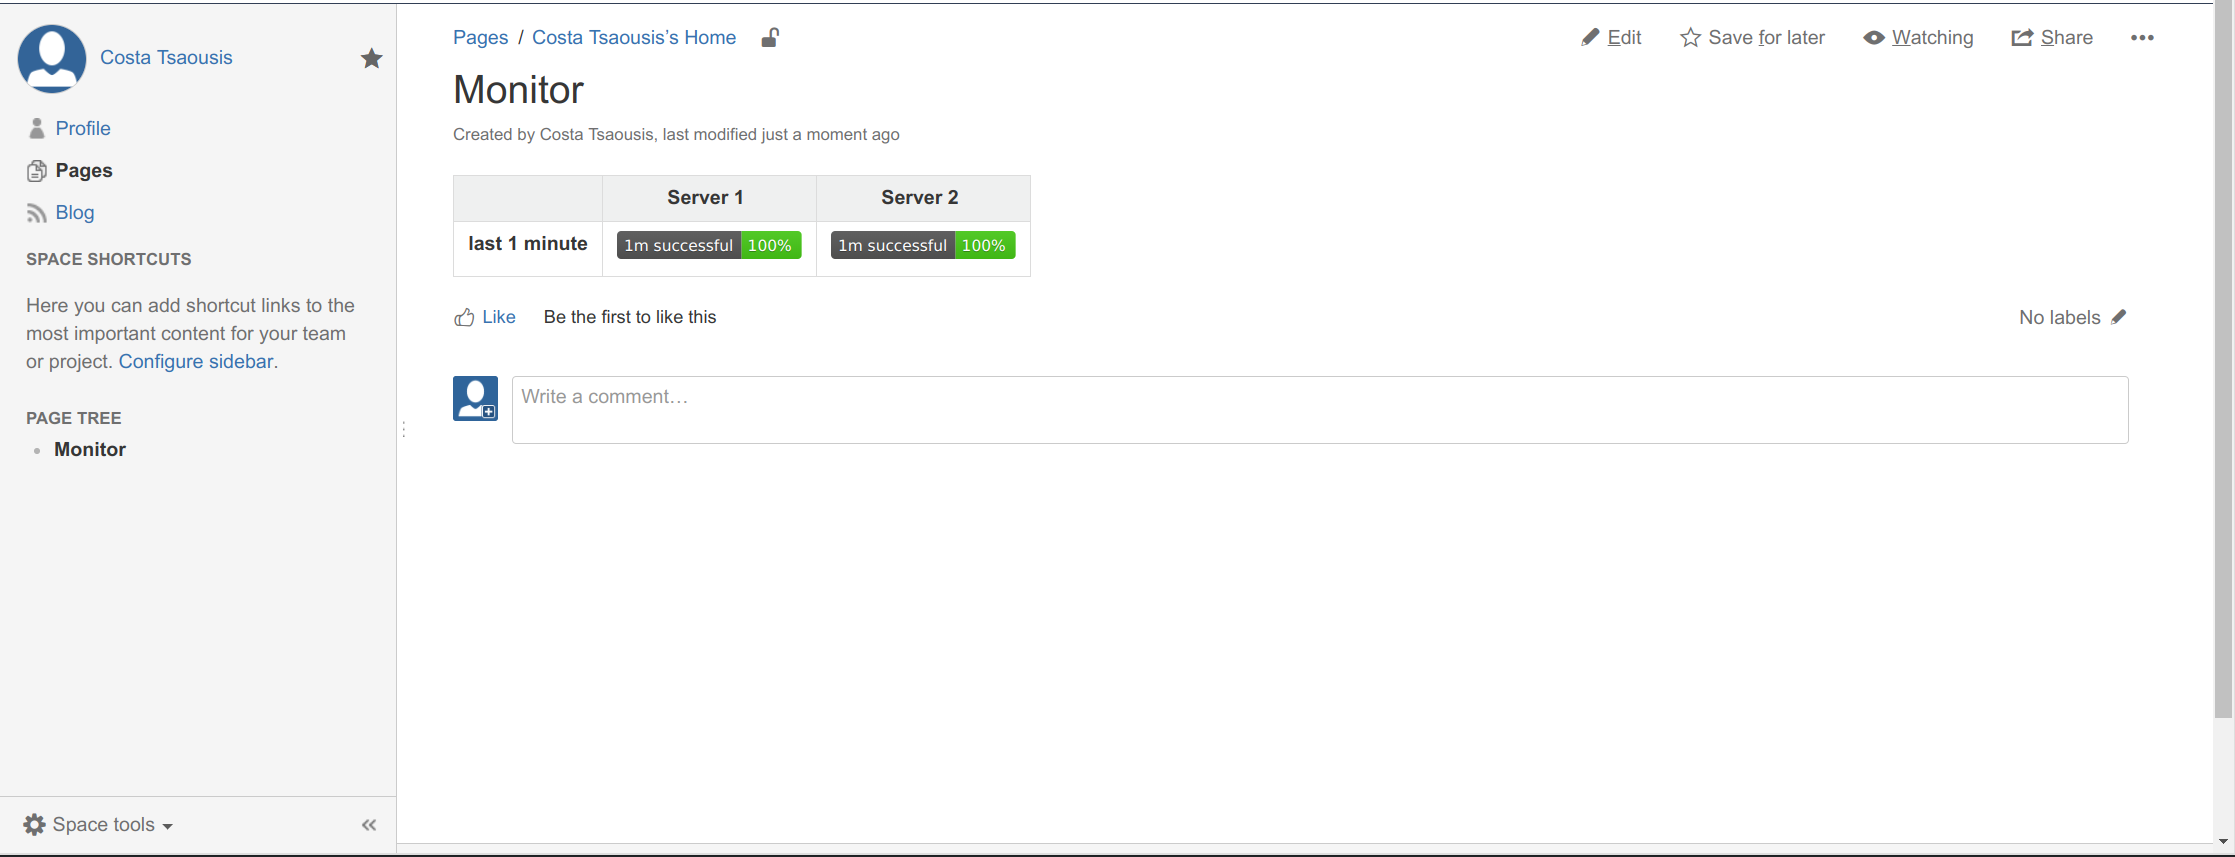 + +### Add a netdata chart + +The simplest form of a chart is this (it adds the chart `web_log_nginx_netdata.response_statuses`, using 100% of the width, 150px height, and the last 10 minutes of data): + +```html +<div + data-netdata="web_log_nginx_netdata.response_statuses" + data-width="100%" + data-height="150px" + data-before="0" + data-after="-600" +></div> +``` + +Add this to `html` block on confluence: + + + +And you will get this: + +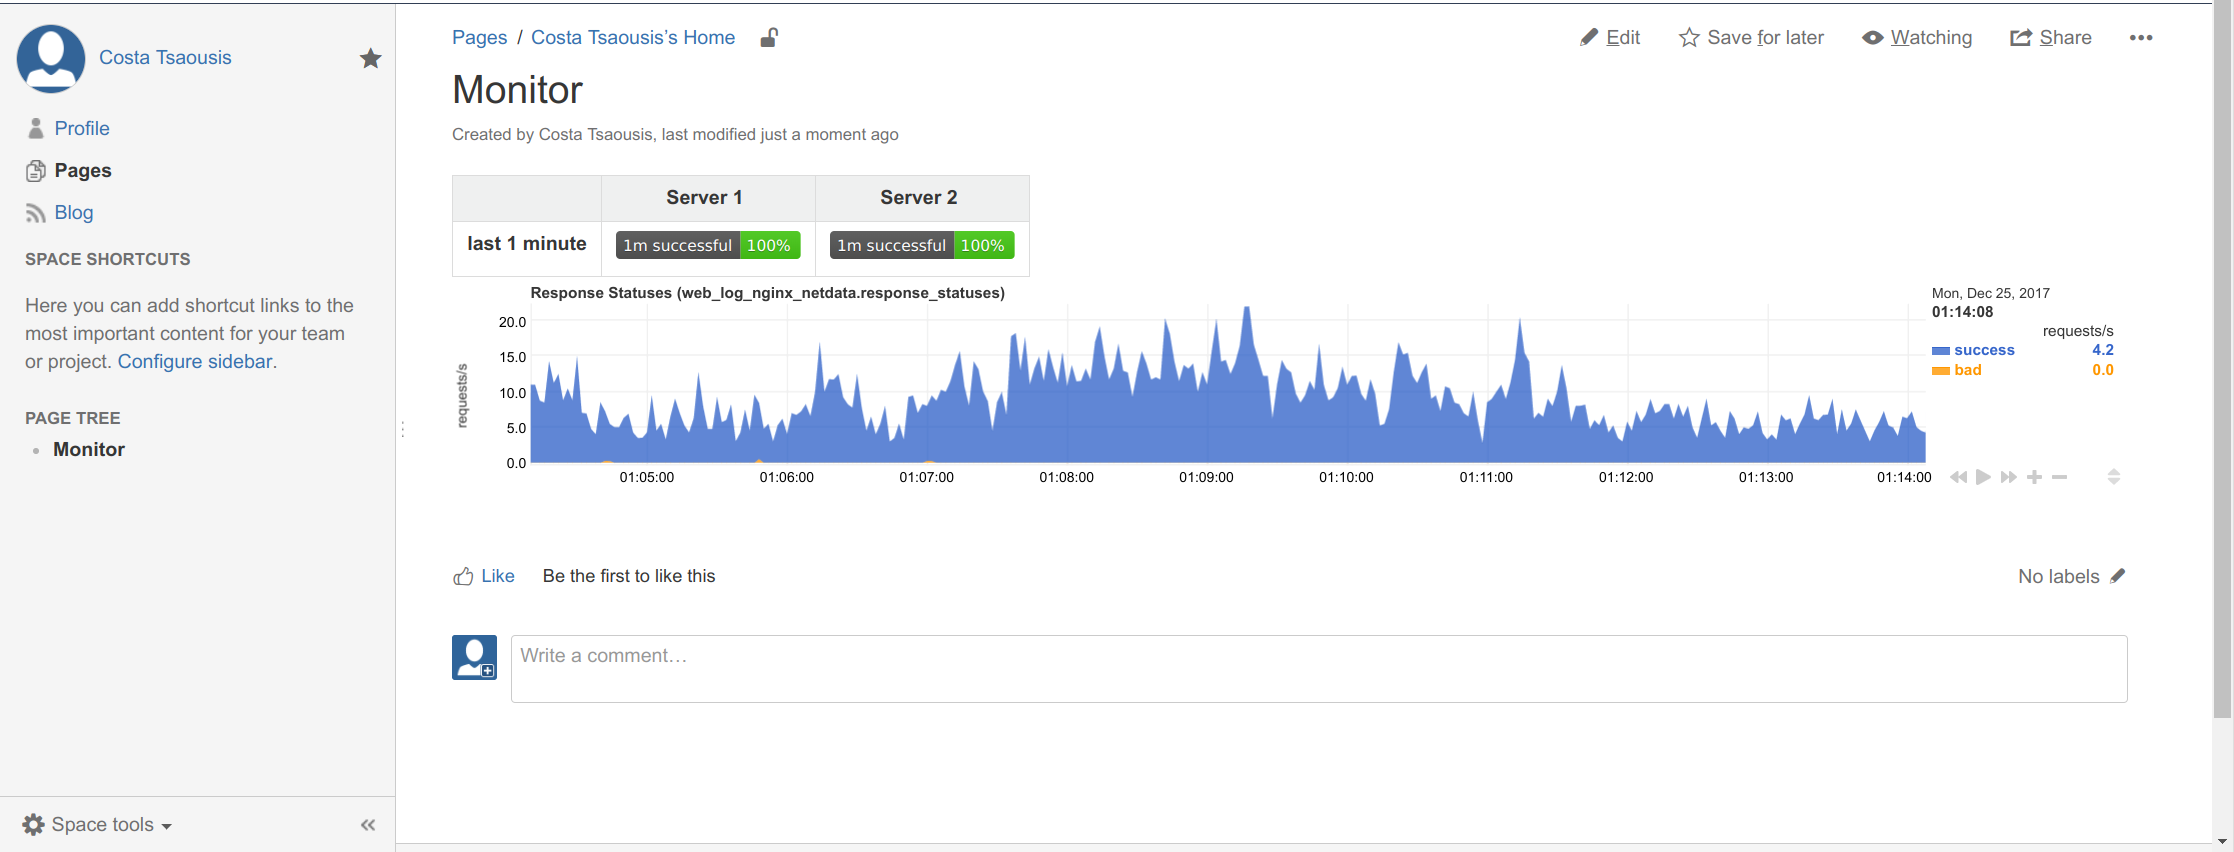 + +> This chart is **alive**, fully interactive. You can drag it, pan it, zoom it, etc like you do on netdata dashboards! + +Of course this too big. We need something smaller to add inside the table. Let's try this: + +```html +<div + data-netdata="web_log_nginx_netdata.response_statuses" + data-legend="false" + data-dygraph-yaxislabelwidth="35" + data-dygraph-ypixelsperlabel="8" + data-after="-600" + data-before="0" + data-title="" + data-height="100px" + data-width="300px" +></div> +``` + +The chart name is shown on all netdata charts, so just copy it from a netdata dashboard. + +We will fetch the same chart from both servers. To define the server we also added `data-host=` with the URL of each server, like this (we also added `<br/>` for a newline between the badge and the chart): + + + +Which gives us this: + +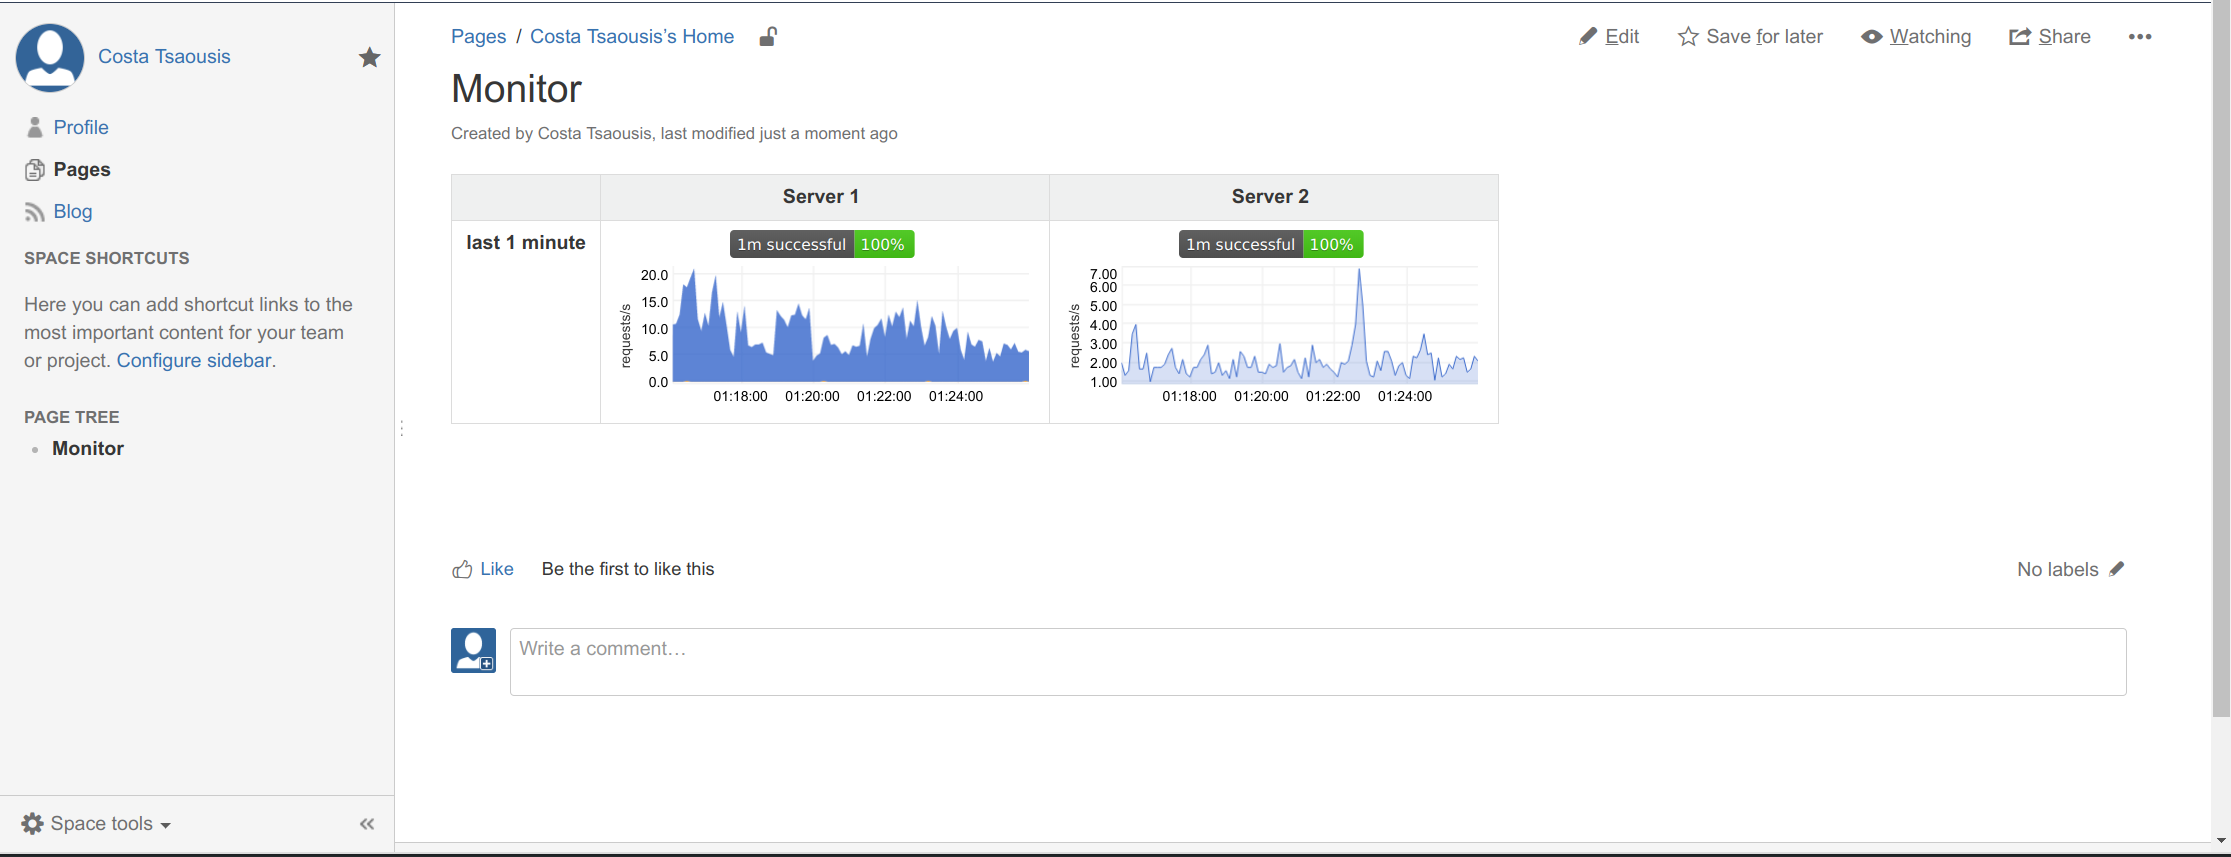 + +Note the color difference. This is because netdata automatically hides dimensions that are just zero (the frankfurt server has only successful requests). To instruct netdata to disable this feature, we need to add another html fragment at the bottom of the page (make sure this is added after loading `dashboard.js`). So we edit the first block we added, and append a new `<script>` section to it: + + +```html +<script> +// don't load bootstrap - confluence does not need this +var netdataNoBootstrap = true; + +// select the web notifications to show on this dashboard +// var netdataShowAlarms = true; +// var netdataAlarmsRecipients = [ 'sysadmin', 'webmaster' ]; +</script> + +<script src="https://london.my-netdata.io/dashboard.js"></script> + +<script> +// do not hide dimensions with just zeros +NETDATA.options.current.eliminate_zero_dimensions = false; +</script> +``` + +Now they match: + + + +#### more options + +If you want to change the colors append `data-colors="#001122 #334455 #667788"`. The colors will be used for the dimensions top to bottom, as shown on a netdata dashboard. Keep in mind the default netdata dashboards hide by default all dimensions that are just zero, so enable them at the dashboard settings to see them all. + +You can get a percentage chart, by adding these on these charts: + +```html + data-append-options="percentage" + data-decimal-digits="0" + data-dygraph-valuerange="[0, 100]" + data-dygraph-includezero="true" + data-units="%" +``` + +The first line instructs netdata to calculate the percentage of each dimension, the second strips any fractional digits, the third instructs the charting library to size the chart from 0 to 100, the next one instructs it to include 0 in the chart and the last changes the units of the chart to `%`. This is how it will look: + +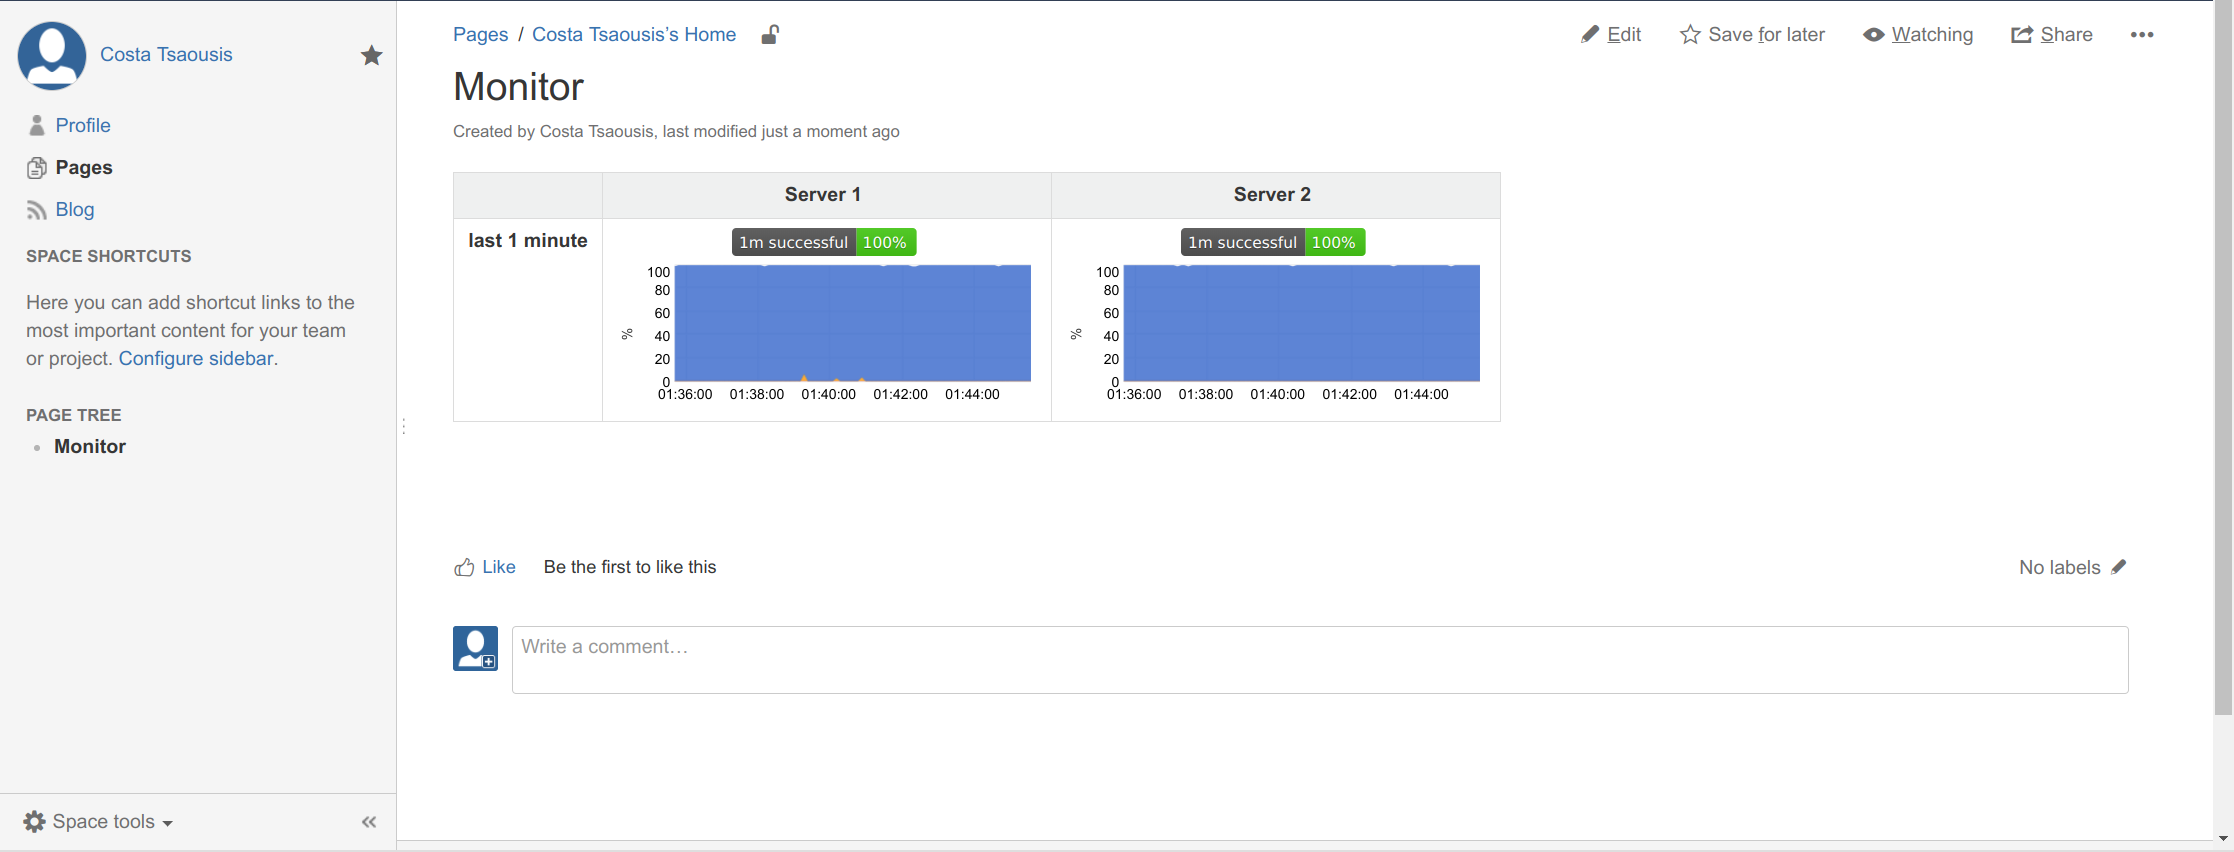 + +You can make any number of charts have common min and max on the y-range by adding `common-min="NAME"` and `common-max="NAME"`, where `NAME` is anything you like. Keep in mind for best results all the charts with the same `NAME` should be visible at once, otherwise a not-visible chart will influence the range and until it is updated the range will not adapt. + +### Add gauges + +Let's now add a few gauges. The chart we added has several dimensions: `success`, `error`, `redirect`, `bad` and `other`. + +Let's say we want to add 2 gauges: + +1. `success` and `redirect` together, in blue +2. `error`, `bad` and `other` together, in orange + +We will add the following for each server. We have enclosed them in another a `<div>` because Confluence will wrap them if the page width is not enough to fit them. With that additional `<div>` they will always be next to each other. + +```html +<div style="width: 300px; text-align: center;"> +<div + data-netdata="web_log_nginx_netdata.response_statuses" + data-host="https://london.my-netdata.io" + data-dimensions="success,redirect" + data-chart-library="gauge" + data-title="Good" + data-units="requests/s" + data-gauge-adjust="width" + data-width="120" + data-before="0" + data-after="-600" + data-points="600" + data-common-max="response_statuses" + data-colors="#007ec6" + data-decimal-digits="0" + ></div><div + data-netdata="web_log_nginx_netdata.response_statuses" + data-host="https://london.my-netdata.io" + data-dimensions="error,bad,other" + data-chart-library="gauge" + data-title="Bad" + data-units="requests/s" + data-gauge-adjust="width" + data-width="120" + data-before="0" + data-after="-600" + data-points="600" + data-common-max="response_statuses" + data-colors="#97CA00" + data-decimal-digits="0" + ></div> +</div> +``` + +Adding the above will give you this: + + + + +### Final source - for the confluence source editor + +If you enable the source editor of Confluence, you can paste the whole example (implementing the first image on this post and demonstrating everything discussed on this page): + +```html +<p class="auto-cursor-target">Monitoring the health of the web servers, by analyzing the response codes they send.</p> +<table> + <colgroup> + <col/> + <col/> + <col/> + <col/> + <col/> + </colgroup> + <tbody> + <tr> + <th style="text-align: center;"> + <br/> + </th> + <th style="text-align: center;">London</th> + <th style="text-align: center;">Frankfurt</th> + <th colspan="1" style="text-align: center;">San Francisco</th> + <th colspan="1" style="text-align: center;">Toronto</th> + </tr> + <tr> + <td colspan="1" style="text-align: right;"> + <strong>last hour</strong> + <br/> + <strong>requests</strong> + </td> + <td colspan="1" style="text-align: center;"> + <div class="content-wrapper"> + <p class="auto-cursor-target"> + <br/> + </p> + <ac:structured-macro ac:macro-id="5771a1db-b461-478f-a820-edcb67809eb1" ac:name="html" ac:schema-version="1"> + <ac:plain-text-body><![CDATA[<div + data-netdata="web_log_nginx_netdata.response_statuses" + data-host="https://london.my-netdata.io" + data-chart-library="easypiechart" + data-after="-14400" + data-before="0" + data-points="4" + data-title="london" + data-method="sum" + data-append-options="unaligned" + data-update-every="60" + data-width="120px" + data-common-max="1h_requests_pie" + data-decimal-digits="0" +></div>]]></ac:plain-text-body> + </ac:structured-macro> + <p class="auto-cursor-target"> + <br/> + </p> + </div> + </td> + <td colspan="1" style="text-align: center;"> + <div class="content-wrapper"> + <p class="auto-cursor-target"> + <br/> + </p> + <ac:structured-macro ac:macro-id="aff4446a-1432-407b-beb0-488c33eced18" ac:name="html" ac:schema-version="1"> + <ac:plain-text-body><![CDATA[<div + data-netdata="web_log_nginx_netdata.response_statuses" + data-host="https://frankfurt.my-netdata.io" + data-chart-library="easypiechart" + data-after="-14400" + data-before="0" + data-points="4" + data-title="frankfurt" + data-method="sum" + data-append-options="unaligned" + data-update-every="60" + data-width="120px" + data-common-max="1h_requests_pie" + data-decimal-digits="0" +></div>]]></ac:plain-text-body> + </ac:structured-macro> + <p class="auto-cursor-target"> + <br/> + </p> + </div> + </td> + <td colspan="1" style="text-align: center;"> + <div class="content-wrapper"> + <p class="auto-cursor-target"> + <br/> + </p> + <ac:structured-macro ac:macro-id="fd310534-627c-47bd-a184-361eb3f00489" ac:name="html" ac:schema-version="1"> + <ac:plain-text-body><![CDATA[<div + data-netdata="web_log_nginx_netdata.response_statuses" + data-host="https://sanfrancisco.my-netdata.io" + data-chart-library="easypiechart" + data-after="-14400" + data-before="0" + data-points="4" + data-title="sanfrancisco" + data-method="sum" + data-append-options="unaligned" + data-update-every="60" + data-width="120px" + data-common-max="1h_requests_pie" + data-decimal-digits="0" +></div>]]></ac:plain-text-body> + </ac:structured-macro> + <p class="auto-cursor-target"> + <br/> + </p> + </div> + </td> + <td colspan="1" style="text-align: center;"> + <div class="content-wrapper"> + <p class="auto-cursor-target"> + <br/> + </p> + <ac:structured-macro ac:macro-id="eb1261d5-8ff2-4a5c-8945-701bf04fb75b" ac:name="html" ac:schema-version="1"> + <ac:plain-text-body><![CDATA[<div + data-netdata="web_log_nginx_netdata.response_statuses" + data-host="https://toronto.my-netdata.io" + data-chart-library="easypiechart" + data-after="-14400" + data-before="0" + data-points="4" + data-title="toronto" + data-method="sum" + data-append-options="unaligned" + data-update-every="60" + data-width="120px" + data-common-max="1h_requests_pie" + data-decimal-digits="0" +></div>]]></ac:plain-text-body> + </ac:structured-macro> + <p class="auto-cursor-target"> + <br/> + </p> + </div> + </td> + </tr> + <tr> + <td colspan="1" style="text-align: right;"> + <strong>last<br/>1 hour</strong> + </td> + <td colspan="1" style="text-align: center;"> + <div class="content-wrapper"> + <p class="auto-cursor-target"> + <br/> + </p> + <ac:structured-macro ac:macro-id="d2ee8425-2c6c-4e26-8c5a-17f6153fdce1" ac:name="html" ac:schema-version="1"> + <ac:plain-text-body><![CDATA[<div + data-netdata="web_log_nginx_netdata.response_statuses" +data-host="https://london.my-netdata.io" + data-legend="false" + data-dygraph-yaxislabelwidth="35" + data-dygraph-ypixelsperlabel="8" +data-dygraph-xpixelsperlabel="30" +data-dygraph-xaxislabelwidth="26" + data-after="-3600" + data-before="0" + data-title="" + data-height="100px" + data-width="300px" +data-common-max="1h_requests" +data-decimal-digits="0" +></div>]]></ac:plain-text-body> + </ac:structured-macro> + <p class="auto-cursor-target"> + <br/> + </p> + </div> + </td> + <td colspan="1" style="text-align: center;"> + <div class="content-wrapper"> + <p class="auto-cursor-target"> + <br/> + </p> + <ac:structured-macro ac:macro-id="b3fb482a-4e9e-4b69-bb0b-9885d1687334" ac:name="html" ac:schema-version="1"> + <ac:plain-text-body><![CDATA[<div + data-netdata="web_log_nginx_netdata.response_statuses" +data-host="https://frankfurt.my-netdata.io" + data-legend="false" + data-dygraph-yaxislabelwidth="35" + data-dygraph-ypixelsperlabel="8" +data-dygraph-xpixelsperlabel="30" +data-dygraph-xaxislabelwidth="26" + data-after="-3600" + data-before="0" + data-title="" + data-height="100px" + data-width="300px" +data-common-max="1h_requests" +data-decimal-digits="0" +></div>]]></ac:plain-text-body> + </ac:structured-macro> + <p class="auto-cursor-target"> + <br/> + </p> + </div> + </td> + <td colspan="1" style="text-align: center;"> + <div class="content-wrapper"> + <p class="auto-cursor-target"> + <br/> + </p> + <ac:structured-macro ac:macro-id="199b1618-64be-4614-9662-f84cd01c6d8d" ac:name="html" ac:schema-version="1"> + <ac:plain-text-body><![CDATA[<div + data-netdata="web_log_nginx_netdata.response_statuses" +data-host="https://sanfrancisco.my-netdata.io" + data-legend="false" + data-dygraph-yaxislabelwidth="35" + data-dygraph-ypixelsperlabel="8" +data-dygraph-xpixelsperlabel="30" +data-dygraph-xaxislabelwidth="26" + data-after="-3600" + data-before="0" + data-title="" + data-height="100px" + data-width="300px" +data-common-max="1h_requests" +data-decimal-digits="0" +></div>]]></ac:plain-text-body> + </ac:structured-macro> + <p class="auto-cursor-target"> + <br/> + </p> + </div> + </td> + <td colspan="1" style="text-align: center;"> + <div class="content-wrapper"> + <p class="auto-cursor-target"> + <br/> + </p> + <ac:structured-macro ac:macro-id="61b2d444-fb2b-42e0-b4eb-611fb37dcb66" ac:name="html" ac:schema-version="1"> + <ac:plain-text-body><![CDATA[<div + data-netdata="web_log_nginx_netdata.response_statuses" +data-host="https://toronto.my-netdata.io" + data-legend="false" + data-dygraph-yaxislabelwidth="35" + data-dygraph-ypixelsperlabel="8" +data-dygraph-xpixelsperlabel="30" +data-dygraph-xaxislabelwidth="26" + data-after="-3600" + data-before="0" + data-title="" + data-height="100px" + data-width="300px" +data-common-max="1h_requests" +data-decimal-digits="0" +></div>]]></ac:plain-text-body> + </ac:structured-macro> + <p class="auto-cursor-target"> + <br/> + </p> + </div> + </td> + </tr> + <tr> + <td colspan="1" style="text-align: right;"> + <strong>last 10<br/>minutes</strong> + </td> + <td colspan="1" style="text-align: center;"> + <div class="content-wrapper"> + <p class="auto-cursor-target"> + <br/> + </p> + <ac:structured-macro ac:macro-id="f29e7663-f2e6-4e1d-a090-38704e0f2bd3" ac:name="html" ac:schema-version="1"> + <ac:plain-text-body><![CDATA[<div + data-netdata="web_log_nginx_netdata.response_statuses" +data-host="https://london.my-netdata.io" + data-legend="false" + data-dygraph-yaxislabelwidth="35" + data-dygraph-ypixelsperlabel="8" + data-after="-600" + data-before="0" + data-title="" + data-height="100px" + data-width="300px" +data-common-max="10m_requests" +data-decimal-digits="0" +></div>]]></ac:plain-text-body> + </ac:structured-macro> + <p class="auto-cursor-target"> + <br/> + </p> + </div> + </td> + <td colspan="1" style="text-align: center;"> + <div class="content-wrapper"> + <p class="auto-cursor-target"> + <br/> + </p> + <ac:structured-macro ac:macro-id="245ccc90-1505-430b-ba13-15e6a9793c11" ac:name="html" ac:schema-version="1"> + <ac:plain-text-body><![CDATA[<div + data-netdata="web_log_nginx_netdata.response_statuses" +data-host="https://frankfurt.my-netdata.io" + data-legend="false" + data-dygraph-yaxislabelwidth="35" + data-dygraph-ypixelsperlabel="8" + data-after="-600" + data-before="0" + data-title="" + data-height="100px" + data-width="300px" +data-common-max="10m_requests" +data-decimal-digits="0" +></div>]]></ac:plain-text-body> + </ac:structured-macro> + <p class="auto-cursor-target"> + <br/> + </p> + </div> + </td> + <td colspan="1" style="text-align: center;"> |