
diff options
| author | Fotis Voutsas <fotis@netdata.cloud> | 2023-10-03 13:37:52 +0300 |
|---|---|---|
| committer | GitHub <noreply@github.com> | 2023-10-03 13:37:52 +0300 |
| commit | ed980aea2b4be53465e65e6b7e77debe2e0afb6c (patch) | |
| tree | 072299d4f52c43ff400602f0438bec5294e4e663 /docs | |
| parent | 2da22320ef81b4eac4614b3aaace9437a8d31bd1 (diff) | |
Have one documentation page about Netdata Charts (#16042)
Diffstat (limited to 'docs')
| -rw-r--r-- | docs/cloud/visualize/interact-new-charts.md | 67 | ||||
| -rw-r--r-- | docs/dashboard/customize.md | 6 | ||||
| -rw-r--r-- | docs/dashboard/dimensions-contexts-families.md | 69 | ||||
| -rw-r--r-- | docs/glossary.md | 6 |
4 files changed, 68 insertions, 80 deletions
diff --git a/docs/cloud/visualize/interact-new-charts.md b/docs/cloud/visualize/interact-new-charts.md index 3707e945f2..16db927a8a 100644 --- a/docs/cloud/visualize/interact-new-charts.md +++ b/docs/cloud/visualize/interact-new-charts.md @@ -1,4 +1,4 @@ -# Interact with charts +# Netdata Charts Learn how to use Netdata's powerful charts to troubleshoot with real-time, per-second metric data. @@ -37,6 +37,65 @@ With a quick glance you have immediate information available at your disposal: - [Chart area](#hover-over-the-chart) - [Legend with dimensions](#dimensions-bar) +## Fundemental elements + +While Netdata's charts require no configuration and are easy to interact with, they have a lot of underlying complexity. To meaningfully organize charts out of the box based on what's happening in your nodes, Netdata uses the concepts of [dimensions](#dimensions), [contexts](#contexts), and [families](#families). + +Understanding how these work will help you more easily navigate the dashboard, +[write new alerts](https://github.com/netdata/netdata/blob/master/health/REFERENCE.md), or play around +with the [API](https://github.com/netdata/netdata/blob/master/web/api/README.md). + +### Dimensions + +A **dimension** is a value that gets shown on a chart. The value can be raw data or calculated values, such as the +average (the default), minimum, or maximum. These values can then be given any type of unit. For example, CPU +utilization is represented as a percentage, disk I/O as `MiB/s`, and available RAM as an absolute value in `MiB` or +`GiB`. + +Beneath every chart (or on the right-side if you configure the dashboard) is a legend of dimensions. When there are +multiple dimensions, you'll see a different entry in the legend for each dimension. + +The **Apps CPU Time** chart (with the [context](#contexts) `apps.cpu`), which visualizes CPU utilization of +different types of processes/services/applications on your node, always provides a vibrant example of a chart with +multiple dimensions. + +Dimensions can be [hidden](#show-and-hide-dimensions) to help you focus your attention. + +### Contexts + +A **context** is a way of grouping charts by the types of metrics collected and dimensions displayed. It's like a machine-readable naming and organization scheme. + +For example, the **Apps CPU Time** has the context `apps.cpu`. A little further down on the dashboard is a similar +chart, **Apps Real Memory (w/o shared)** with the context `apps.mem`. The `apps` portion of the context is the **type**, +whereas anything after the `.` is specified either by the chart's developer or by the [family](#families). + +By default, a chart's type affects where it fits in the menu, while its family creates submenus. + +Netdata also relies on contexts for [alert configuration](https://github.com/netdata/netdata/blob/master/health/REFERENCE.md) (the [`on` line](https://github.com/netdata/netdata/blob/master/health/REFERENCE.md#alert-line-on)). + +### Families + +**Families** are a _single instance_ of a hardware or software resource that needs to be displayed separately from +similar instances. + +For example, let's look at the **Disks** section, which contains a number of charts with contexts like `disk.io`, +`disk.ops`, `disk.backlog`, and `disk.util`. If your node has multiple disk drives at `sda` and `sdb`, Netdata creates +a separate family for each. + +Netdata now merges the contexts and families to create charts that are grouped by family, following a +`[context].[family]` naming scheme, so that you can see the `disk.io` and `disk.ops` charts for `sda` right next to each +other. + +Given the four example contexts, and two families of `sda` and `sdb`, Netdata will create the following charts and their +names: + +| Context | `sda` family | `sdb` family | +|:---------------|--------------------|--------------------| +| `disk.io` | `disk_io.sda` | `disk_io.sdb` | +| `disk.ops` | `disk_ops.sda` | `disk_ops.sdb` | +| `disk.backlog` | `disk_backlog.sda` | `disk_backlog.sdb` | +| `disk.util` | `disk_util.sda` | `disk_util.sdb` | + ## Title bar When you start interacting with a chart, you'll notice valuable information on the top bar: @@ -77,7 +136,6 @@ Each composite chart has a definition bar to provide information and options abo To help users instantly understand and validate the data they see on charts, we developed the NIDL (Nodes, Instances, Dimensions, Labels) framework. This information is visualized on all charts. - > You can explore the in-depth infographic, by clicking on this image and opening it in a new tab, > allowing you to zoom in to the different parts of it. > @@ -85,7 +143,6 @@ To help users instantly understand and validate the data they see on charts, we > <img src="https://user-images.githubusercontent.com/2662304/235475061-44628011-3b1f-4c44-9528-34452018eb89.png" width="400" border="0" align="center"/> > </a> - You can rapidly access condensed information for collected metrics, grouped by node, monitored instances, dimension, or any key/value label pair. At the Definition bar of each chart, there are a few dropdown menus: @@ -176,7 +233,6 @@ This menu also presents the contribution of each original dimensions on the char <img src="https://user-images.githubusercontent.com/70198089/236138796-08dc6ac6-9a50-4913-a46d-d9bbcedd48f6.png" width="900"/> - ### Labels dropdown In this dropdown, you can view or filter the contributing time-series labels of the chart. @@ -293,7 +349,6 @@ The available manipulation tools you can select are: - Chart zoom - Reset zoom - ### Pan Drag your mouse/finger to the right to pan backward through time, or drag to the left to pan forward in time. Think of @@ -340,10 +395,8 @@ Zooming out lets you see metrics within the larger context, such as the last hou The bottom legend where you can see the dimensions of the chart can be ordered by: - <img src="https://user-images.githubusercontent.com/70198089/236144658-6c3d0e31-9bcb-45f3-bb95-4eafdcbb0a58.png" width="300" /> - - Dimension name (Ascending or Descending) - Dimension value (Ascending or Descending) - Dimension Anomaly Rate (Ascending or Descending) diff --git a/docs/dashboard/customize.md b/docs/dashboard/customize.md index d9538e62f5..301f0bd6b5 100644 --- a/docs/dashboard/customize.md +++ b/docs/dashboard/customize.md @@ -1,5 +1,9 @@ # Customize the standard dashboard +> ### Disclaimer +> +> This document is only applicable to the v1 version of the dashboard and doesn't affect the [Netdata Dashboard](https://github.com/netdata/netdata/blob/master/docs/category-overview-pages/accessing-netdata-dashboards.md). + While the [Netdata dashboard](https://github.com/netdata/netdata/blob/master/web/gui/README.md) comes preconfigured with hundreds of charts and thousands of metrics, you may want to alter your experience based on a particular use case or preferences. @@ -69,4 +73,4 @@ the following line to the `[web]` section to tell Netdata where to find your cus custom dashboard_info.js = your_dashboard_info_file.js ``` -Reload your browser tab to see your custom configuration. +Reload your browser tab to see your custom configuration.
\ No newline at end of file diff --git a/docs/dashboard/dimensions-contexts-families.md b/docs/dashboard/dimensions-contexts-families.md deleted file mode 100644 index 4bea869d57..0000000000 --- a/docs/dashboard/dimensions-contexts-families.md +++ /dev/null @@ -1,69 +0,0 @@ -# Chart dimensions, contexts, and families - -While Netdata's charts require no configuration and are [easy to interact with](https://github.com/netdata/netdata/blob/master/docs/cloud/visualize/interact-new-charts.md), -they have a lot of underlying complexity. To meaningfully organize charts out of the box based on what's happening in -your nodes, Netdata uses the concepts of **dimensions**, **contexts**, and **families**. - -Understanding how these work will help you more easily navigate the dashboard, -[write new alerts](https://github.com/netdata/netdata/blob/master/health/REFERENCE.md), or play around -with the [API](https://github.com/netdata/netdata/blob/master/web/api/README.md). - -## Dimension - -A **dimension** is a value that gets shown on a chart. The value can be raw data or calculated values, such as the -average (the default), minimum, or maximum. These values can then be given any type of unit. For example, CPU -utilization is represented as a percentage, disk I/O as `MiB/s`, and available RAM as an absolute value in `MiB` or -`GiB`. - -Beneath every chart (or on the right-side if you configure the dashboard) is a legend of dimensions. When there are -multiple dimensions, you'll see a different entry in the legend for each dimension. - -The **Apps CPU Time** chart (with the [context](#context) `apps.cpu`), which visualizes CPU utilization of -different types of processes/services/applications on your node, always provides a vibrant example of a chart with -multiple dimensions. - -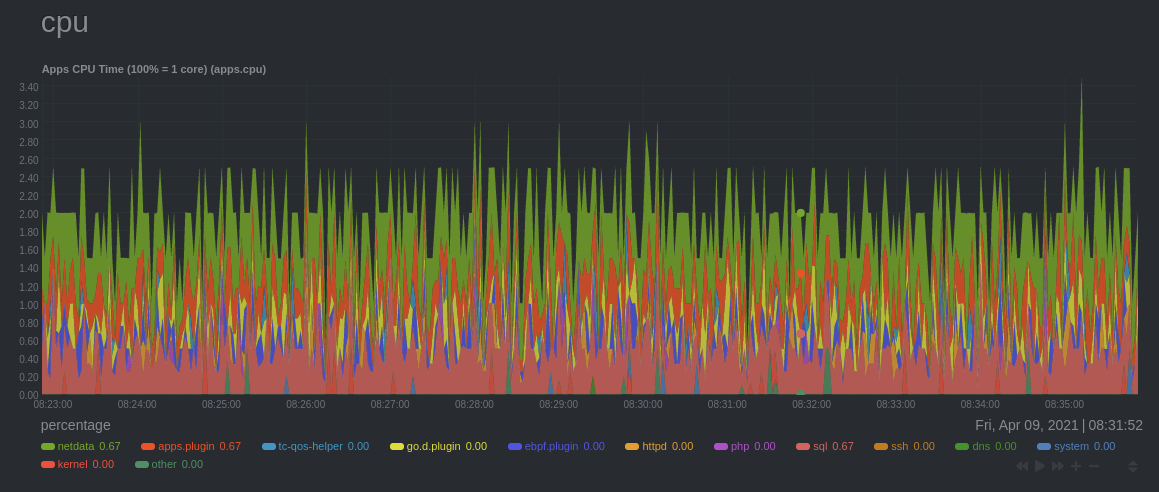 - -The chart shows 13 unique dimensions, such as `httpd` for the CPU utilization for web servers, `kernel` for anything -related to the Linux kernel, and so on. In your dashboard, these specific dimensions will almost certainly be different. - -Dimensions can be [hidden](https://github.com/netdata/netdata/blob/master/docs/cloud/visualize/interact-new-charts.md#show-and-hide-dimensions) to help you focus your -attention. - -## Context - -A **context** is a way of grouping charts by the types of metrics collected and dimensions displayed. It's kind of like -a machine-readable naming and organization scheme. - -For example, the **Apps CPU Time** has the context `apps.cpu`. A little further down on the dashboard is a similar -chart, **Apps Real Memory (w/o shared)** with the context `apps.mem`. The `apps` portion of the context is the **type**, -whereas anything after the `.` is specified either by the chart's developer or by the [**family**](#family). - -By default, a chart's type affects where it fits in the menu, while its family creates submenus. - -Netdata also relies on contexts for [alert configuration](https://github.com/netdata/netdata/blob/master/health/REFERENCE.md) (the [`on` -line](https://github.com/netdata/netdata/blob/master/health/REFERENCE.md#alert-line-on)). - -## Family - -**Families** are a _single instance_ of a hardware or software resource that needs to be displayed separately from -similar instances. - -For example, let's look at the **Disks** section, which contains a number of charts with contexts like `disk.io`, -`disk.ops`, `disk.backlog`, and `disk.util`. If your node has multiple disk drives at `sda` and `sdb`, Netdata creates -a separate family for each. - -Netdata now merges the contexts and families to create charts that are grouped by family, following a -`[context].[family]` naming scheme, so that you can see the `disk.io` and `disk.ops` charts for `sda` right next to each -other. - -Given the four example contexts, and two families of `sda` and `sdb`, Netdata will create the following charts and their -names: - -| Context | `sda` family | `sdb` family | -|:---------------|--------------------|--------------------| -| `disk.io` | `disk_io.sda` | `disk_io.sdb` | -| `disk.ops` | `disk_ops.sda` | `disk_ops.sdb` | -| `disk.backlog` | `disk_backlog.sda` | `disk_backlog.sdb` | -| `disk.util` | `disk_util.sda` | `disk_util.sdb` | diff --git a/docs/glossary.md b/docs/glossary.md index 8b63c7711b..26817d42c5 100644 --- a/docs/glossary.md +++ b/docs/glossary.md @@ -41,7 +41,7 @@ Use the alphabatized list below to find the answer to your single-term questions - [**Composite Charts**](https://github.com/netdata/netdata/blob/master/docs/cloud/visualize/overview.md#overview-and-single-node-view): Charts used by the **Overview** tab which aggregate metrics from all the nodes (or a filtered selection) in a given War Room. -- [**Context**](https://github.com/netdata/netdata/blob/master/docs/dashboard/dimensions-contexts-families.md#context): A way of grouping charts by the types of metrics collected and dimensions displayed. It's kind of like a machine-readable naming and organization scheme. +- [**Context**](https://github.com/netdata/netdata/blob/master/docs/cloud/visualize/interact-new-charts.md#contexts): A way of grouping charts by the types of metrics collected and dimensions displayed. It's kind of like a machine-readable naming and organization scheme. - [**Custom dashboards**](https://github.com/netdata/netdata/blob/master/web/gui/custom/README.md) A dashboard that you can create using simple HTML (no javascript is required for basic dashboards). @@ -51,7 +51,7 @@ Use the alphabatized list below to find the answer to your single-term questions - [**Definition Bar**](https://github.com/netdata/netdata/blob/master/docs/cloud/visualize/interact-new-charts.md): Bar within a composite chart that provides important information and options about the metrics within the chart. -- [**Dimension**](https://github.com/netdata/netdata/blob/master/docs/dashboard/dimensions-contexts-families.md#dimension): A dimension is a value that gets shown on a chart. +- [**Dimension**](https://github.com/netdata/netdata/blob/master/docs/cloud/visualize/interact-new-charts.md#dimensions): A dimension is a value that gets shown on a chart. - [**Distributed Architecture**](https://github.com/netdata/netdata/blob/master/docs/store/distributed-data-architecture.md): The data architecture mindset with which Netdata was built, where all data are collected and stored on the edge, whenever it's possible, creating countless benefits. @@ -61,7 +61,7 @@ Use the alphabatized list below to find the answer to your single-term questions ## F -- [**Family**](https://github.com/netdata/netdata/blob/master/docs/dashboard/dimensions-contexts-families.md#family): 1. What we consider our Netdata community of users and engineers. 2. A single instance of a hardware or software resource that needs to be displayed separately from similar instances. +- [**Family**](https://github.com/netdata/netdata/blob/master/docs/cloud/visualize/interact-new-charts.md#families): 1. What we consider our Netdata community of users and engineers. 2. A single instance of a hardware or software resource that needs to be displayed separately from similar instances. - [**Flood Protection**](https://github.com/netdata/netdata/blob/master/docs/cloud/alerts-notifications/notifications.md#flood-protection): If a node has too many state changes like firing too many alerts or going from reachable to unreachable, Netdata Cloud enables flood protection. As long as a node is in flood protection mode, Netdata Cloud does not send notifications about this node |