
diff options
| author | Vladimir Kobal <vlad@prokk.net> | 2020-05-26 20:08:29 +0300 |
|---|---|---|
| committer | GitHub <noreply@github.com> | 2020-05-26 20:08:29 +0300 |
| commit | b4e9fd0c591a66c11f4bdd0d2c667556e9d866c3 (patch) | |
| tree | ed6397f4174f03c6bd879b6679e771f17fd8dda3 /docs | |
| parent | 6b091fafd9c3b0197325b3ef751dbdb317048e2b (diff) | |
Change backends to exporting engine in general documentation pages (#9045)
Diffstat (limited to 'docs')
| -rw-r--r-- | docs/getting-started.md | 2 | ||||
| -rw-r--r-- | docs/netdata-security.md | 2 | ||||
| -rw-r--r-- | docs/step-by-step/step-01.md | 2 | ||||
| -rw-r--r-- | docs/step-by-step/step-09.md | 68 | ||||
| -rw-r--r-- | docs/tutorials/longer-metrics-storage.md | 3 | ||||
| -rw-r--r-- | docs/what-is-netdata.md | 12 |
6 files changed, 35 insertions, 54 deletions
diff --git a/docs/getting-started.md b/docs/getting-started.md index 696d62a997..2993fb73e3 100644 --- a/docs/getting-started.md +++ b/docs/getting-started.md @@ -243,7 +243,7 @@ Netdata. Take a look at some more advanced features and configurations: - Centralize Netdata metrics from many systems with [streaming](/streaming/README.md) -- Enable long-term archiving of Netdata metrics via [backends](/backends/README.md) to time-series databases. +- Enable long-term archiving of Netdata metrics via [exporting engine](/exporting/README.md) to time-series databases. - Improve security by putting Netdata behind an [Nginx proxy with SSL](/docs/Running-behind-nginx.md). Or, learn more about how you can contribute to [Netdata core](/CONTRIBUTING.md) or our diff --git a/docs/netdata-security.md b/docs/netdata-security.md index 489b75b2ff..36ee6d5e9d 100644 --- a/docs/netdata-security.md +++ b/docs/netdata-security.md @@ -26,7 +26,7 @@ We have given special attention to all aspects of Netdata, ensuring that everyth Netdata collects raw data from many sources. For each source, Netdata uses a plugin that connects to the source (or reads the relative files produced by the source), receives raw data and processes them to calculate the metrics shown on Netdata dashboards. -Even if Netdata plugins connect to your database server, or read your application log file to collect raw data, the product of this data collection process is always a number of **chart metadata and metric values** (summarized data for dashboard visualization). All Netdata plugins (internal to the Netdata daemon, and external ones written in any computer language), convert raw data collected into metrics, and only these metrics are stored in Netdata databases, sent to upstream Netdata servers, or archived to backend time-series databases. +Even if Netdata plugins connect to your database server, or read your application log file to collect raw data, the product of this data collection process is always a number of **chart metadata and metric values** (summarized data for dashboard visualization). All Netdata plugins (internal to the Netdata daemon, and external ones written in any computer language), convert raw data collected into metrics, and only these metrics are stored in Netdata databases, sent to upstream Netdata servers, or archived to external time-series databases. > The **raw data** collected by Netdata, do not leave the host they are collected. **The only data Netdata exposes are chart metadata and metric values.** diff --git a/docs/step-by-step/step-01.md b/docs/step-by-step/step-01.md index 2a0f0421c5..85cd64adeb 100644 --- a/docs/step-by-step/step-01.md +++ b/docs/step-by-step/step-01.md @@ -141,7 +141,7 @@ easy! We'll cover this quickly, as you're probably eager to get on with using Netdata itself. We don't want to lock you in to using Netdata by itself, and forever. By supporting [archiving to -backends](/backends/README.md) like Graphite, Prometheus, OpenTSDB, MongoDB, and others, you can use Netdata _in +external databases](/exporting/README.md) like Graphite, Prometheus, OpenTSDB, MongoDB, and others, you can use Netdata _in conjunction_ with software that might seem like our competitors. We don't want to "wage war" with another monitoring solution, whether it's commercial, open-source, or anything in diff --git a/docs/step-by-step/step-09.md b/docs/step-by-step/step-09.md index 7664211c43..09aaa425e0 100644 --- a/docs/step-by-step/step-09.md +++ b/docs/step-by-step/step-09.md @@ -18,16 +18,15 @@ That's a lot of metrics. We're talking 345,600,000 individual data points. And t a portion of the RAM available on most systems. To store _even more_ metrics, you have two options. First, you can tweak the database engine's options to expand the RAM -or disk it uses. Second, you can archive metrics to a different backend. For that, we'll use MongoDB and Prometheus as -examples. +or disk it uses. Second, you can archive metrics to an external database. For that, we'll use MongoDB as examples. ## What you'll learn in this step In this step of the Netdata guide, you'll learn how to: - [Tweak the database engine's settings](#tweak-the-database-engines-settings) -- [Archive metrics to a backend](#archive-metrics-to-a-backend) - - [Use the MongoDB backend](#archive-metrics-via-the-mongodb-backend) +- [Archive metrics to an external database](#archive-metrics-to-an-external-database) + - [Use the MongoDB database](#archive-metrics-via-the-mongodb-exporting-connector) Let's get started! @@ -73,15 +72,16 @@ the right-hand side. You can find `dbengine` metrics after `queries`. 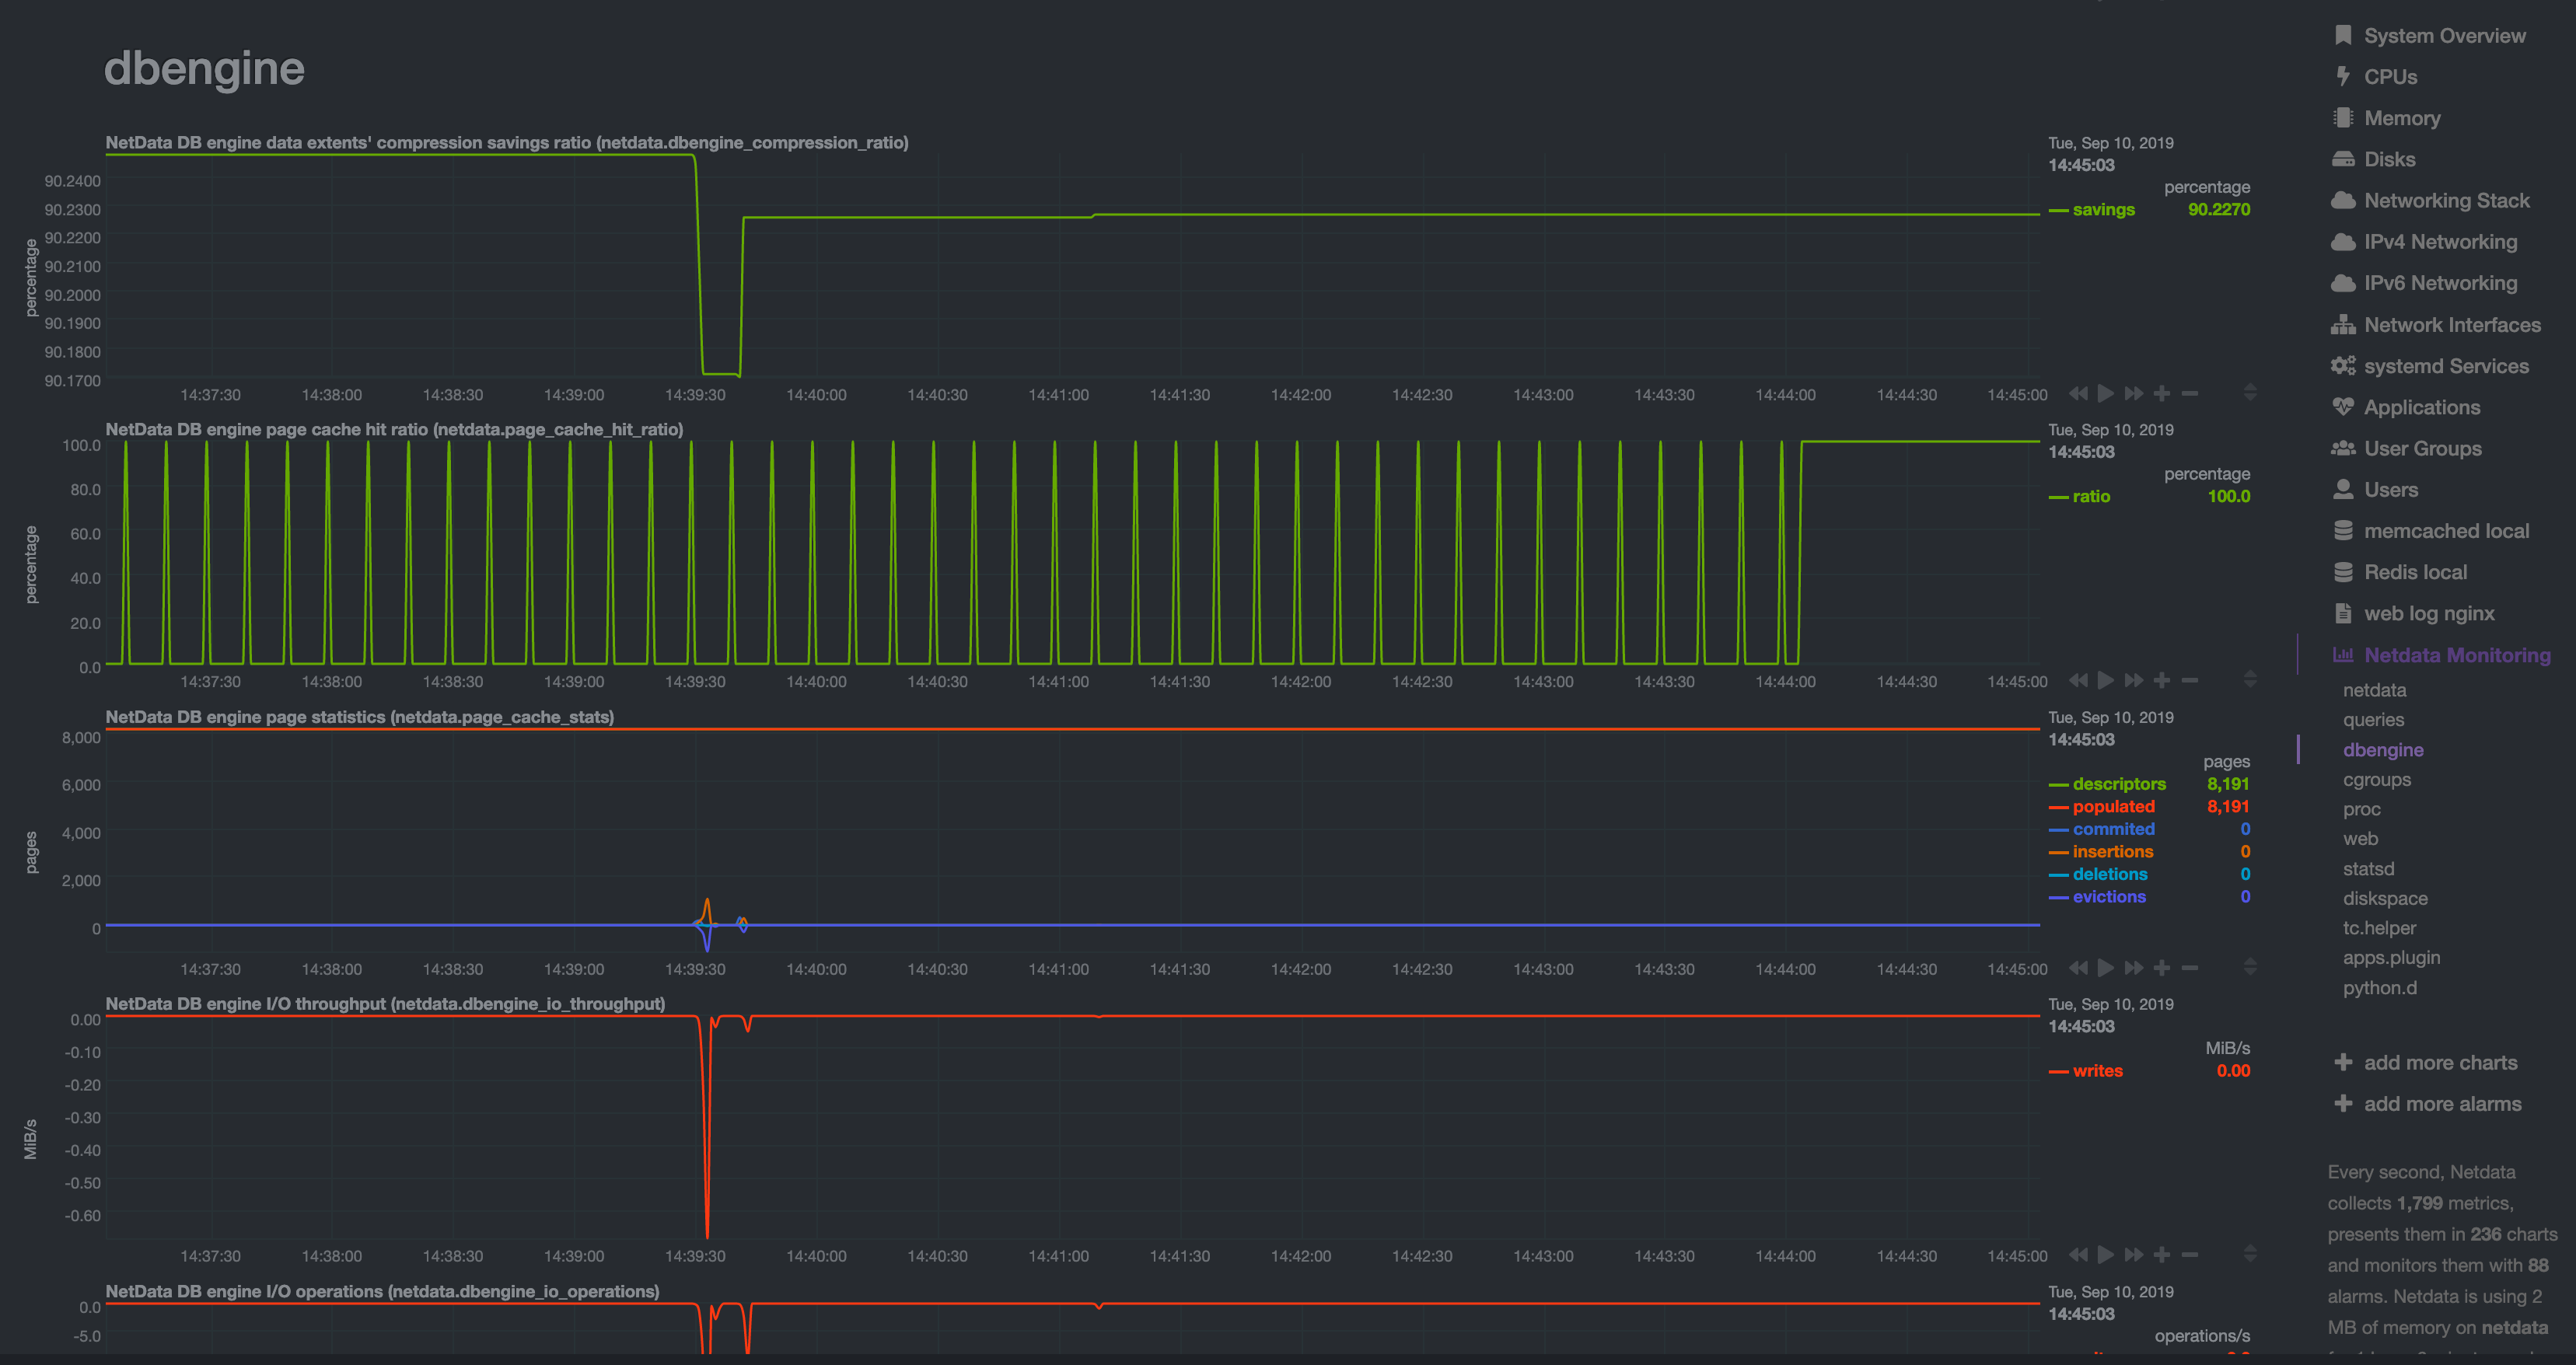 -## Archive metrics to a backend +## Archive metrics to an external database -You can archive all the metrics collected by Netdata to what we call **backends**. The supported backends include -Graphite, OpenTSDB, Prometheus, AWS Kinesis Data Streams, MongoDB, and the list is always growing. +You can archive all the metrics collected by Netdata to **external databases**. The supported databases and services +include Graphite, OpenTSDB, Prometheus, AWS Kinesis Data Streams, Google Cloud Pub/Sub, MongoDB, and the list is always +growing. As we said in [step 1](/docs/step-by-step/step-01.md), we have only complimentary systems, not competitors! We're happy to support these archiving methods and are always working to improve them. -A lot of Netdata users archive their metrics to one of these backends for long-term storage or further analysis. Since +A lot of Netdata users archive their metrics to one of these databases for long-term storage or further analysis. Since Netdata collects so many metrics every second, they can quickly overload small devices or even big servers that are aggregating metrics streaming in from other Netdata agents. @@ -91,11 +91,7 @@ sum of every X seconds of metrics. This reduces the sheer amount of data, albeit How you archive metrics, or if you archive metrics at all, is entirely up to you! But let's cover two easy archiving methods, MongoDB and Prometheus remote write, to get you started. -> Currently, Netdata can only use a single backend at a time. We are currently working on a new archiving solution, -> which we call "exporters," that simplifies the configuration process and allows you to archive to multiple backends. -> We'll update this tutorial as soon as exporters are enabled. - -### Archive metrics via the MongoDB backend +### Archive metrics via the MongoDB exporting connector Begin by installing MongoDB its dependencies via the correct package manager for your system. @@ -122,7 +118,7 @@ use netdata db.createCollection("netdata_metrics") ``` -Next, Netdata needs to be reinstalled in order to detect that the required libraries to make this backend connection +Next, Netdata needs to be reinstalled in order to detect that the required libraries to make this exporting connection exist. Since you most likely installed Netdata using the one-line installer script, all you have to do is run that script again. Don't worry—any configuration changes you made along the way will be retained! @@ -130,45 +126,31 @@ script again. Don't worry—any configuration changes you made along the way wil bash <(curl -Ss https://my-netdata.io/kickstart.sh) ``` -Now, from your Netdata config directory, edit your `netdata.conf` file and set these options in the `[backend]` section: - -```conf -[backend] - enabled = yes - type = mongodb -``` - -You now need to initialize and edit a `mongodb.conf` file to tell Netdata where to find the database you just created. +Now, from your Netdata config directory, initialize and edit a `exporting.conf` file to tell Netdata where to find the +database you just created. ```sh -./edit-config mongodb.conf +./edit-config exporting.conf ``` -Add the following values to the file: +Add the following section to the file: -```yaml -# MongoDB backend configuration -# -# All options in this file are mandatory - -# URI -uri = mongodb://localhost - -# database name -database = netdata - -# collection name -collection = netdata_metrics +```conf +[mongodb:my_mongo_instance] + enabled = yes + destination = mongodb://localhost + database = netdata + collection = netdata_metrics ``` -[Restart](/docs/getting-started.md#start-stop-and-restart-netdata) Netdata to enable the MongoDB backend. Click on the -**Netdata Montioring** menu and check out the **backend** sub-menu. You should start seeing these charts fill up with -data about your MongoDB backend! +[Restart](/docs/getting-started.md#start-stop-and-restart-netdata) Netdata to enable the MongoDB exporting connector. +Click on the **Netdata Montioring** menu and check out the **exporting my mongo instance** sub-menu. You should start +seeing these charts fill up with data about the exporting process! 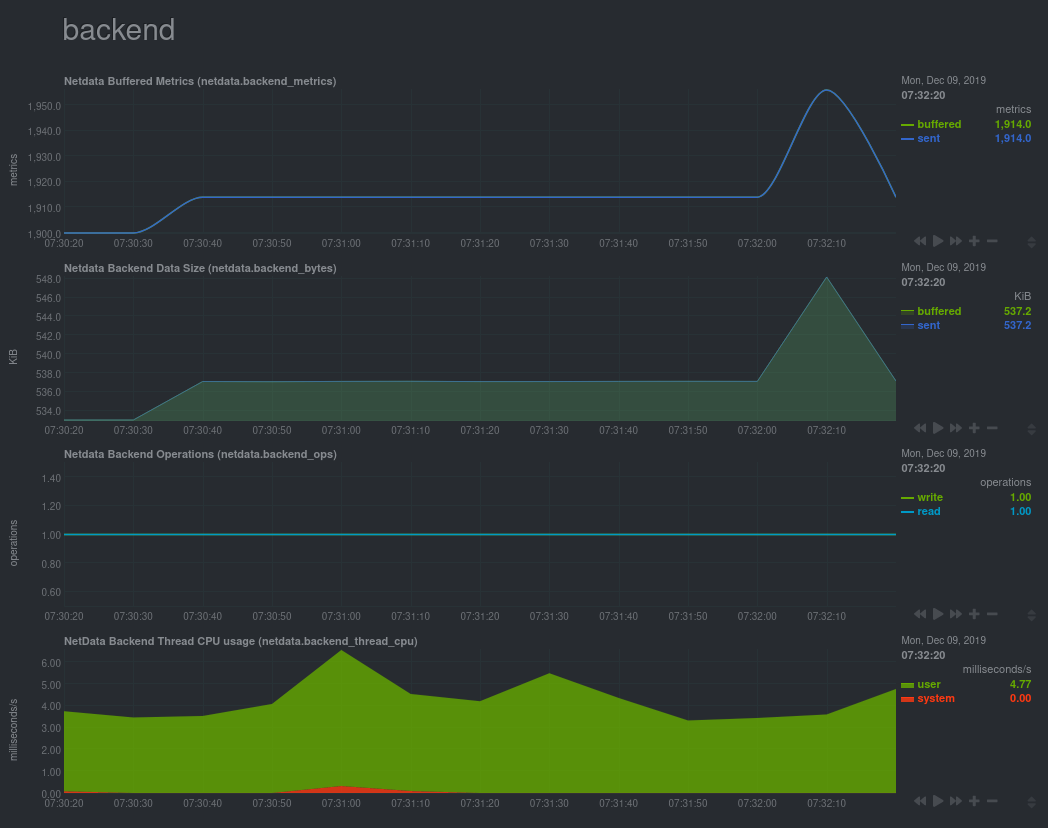 -If you'd like to try connecting Netdata to another backend, such as Prometheus or OpenTSDB, read our [backends -documentation](/backends/README.md). +If you'd like to try connecting Netdata to another database, such as Prometheus or OpenTSDB, read our [exporting +documentation](/exporting/README.md). ## What's next? diff --git a/docs/tutorials/longer-metrics-storage.md b/docs/tutorials/longer-metrics-storage.md index 9a36b1c94d..40dad05fd1 100644 --- a/docs/tutorials/longer-metrics-storage.md +++ b/docs/tutorials/longer-metrics-storage.md @@ -11,8 +11,7 @@ long term? Many people think Netdata can only store about an hour's worth of real-time metrics, but that's simply not true any more. With the right settings, Netdata is quite capable of efficiently storing hours or days worth of historical, -per-second metrics without having to rely on a [backend](/backends/README.md) or [exporting -connector](/exporting/README.md). +per-second metrics without having to rely on an [exporting engine](/exporting/README.md). This tutorial gives two options for configuring Netdata to store more metrics. **We recommend the default [database engine](#using-the-database-engine)**, but you can stick with or switch to the round-robin database if you prefer. diff --git a/docs/what-is-netdata.md b/docs/what-is-netdata.md index 2f00db22e6..e3a97ffb0f 100644 --- a/docs/what-is-netdata.md +++ b/docs/what-is-netdata.md @@ -223,7 +223,7 @@ This is how it works: | **Store** | Metrics are first stored in RAM in a custom database engine that then "spills" historical metrics to disk for efficient long-term metrics storage. | [`database`](/database/README.md) | | **Check** | A lockless independent watchdog is evaluating **health checks** on the collected metrics, triggers alarms, maintains a health transaction log and dispatches alarm notifications. | [`health`](/health/README.md) | | **Stream** | A lockless independent worker is streaming metrics, in full detail and in real-time, to remote Netdata servers, as soon as they are collected. | [`streaming`](/streaming/README.md) | -| **Archive** | A lockless independent worker is down-sampling the metrics and pushes them to **backend** time-series databases. | [`backends`](/backends/README.md) | +| **Archive** | A lockless independent worker is down-sampling the metrics and pushes them to external time-series databases. | [`exporting`](/exporting/README.md) | | **Query** | Multiple independent workers are attached to the [internal web server](/web/server/README.md), servicing API requests, including [data queries](/web/api/queries/README.md). | [`web/api`](/web/api/README.md) | The result is a highly efficient, low-latency system, supporting multiple readers and one writer on each metric. @@ -279,10 +279,10 @@ This is what you should expect from Netdata: ### Integrations - **Time-series databases** - Netdata can archive its metrics to **Graphite**, **OpenTSDB**, **Prometheus**, **AWS - Kinesis**, **MongoDB**, **JSON document DBs**, in the same or lower resolution (lower: to prevent it from congesting - these servers due to the amount of data collected). Netdata also supports **Prometheus remote write API**, which - allows storing metrics to **Elasticsearch**, **Gnocchi**, **InfluxDB**, **Kafka**, **PostgreSQL/TimescaleDB**, - **Splunk**, **VictoriaMetrics** and a lot of other [storage + Kinesis**, **Google Cloud Pub/Sub**, **MongoDB**, **JSON document DBs**, in the same or lower resolution (lower: to + prevent it from congesting these servers due to the amount of data collected). Netdata also supports **Prometheus + remote write API**, which allows storing metrics to **Elasticsearch**, **Gnocchi**, **InfluxDB**, **Kafka**, + **PostgreSQL/TimescaleDB**, **Splunk**, **VictoriaMetrics** and a lot of other [storage providers](https://prometheus.io/docs/operating/integrations/#remote-endpoints-and-storage). ## Visualization @@ -370,7 +370,7 @@ Here is a quick list of notable documents: | [`collectors`](/collectors/README.md) | Information about data collection plugins. | | [`health`](/health/README.md) | How Netdata's health monitoring works, how to create your own alarms and how to configure alarm notification methods. | | [`streaming`](/streaming/README.md) | How to build hierarchies of Netdata servers, by streaming metrics between them. | -| [`backends`](/backends/README.md) | Long term archiving of metrics to industry-standard time-series databases, like `prometheus`, `graphite`, `opentsdb`. | +| [`exporting`](/exporting/README.md) | Long term archiving of metrics to industry-standard time-series databases, like `prometheus`, `graphite`, `opentsdb`. | | [`web/api`](/web/api/README.md) | Learn how to query the Netdata API and the queries it supports. | | [`web/api/badges`](/web/api/badges/README.md) | Learn how to generate badges (SVG images) from live data. | | [`web/gui/custom`](/web/gui/custom/README.md) | Learn how to create custom Netdata dashboards. | |