
diff options
| author | Fotis Voutsas <fotis@netdata.cloud> | 2024-05-29 16:04:26 +0300 |
|---|---|---|
| committer | GitHub <noreply@github.com> | 2024-05-29 16:04:26 +0300 |
| commit | 5d0395ece2bb82fe0cb75ee28e35e1eaa0948bb6 (patch) | |
| tree | b9ca2c4d3b9ecff776eb847ae6141567f4961887 /docs | |
| parent | ccdd56e4cb76341d3d679b27fad277eee4cb4ac5 (diff) | |
Netdata Cloud docs section edits (#17768)
Co-authored-by: Ilya Mashchenko <ilya@netdata.cloud>
Diffstat (limited to 'docs')
| -rw-r--r-- | docs/netdata-cloud/monitor-your-infrastructure.md | 216 | ||||
| -rw-r--r-- | docs/netdata-cloud/netdata-subscription-plans.md | 42 | ||||
| -rw-r--r-- | docs/netdata-cloud/view-plan-and-billing.md | 51 |
3 files changed, 45 insertions, 264 deletions
diff --git a/docs/netdata-cloud/monitor-your-infrastructure.md b/docs/netdata-cloud/monitor-your-infrastructure.md deleted file mode 100644 index 2b741d0e37..0000000000 --- a/docs/netdata-cloud/monitor-your-infrastructure.md +++ /dev/null @@ -1,216 +0,0 @@ -import { Grid, Box, BoxList, BoxListItemRegexLink } from '@site/src/components/Grid/' -import { RiExternalLinkLine } from 'react-icons/ri' - -# Monitor your infrastructure - -Learn how to view key metrics, insightful charts, and active alerts from all your nodes, with Netdata Cloud's real-time infrastructure monitoring. - -[Netdata Cloud](https://app.netdata.cloud) provides scalable infrastructure monitoring for any number of distributed -nodes running the Netdata Agent. A node is any system in your infrastructure that you want to monitor, whether it's a -physical or virtual machine (VM), container, cloud deployment, or edge/IoT device. - -The Netdata Agent uses zero-configuration collectors to gather metrics from every application and container instantly, -and uses Netdata's distributed data architecture to store metrics -locally. Without a slow and troublesome centralized data lake for your infrastructure's metrics, you reduce the -resources you need to invest in, and the complexity of, monitoring your infrastructure. - -Netdata Cloud unifies infrastructure monitoring by _centralizing the interface_ you use to query and visualize your -nodes' metrics, not the data. By streaming metrics values to your browser, with Netdata Cloud acting as the secure proxy -between them, you can monitor your infrastructure using customizable, interactive, and real-time visualizations from any -number of distributed nodes. - -In this quickstart guide, you'll learn the basics of using Netdata Cloud to monitor an infrastructure with dashboards, -composite charts, and alert viewing. You'll then learn about the most critical ways to configure the Agent on each of -your nodes to maximize the value you get from Netdata. - -This quickstart assumes you've [installed Netdata](https://github.com/netdata/netdata/edit/master/packaging/installer/README.md) -on more than one node in your infrastructure, and connected those nodes to your Space in Netdata Cloud. - -## Set up your Netdata Cloud experience - -Start your infrastructure monitoring experience by setting up your Netdata Cloud account. - -### Organize Spaces and War Rooms - -Spaces are high-level containers to help you organize your team members and the nodes they can view in each War Room. -You already have at least one Space in your Netdata Cloud account. - -A single Space puts all your metrics in one easily-accessible place, while multiple Spaces creates logical division -between different users and different pieces of a large infrastructure. For example, a large organization might have one -SRE team for the user-facing SaaS application, and a second IT team for managing employees' hardware. Since these teams -don't monitor the same nodes, they can work in separate Spaces and then further organize their nodes into War Rooms. - -Next, set up War Rooms. Netdata Cloud creates dashboards and visualizations based on the nodes added to a given War -Room. You can [organize War Rooms](/docs/netdata-cloud/organize-your-infrastructure-invite-your-team.md#war-room-organization) in any way -you want, such as by the application type, for end-to-end application monitoring, or as an incident response tool. - -Learn more about [Spaces](/docs/netdata-cloud/organize-your-infrastructure-invite-your-team.md#netdata-cloud-spaces) and [War -Rooms](/docs/netdata-cloud/organize-your-infrastructure-invite-your-team.md#netdata-cloud-war-rooms), including how to manage each, in their respective reference -documentation. - -### Invite your team - -Netdata Cloud makes an infrastructure's real-time metrics available and actionable to all organization members. By -inviting others, you can better synchronize with your team or colleagues to understand your infrastructure's heartbeat. -When something goes wrong, you'll be ready to collaboratively troubleshoot complex performance problems from a single -pane of glass. - -To [invite new users](/docs/netdata-cloud/organize-your-infrastructure-invite-your-team.md#invite-your-team), click on **Invite Users** in the -Space management Area. Choose which War Rooms to add this user to, then click **Send**. - -### See an overview of your infrastructure - -Netdata Cloud utilizes "tabs" in order to provide you with informative sections based on your infrastructure. -These tabs can be separated into "static", meaning they are by default presented, and "non-static" which are tabs that get presented by user action (e.g clicking on a custom dashboard) - -#### Static tabs - -- The default tab for any War Room is the [Home tab](/docs/dashboards-and-charts/home-tab.md), which gives you an overview of this Space. - Here you can see the number of Nodes claimed, data retention statics, users by role, alerts and more. - -- The [Nodes tab](/docs/dashboards-and-charts/nodes-tab.md) gives you the ability to see the status (offline or online), host details, alert status and also a short overview of some key metrics from all your nodes at a glance. - -- The third and most important tab is the [Metrics tab](/docs/dashboards-and-charts/metrics-tab-and-single-node-tabs.md) which uses composite charts to display real-time metrics from every available node in a given War Room. - -- [Kubernetes tab](/docs/dashboards-and-charts/kubernetes-tab.md) is a logical grouping of charts regarding your Kubernetes clusters. It contains a subset of the charts available in the **Overview tab**. - -- The [Dashboards tab](/docs/dashboards-and-charts/dashboards-tab.md) gives you the ability to have tailored made views of specific/targeted interfaces for your infrastructure using any number of charts from any number of nodes. - -- The [Alerts tab](/docs/dashboards-and-charts/alerts-tab.md) provides you with an overview for all the active alerts you receive for the nodes in this War Room, you can also see all the alerts that are configured to be triggered in any given moment. - -- The [Anomalies tab](/docs/dashboards-and-charts/anomaly-advisor-tab.md) is dedicated to the Anomaly Advisor tool. - -- The [Functions tab](/docs/top-monitoring-netdata-functions.md) gives you the ability to visualize functions that the Netdata Agent collectors are able to expose. - -- The [Feed & events](/docs/dashboards-and-charts/events-feed.md) tab lets you investigate events that occurred in the past, which is invaluable for troubleshooting. - -#### Dynamic tabs - -If you open a [new dashboard](/docs/dashboards-and-charts/dashboards-tab.md), jump to a single-node dashboard, or navigate to a dedicated alert page, a new tab will open in War Room bar. - -Tabs can be rearranged with drag-and-drop or closed with the **X** button. Open tabs persist between sessions, so you can always come right back to your preferred setup. - -### Drill down to specific nodes - -Both the Overview and the Nodes tab offer easy access to **single-node dashboards** for targeted analysis. You can use -single-node dashboards in Netdata Cloud to drill down on specific issues, scrub backward in time to investigate -historical data, and see like metrics presented meaningfully to help you troubleshoot performance problems. - -Learn more about [interacting with -dashboards and charts](/docs/dashboards-and-charts/netdata-charts.md) to get the most from all of Netdata's real-time -metrics. - -### Create new dashboards - -You can use Netdata Cloud to create new dashboards that match your infrastructure's topology or help you diagnose -complex issues by aggregating correlated charts from any number of nodes. For example, you could monitor the system CPU -from every node in your infrastructure on a single dashboard. - -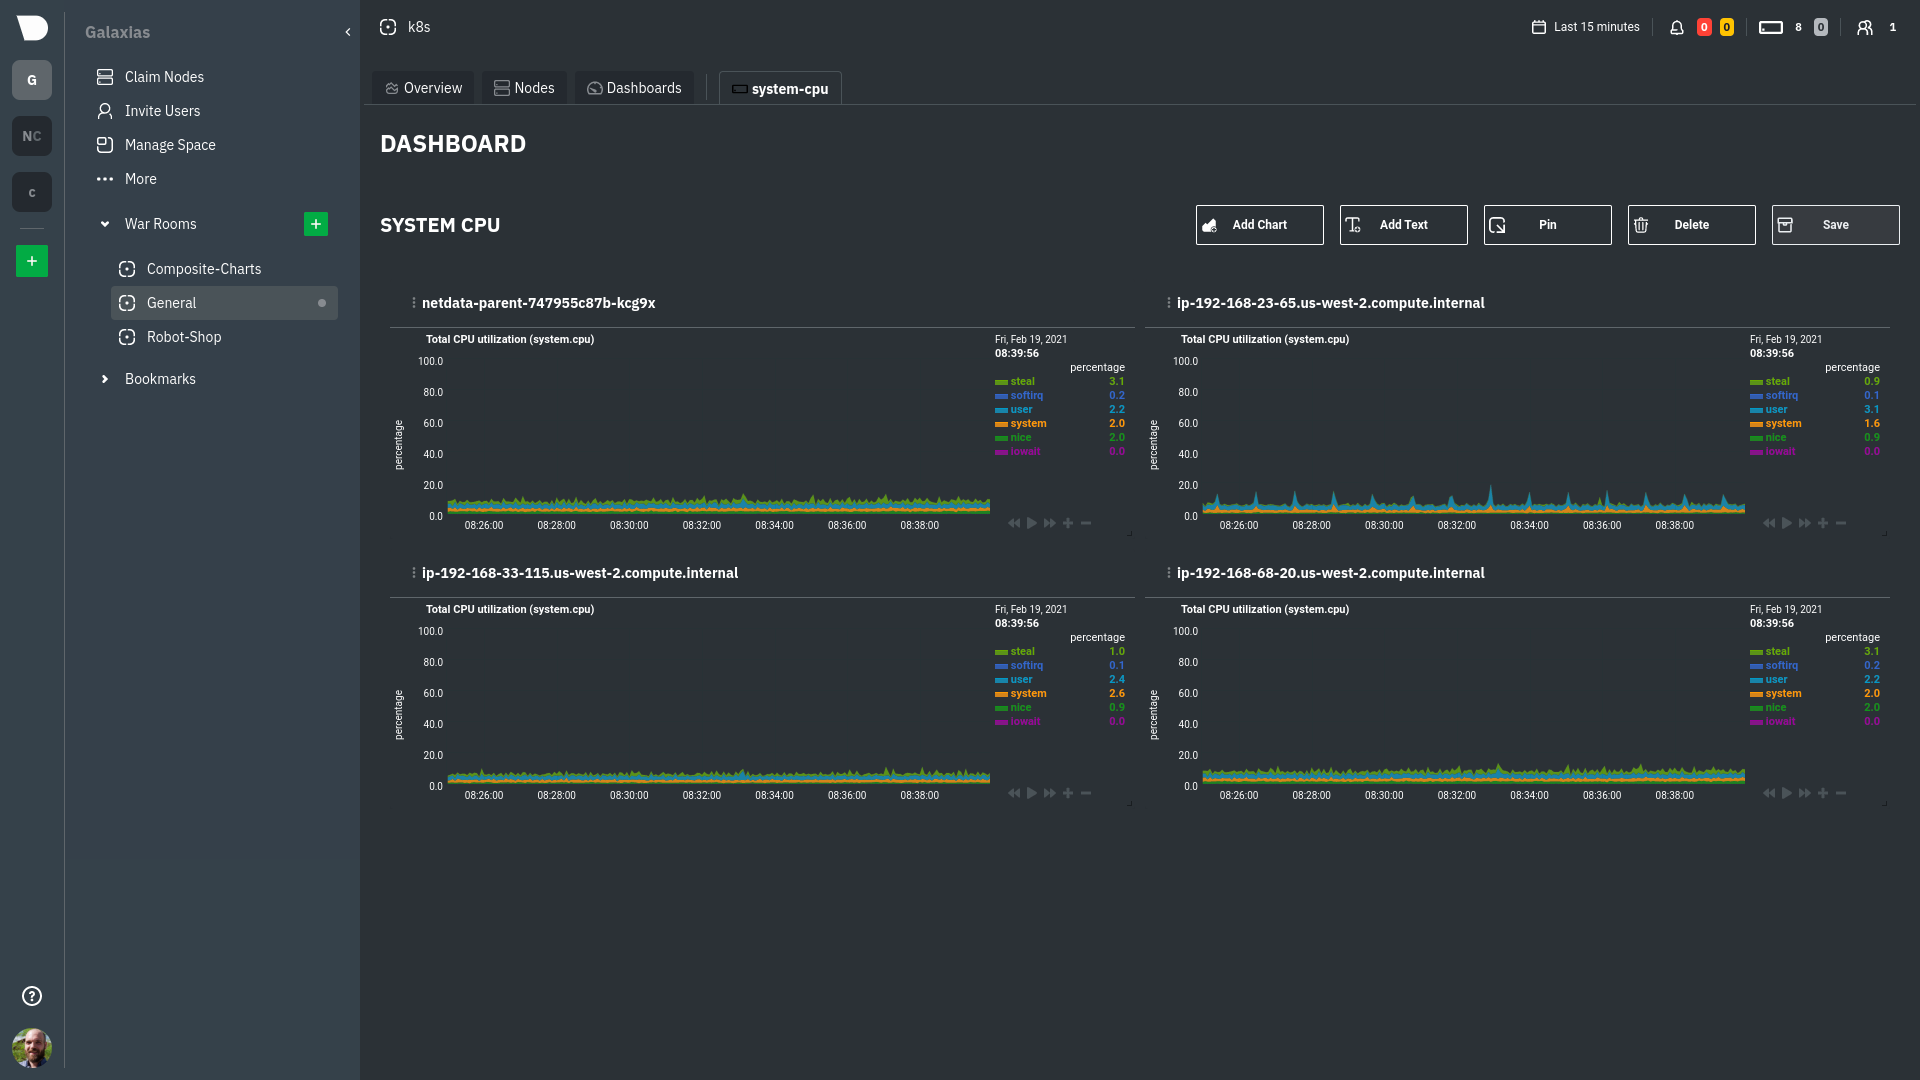 - -Read more about [creating new dashboards](/docs/dashboards-and-charts/dashboards-tab.md) for more details about the process and -additional tips on best leveraging the feature to help you troubleshoot complex performance problems. - -## Set up your nodes - -You get the most value out of Netdata Cloud's infrastructure monitoring capabilities if each node collects every -possible metric. For example, if a node in your infrastructure is responsible for serving a MySQL database, you should -ensure that the Netdata Agent on that node is properly collecting and streaming all MySQL-related metrics. - -In most cases, collectors autodetect their data source and require no configuration, but you may need to configure -certain behaviors based on your infrastructure. Or, you may want to enable/configure advanced functionality, such as -longer metrics retention or streaming. - -### Configure the Netdata Agent on your nodes - -You can configure any node in your infrastructure if you need to, although most users will find the default settings -work extremely well for monitoring their infrastructures. - -Each node has a configuration file called `netdata.conf`, which is typically at `/etc/netdata/netdata.conf`. The best -way to edit this file is using the `edit-config` script, which ensures updates to the Netdata Agent do not overwrite -your changes. For example: - -```bash -cd /etc/netdata -sudo ./edit-config netdata.conf -``` - -Our [configuration basics doc](/docs/netdata-agent/configuration/README.md) contains more information about `netdata.conf`, `edit-config`, -along with simple examples to get you familiar with editing your node's configuration. - -After you've learned the basics, you should [secure your infrastructure's nodes](/docs/security-and-privacy-design/README.md) using -one of our recommended methods. These security best practices ensure no untrusted parties gain access to the metrics -collected on any of your nodes. - -### Collect metrics from anywhere - -Netdata has [300+ pre-installed collectors](/src/collectors/COLLECTORS.md) that gather thousands of metrics with zero configuration. Collectors search each of your nodes in default locations and ports to find running applications and gather as many metrics as they can without you having to configure them individually. - -Check our [comprehensive integrations section](/src/collectors/COLLECTORS.md), to find information about whatever you want to monitor with Netdata - -## Netdata Cloud features - -<Grid columns="2"> - <Box - title="Spaces and War Rooms"> - <BoxList> - <BoxListItemRegexLink to="[](/docs/netdata-cloud/organize-your-infrastructure-invite-your-team.md#netdata-cloud-spaces)" title="Spaces" /> - <BoxListItemRegexLink to="[](/docs/netdata-cloud/organize-your-infrastructure-invite-your-team.md#netdata-cloud-war-rooms)" title="War Rooms" /> - </BoxList> - </Box> - <Box - title="Dashboards"> - <BoxList> - <BoxListItemRegexLink to="[](/docs/dashboards-and-charts/metrics-tab-and-single-node-tabs.md)" title="Metrics tab" /> - <BoxListItemRegexLink to="[](/docs/dashboards-and-charts/nodes-tab.md)" title="Nodes tab" /> - <BoxListItemRegexLink to="[](/docs/dashboards-and-charts/kubernetes-tab.md)" title="Kubernetes" /> - <BoxListItemRegexLink to="[](/docs/dashboards-and-charts/dashboards-tab.md)" title="Create new dashboards" /> - </BoxList> - </Box> - <Box - title="Alerts and notifications"> - <BoxList> - <BoxListItemRegexLink to="[](/docs/dashboards-and-charts/alerts-tab.md#netdata-cloud)" title="View active alerts" /> - <BoxListItemRegexLink to="[](/docs/alerts-and-notifications/notifications/centralized-cloud-notifications/centralized-cloud-notifications-reference.md)" title="Alert notifications" /> - </BoxList> - </Box> - <Box - title="Troubleshooting with Netdata Cloud"> - <BoxListItemRegexLink to="[](/docs/metric-correlations.md)" title="Metric Correlations" /> - <BoxListItemRegexLink to="[](/docs/dashboards-and-charts/anomaly-advisor-tab.md)" title="Anomaly Advisor" /> - <BoxListItemRegexLink to="[](/docs/dashboards-and-charts/events-feed.md)" title="Events Feed" /> - </Box> - <Box - title="Management and settings"> - <BoxList> - <BoxListItemRegexLink to="[](/docs/netdata-cloud/authentication-and-authorization/README.md)" title="Sign in with email, Google, GitHub or with an SSO tool" /> - <BoxListItemRegexLink to="[](/docs/netdata-cloud/organize-your-infrastructure-invite-your-team.md#invite-your-team)" title="Invite your team" /> - <BoxListItemRegexLink to="[](/docs/dashboards-and-charts/themes.md)" title="Choose your Netdata Cloud theme" /> - <BoxListItemRegexLink to="[](/docs/netdata-cloud/authentication-and-authorization/role-based-access-model.md)" title="Role-Based Access" /> - <BoxListItemRegexLink to="[](/docs/netdata-cloud/netdata-subscription-plans.md)" title="Paid Plans" /> - </BoxList> - </Box> -</Grid> - -- Spaces and War Rooms - - [Spaces](/docs/netdata-cloud/organize-your-infrastructure-invite-your-team.md#netdata-cloud-spaces) - - [War Rooms](/docs/netdata-cloud/organize-your-infrastructure-invite-your-team.md#netdata-cloud-war-rooms) -- Dashboards - - [Metrics tab](/docs/dashboards-and-charts/metrics-tab-and-single-node-tabs.md) - - [Nodes tab](/docs/dashboards-and-charts/nodes-tab.md) - - [Kubernetes](/docs/dashboards-and-charts/kubernetes-tab.md) - - [Create new dashboards](/docs/dashboards-and-charts/dashboards-tab.md) -- Alerts and notifications - - [View active alerts](/docs/dashboards-and-charts/alerts-tab.md#netdata-cloud) - - [Alert notifications](/docs/alerts-and-notifications/notifications/centralized-cloud-notifications/centralized-cloud-notifications-reference.md) -- Troubleshooting with Netdata Cloud - - [Metric Correlations](/docs/metric-correlations.md) - - [Anomaly Advisor](/docs/dashboards-and-charts/anomaly-advisor-tab.md) - - [Events Feed](/docs/dashboards-and-charts/events-feed.md) -- Management and settings - - [Sign in with email, Google, GitHub or with an SSO tool](/docs/netdata-cloud/authentication-and-authorization/README.md) - - [Invite your team](/docs/netdata-cloud/organize-your-infrastructure-invite-your-team.md#invite-your-team) - - [Choose your Netdata Cloud theme](/docs/dashboards-and-charts/themes.md) - - [Role-Based Access](/docs/netdata-cloud/authentication-and-authorization/role-based-access-model.md) - - [Paid Plans](/docs/netdata-cloud/netdata-subscription-plans.md) diff --git a/docs/netdata-cloud/netdata-subscription-plans.md b/docs/netdata-cloud/netdata-subscription-plans.md deleted file mode 100644 index fa9071b213..0000000000 --- a/docs/netdata-cloud/netdata-subscription-plans.md +++ /dev/null @@ -1,42 +0,0 @@ -# Netdata Subscription Plans - -This page explains the Netdata subscription plan structure. - -## Overview - -Netdata offers a **Community plan**, a free SaaS and Open Source Agent, while also it offers paid subscriptions — **Homelab**, **Business**, and **Enterprise On-Premise** — providing key business features and unlimited access to your dashboards. - -For more info visit the [Netdata Cloud Pricing](https://netdata.cloud/pricing) page. - -### Plans - -Each plan is linked to a Space, defining the capabilities and customizations available. Different Spaces can have different plans, offering flexibility based on your needs. - -Netdata Cloud plans (excluding Community) involve: - -- A yearly flat fee for [committed nodes](#committed-nodes) -- An on-demand metered component based on the [number of running nodes](#running-nodes-and-billing) - -Billing options include monthly (pay-as-you-go) and yearly (annual prepayment). For more details, visit [Netdata Cloud Pricing](https://netdata.cloud/pricing). - -## Running Nodes and Billing - -Billing is based on the number of active nodes. We do not charge for offline or stale nodes. We calculate daily and running P90 figures to ensure fair billing by smoothing out sporadic spikes in node activity. - -## Committed Nodes - -Yearly plans require specifying a number of committed nodes, which receive a discounted rate. Usage above these committed nodes incurs charges at the standard rate. - -## Plan Changes and Credit Balance - -You can change your plan, billing frequency, or committed nodes at any time. For guidance, see [updating your plan](/docs/netdata-cloud/view-plan-and-billing.md#update-a-subscription-plan). - -> **Note** -> -> - Changes like downgrades or cancellations keep notification configurations active for 24 hours. After that, any methods not supported by the new plan are disabled. -> - Changes may restrict user access in your Space. Review role availability under [each plan](#areas-that-change-upon-subscription). -> - Any credits are valid until the end of the following year. - -## Areas That Change Upon Subscription - -Please refer to the [Netdata Cloud Pricing](https://netdata.cloud/pricing) page for more information on what each plan provides. diff --git a/docs/netdata-cloud/view-plan-and-billing.md b/docs/netdata-cloud/view-plan-and-billing.md index 3e8e47a2f1..9967310367 100644 --- a/docs/netdata-cloud/view-plan-and-billing.md +++ b/docs/netdata-cloud/view-plan-and-billing.md @@ -1,15 +1,54 @@ -# View Plan & Billing +# Netdata Plans & Billing -This section outlines how to view and manage your Space's plan, billing settings, and usage from the Netdata Cloud interface. +Netdata offers a **Community plan**, a free SaaS and Open Source Agent, and paid subscriptions — **Homelab**, **Business**, and **Enterprise On-Premise** — providing key business features and unlimited access to your dashboards. -## Prerequisites +For more info visit the [Netdata Cloud Pricing](https://netdata.cloud/pricing) page. + +## Plans + +Plans define the features and customization options available within a Space. Different Spaces can have different plans, giving you flexibility based on your needs. + +Netdata Cloud plans (excluding Community) involve: + +- A yearly flat fee for [committed nodes](#committed-nodes) +- An on-demand metered component based on the [number of running nodes](#running-nodes-and-billing) + +Billing options include monthly (pay-as-you-go) and yearly (annual prepayment). + +### Technical Details + +#### Running Nodes and Billing + +Billing is based solely on active nodes, excluding offline or stale instances. Daily and P90 metrics ensure fair pricing by mitigating transient increases in node activity. + +#### Committed Nodes + +Yearly plans offer a discounted rate for a pre-defined number of committed nodes. Any usage exceeding this commitment will be billed at the standard rate. + +#### Plan Changes and Credit Balance + +You can change your plan, billing frequency, or committed nodes at any time. For guidance, see [updating your plan](#update-a-subscription-plan). + +> **Note** +> +> - Changes like downgrades or cancellations keep notification configurations active for 24 hours. After that, any methods not supported by the new plan are disabled. +> - Changes may restrict user access in your Space. Review role availability under [each plan](https://netdata.cloud/pricing). +> - Any credits are valid until the end of the following year. + +#### Areas That Change Upon Subscription + +Please refer to the [Netdata Cloud Pricing](https://netdata.cloud/pricing) page for more information on what each plan provides. + +## View Plan and Billing Information + +### Prerequisites - A Netdata Cloud account - Admin or Billing user access to the Space -## Steps +### Steps -### View Current Plan, Billing Options, and Invoices +#### View Current Plan, Billing Options, and Invoices 1. Navigate to **Space settings** (the cog above your profile icon). 2. Select the **Plan & Billing** tab. @@ -23,7 +62,7 @@ This section outlines how to view and manage your Space's plan, billing settings - The **Change plan** button, showing details of your current plan with options to upgrade or cancel. - Your **Usage chart**, displaying daily and period counts of live nodes and how they relate to your billing. -### Update a Subscription Plan +#### Update a Subscription Plan 1. In the **Plan & Billing** tab, click **Change plan** to see: - Billing frequency and committed nodes (if applicable). |