
diff options
| author | Joel Hans <joel@netdata.cloud> | 2021-05-24 05:38:31 -0700 |
|---|---|---|
| committer | GitHub <noreply@github.com> | 2021-05-24 05:38:31 -0700 |
| commit | 56dfb07605c2e82699779f9597164856cf790250 (patch) | |
| tree | 0a5484c0a5faf83b3b74dc46a440ddf8e23312c8 /docs | |
| parent | 6d6eb08ae4c7a24091d32cc625bfd1d1ad0e2b5d (diff) | |
Fixing sneaky broken links (#11175)
Diffstat (limited to 'docs')
| -rw-r--r-- | docs/configure/nodes.md | 7 | ||||
| -rw-r--r-- | docs/dashboard/customize.mdx | 2 | ||||
| -rw-r--r-- | docs/dashboard/import-export-print-snapshot.mdx | 4 | ||||
| -rw-r--r-- | docs/guides/deploy/ansible.md | 6 | ||||
| -rw-r--r-- | docs/guides/monitor/statsd.md | 5 | ||||
| -rw-r--r-- | docs/guides/using-host-labels.md | 2 | ||||
| -rw-r--r-- | docs/monitor/enable-notifications.md | 16 | ||||
| -rw-r--r-- | docs/monitor/view-active-alarms.md | 7 | ||||
| -rw-r--r-- | docs/overview/what-is-netdata.md | 6 |
9 files changed, 29 insertions, 26 deletions
diff --git a/docs/configure/nodes.md b/docs/configure/nodes.md index a721c73c45..8399e89d9e 100644 --- a/docs/configure/nodes.md +++ b/docs/configure/nodes.md @@ -18,9 +18,10 @@ anomaly, or change in infrastructure affects how their Agents should perform. ## The Netdata config directory -On most Linux systems, using our [recommended one-line installation](/docs/get/README.md#install-the-netdata-agent), the -**Netdata config directory** is `/etc/netdata/`. The config directory contains several configuration files with the -`.conf` extension, a few directories, and a shell script named `edit-config`. +On most Linux systems, using our [recommended one-line +installation](/docs/get-started.mdx#install-on-linux-with-one-line-installer-recommended), the **Netdata config +directory** is `/etc/netdata/`. The config directory contains several configuration files with the `.conf` extension, a +few directories, and a shell script named `edit-config`. > Some operating systems will use `/opt/netdata/etc/netdata/` as the config directory. If you're not sure where yours > is, navigate to `http://NODE:19999/netdata.conf` in your browser, replacing `NODE` with the IP address or hostname of diff --git a/docs/dashboard/customize.mdx b/docs/dashboard/customize.mdx index f3a8f805aa..2f08f3801c 100644 --- a/docs/dashboard/customize.mdx +++ b/docs/dashboard/customize.mdx @@ -25,7 +25,7 @@ Here are a few popular settings: ### Change chart legend position Find this setting under the **Visual** tab. By default, Netdata places the [legend of -dimensions](/docs/dashboards/charts-dimensions-contexts-families.mdx#dimensions) _below_ charts. Click this toggle to +dimensions](/docs/dashboard/dimensions-contexts-families.mdx#dimensions) _below_ charts. Click this toggle to move the legend to the _right_ of charts. ### Change theme diff --git a/docs/dashboard/import-export-print-snapshot.mdx b/docs/dashboard/import-export-print-snapshot.mdx index b5488914ae..0b9246eb25 100644 --- a/docs/dashboard/import-export-print-snapshot.mdx +++ b/docs/dashboard/import-export-print-snapshot.mdx @@ -13,8 +13,8 @@ paper. Snapshots can be incredibly useful for diagnosing anomalies after they've already happened. Let's say Netdata triggered a warning alarm while you were asleep. In the morning, you can [pick the -timeframe](/docs/dashboards/pick-timeframes.mdx) when the alarm triggered, export a snapshot, and send it to a colleague -for further analysis. +timeframe](/docs/dashboard/select-timeframes.mdx) when the alarm triggered, export a snapshot, and send it to a +colleague for further analysis. Or, send the Netdata team a snapshot of your dashboard when [filing a bug report](https://github.com/netdata/netdata/issues/new?assignees=&labels=bug%2C+needs+triage&template=bug_report.md) on diff --git a/docs/guides/deploy/ansible.md b/docs/guides/deploy/ansible.md index 8298fd00c8..b1afdf3158 100644 --- a/docs/guides/deploy/ansible.md +++ b/docs/guides/deploy/ansible.md @@ -7,9 +7,9 @@ custom_edit_url: https://github.com/netdata/netdata/edit/master/docs/guides/depl # Deploy Netdata with Ansible -Netdata's [one-line kickstart](https://learn.netdata.cloud/docs/get) is zero-configuration, highly adaptable, and -compatible with tons of different operating systems and Linux distributions. You can use it on bare metal, VMs, -containers, and everything in-between. +Netdata's [one-line kickstart](/docs/get-started.mdx) is zero-configuration, highly adaptable, and compatible with tons +of different operating systems and Linux distributions. You can use it on bare metal, VMs, containers, and everything +in-between. But what if you're trying to bootstrap an infrastructure monitoring solution as quickly as possible. What if you need to deploy Netdata across an entire infrastructure with many nodes? What if you want to make this deployment reliable, diff --git a/docs/guides/monitor/statsd.md b/docs/guides/monitor/statsd.md index 120715b19a..a4d06043e0 100644 --- a/docs/guides/monitor/statsd.md +++ b/docs/guides/monitor/statsd.md @@ -22,14 +22,15 @@ In general, the process for creating a StatsD collector can be summarized in 2 s - Run an experiment by sending StatsD metrics to Netdata, without any prior configuration. This will create a chart per metric (called private charts) and will help you verify that everything works as expected from the application side of things. - Make sure to reload the dashboard tab **after** you start sending data to Netdata. -- Create a configuration file for your app using [edit-config](https://learn.netdata.cloud/guides/step-by-step/step-04): `sudo ./edit-config statsd.d/myapp.conf` +- Create a configuration file for your app using [edit-config](/docs/configure/nodes.md): `sudo ./edit-config + statsd.d/myapp.conf` - Each app will have it's own section in the right-hand menu. Now, let's see the above process in detail. ## Prerequisites -- A node with the [Netdata Agent](https://learn.netdata.cloud/docs/get#install-the-netdata-agent) installed. +- A node with the [Netdata](/docs/get-started.mdx) installed. - An application to instrument. For this guide, that will be [k6](https://k6.io/docs/getting-started/installation). ## Understanding the metrics diff --git a/docs/guides/using-host-labels.md b/docs/guides/using-host-labels.md index 6d4af2e5da..79558dd169 100644 --- a/docs/guides/using-host-labels.md +++ b/docs/guides/using-host-labels.md @@ -27,7 +27,7 @@ sudo ./edit-config netdata.conf ``` Create a new `[host labels]` section defining a new host label and its value for the system in question. Make sure not -to violate any of the [host label naming rules](/docs/configuration-guide.md#netdata-labels). +to violate any of the [host label naming rules](/docs/configure/common-changes.md#organize-nodes-with-host-labels). ```conf [host labels] diff --git a/docs/monitor/enable-notifications.md b/docs/monitor/enable-notifications.md index 68beba53e7..516678a6c4 100644 --- a/docs/monitor/enable-notifications.md +++ b/docs/monitor/enable-notifications.md @@ -25,10 +25,11 @@ response process. ## Netdata Cloud -Netdata Cloud's [centralized alarm notifications](https://learn.netdata.cloud/docs/cloud/monitoring/notifications/) is a -zero-configuration way to get notified when an anomaly or incident strikes any node or application in your -infrastructure. The advantage of using centralized alarm notifications from Netdata Cloud is that you don't have to -worry about configuring each node in your infrastructure. +Netdata Cloud's [centralized alarm +notifications](https://learn.netdata.cloud/docs/cloud/alerts-notifications/notifications) is a zero-configuration way to +get notified when an anomaly or incident strikes any node or application in your infrastructure. The advantage of using +centralized alarm notifications from Netdata Cloud is that you don't have to worry about configuring each node in your +infrastructure. To enable centralized alarm notifications for a Space, click on **Manage Space** in the left-hand menu, then click on the **Notifications** tab. Click the toggle switch next to **E-mail** to enable this notification method. @@ -40,8 +41,9 @@ choose what types of notifications to receive from each War Room. 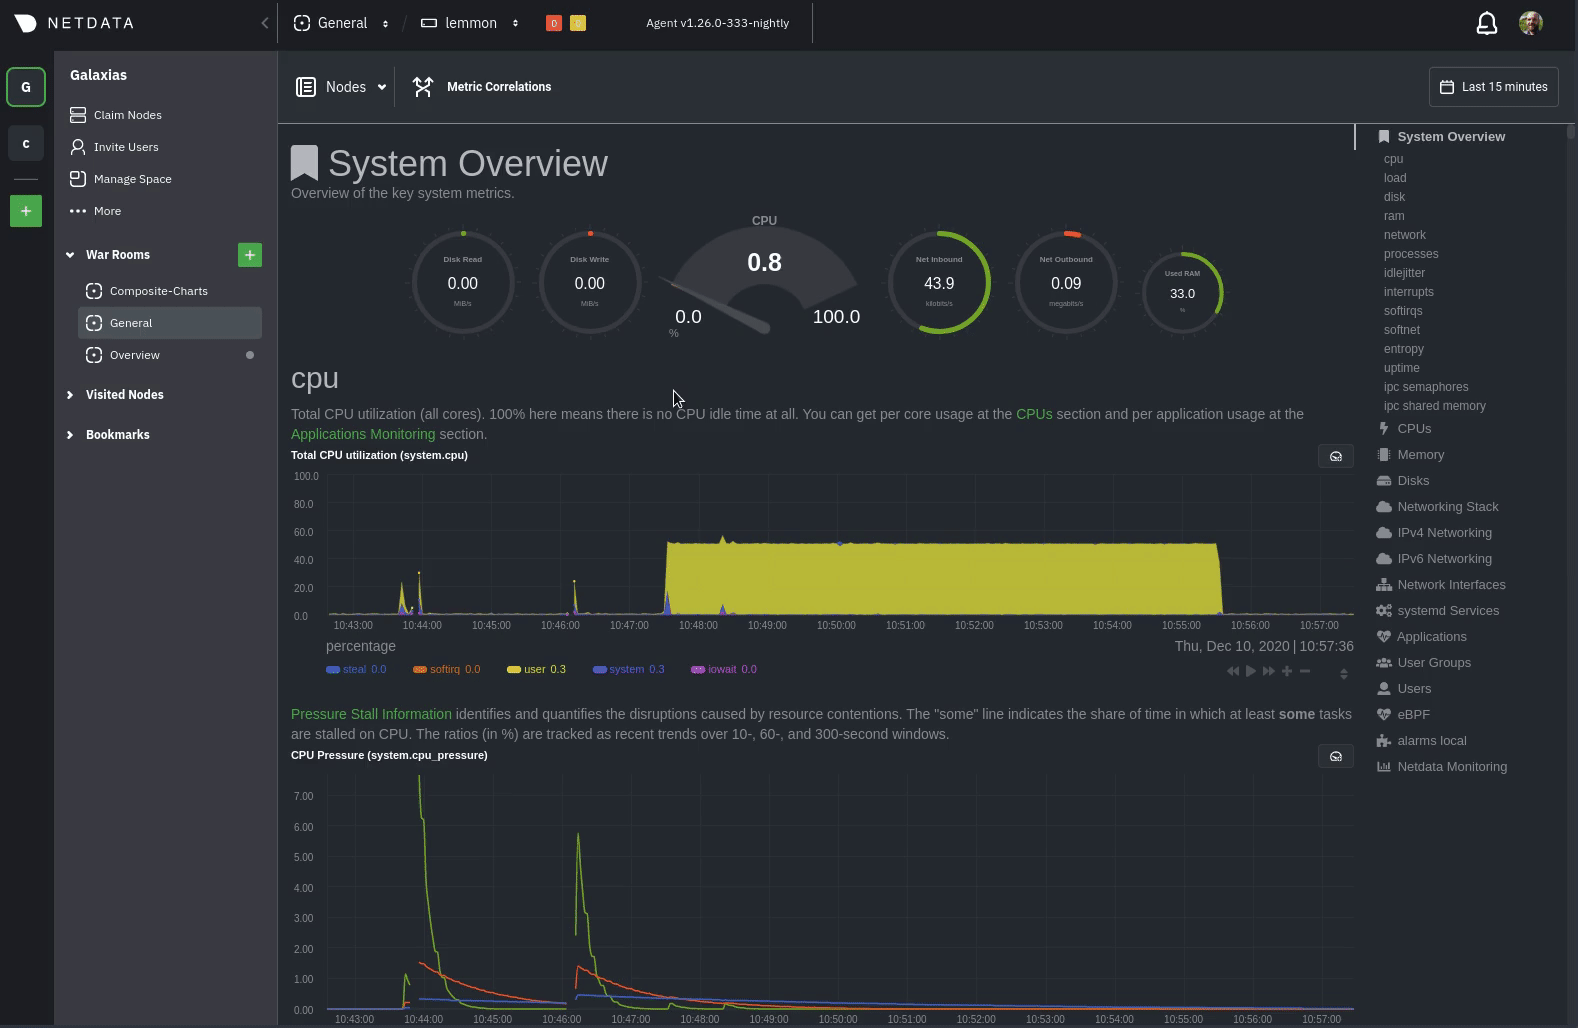 -See the [centralized alarm notifications](https://learn.netdata.cloud/docs/cloud/monitoring/notifications/) reference -doc for further details about what information is conveyed in an email notification, flood protection, and more. +See the [centralized alarm notifications](https://learn.netdata.cloud/docs/cloud/alerts-notifications/notifications) +reference doc for further details about what information is conveyed in an email notification, flood protection, and +more. ## Netdata Agent @@ -138,7 +140,7 @@ architecture](/docs/store/distributed-data-architecture.md) for the best-in-clas ### Related reference documentation -- [Netdata Cloud · Alarm notifications](https://learn.netdata.cloud/docs/cloud/monitoring/notifications/) +- [Netdata Cloud · Alarm notifications](https://learn.netdata.cloud/docs/cloud/alerts-notifications/notifications) - [Netdata Agent · Notifications](/health/notifications/README.md) [](<>) diff --git a/docs/monitor/view-active-alarms.md b/docs/monitor/view-active-alarms.md index b23e2d7212..99169c2c8c 100644 --- a/docs/monitor/view-active-alarms.md +++ b/docs/monitor/view-active-alarms.md @@ -11,9 +11,10 @@ performance issue affects your node or the applications it runs. ## Netdata Cloud -A War Room's [alarms indicator](https://learn.netdata.cloud/docs/cloud/war-rooms#indicators) displays the number of active `critical` (red) and -`warning` (yellow) alerts for the nodes in this War Room. Click on either the critical or warning badges to open a -pre-filtered modal displaying only those types of [active alarms](https://learn.netdata.cloud/docs/cloud/monitoring/alarms). +A War Room's [alarms indicator](https://learn.netdata.cloud/docs/cloud/war-rooms#indicators) displays the number of +active `critical` (red) and `warning` (yellow) alerts for the nodes in this War Room. Click on either the critical or +warning badges to open a pre-filtered modal displaying only those types of [active +alarms](https://learn.netdata.cloud/docs/cloud/alerts-notifications/view-active-alerts). 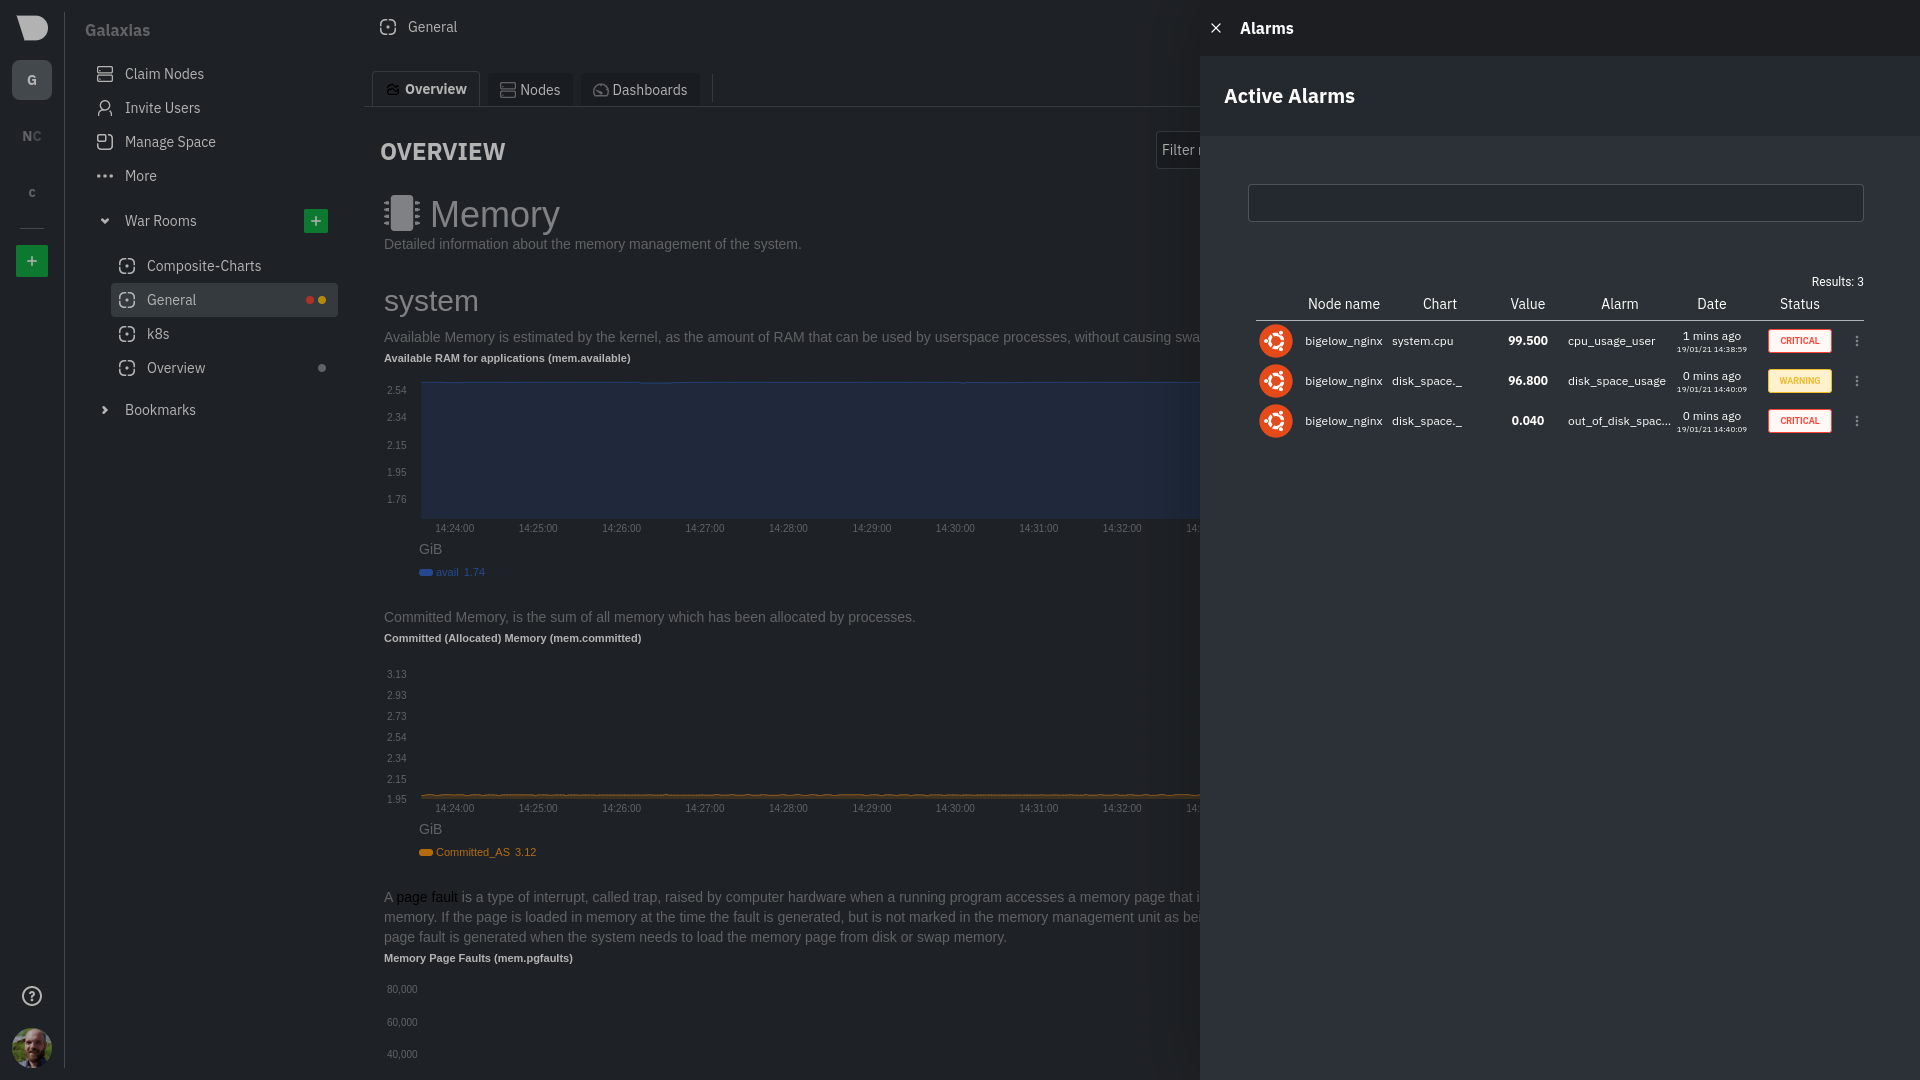 diff --git a/docs/overview/what-is-netdata.md b/docs/overview/what-is-netdata.md index 0a600234c8..37f974ad84 100644 --- a/docs/overview/what-is-netdata.md +++ b/docs/overview/what-is-netdata.md @@ -32,10 +32,8 @@ Cloud, you can view key metrics, insightful charts, and active alarms from all y When an anomaly strikes, seamlessly navigate to any node to troubleshoot and discover the root cause with the familiar Netdata dashboard. -**[Netdata Cloud is -free](https://learn.netdata.cloud/docs/cloud/faq-glossary#how-much-does-netdata-cost-how-and-why-is-it-free)**! You can -add an entire infrastructure of nodes, invite all your colleagues, and visualize any number of metrics, charts, and -alarms entirely for free. +**[Netdata Cloud is free](https://www.netdata.cloud/blog/why-netdata-is-free/)**! You can add an entire infrastructure +of nodes, invite all your colleagues, and visualize any number of metrics, charts, and alarms entirely for free. While Netdata Cloud offers a centralized method of monitoring your Agents, your metrics data is not stored or centralized in any way. Metrics data remains with your nodes and is only streamed to your browser, through Cloud, when |