
diff options
| author | Fotis Voutsas <fotis@netdata.cloud> | 2024-04-30 10:04:52 +0300 |
|---|---|---|
| committer | GitHub <noreply@github.com> | 2024-04-30 10:04:52 +0300 |
| commit | 310253994cffc689cd32bcd7666afd54f520be03 (patch) | |
| tree | 39bb8f52d9263948ca58121df4552d0b061aa87f /docs | |
| parent | dcb51861767320b652904f47647564b9e5f963b9 (diff) | |
refresh the ML documentation and consolidate the two docs (#17543)
* refresh the ML documentation and consolidate the two docs
* ml conf doc
* ml category overview page debloat
* link to AA
* update metrics correlation doc
* Apply suggestions from code review
Co-authored-by: Ilya Mashchenko <ilya@netdata.cloud>
---------
Co-authored-by: Ilya Mashchenko <ilya@netdata.cloud>
Diffstat (limited to 'docs')
| -rw-r--r-- | docs/category-overview-pages/machine-learning-and-assisted-troubleshooting.md | 98 | ||||
| -rw-r--r-- | docs/cloud/insights/metric-correlations.md | 44 |
2 files changed, 15 insertions, 127 deletions
diff --git a/docs/category-overview-pages/machine-learning-and-assisted-troubleshooting.md b/docs/category-overview-pages/machine-learning-and-assisted-troubleshooting.md index 9a0e4b381b..c531f0128b 100644 --- a/docs/category-overview-pages/machine-learning-and-assisted-troubleshooting.md +++ b/docs/category-overview-pages/machine-learning-and-assisted-troubleshooting.md @@ -1,97 +1,7 @@ # Machine Learning and Anomaly Detection -Machine learning (ML) is a subfield of Artificial Intelligence (AI) that enables computers to learn and improve from experience without being explicitly programmed. +Netdata provides a variety of Machine Learning features to help you troubleshoot certain scenarios that might come up. -In observability, machine learning can be used to detect patterns and anomalies in large datasets, enabling users to identify potential issues before they become critical. - -Machine Learning for observability is usually misunderstood, and frequently leads to unrealistic expectations. Check for example the [presentation Google gave at SreCON19](https://www.usenix.org/conference/srecon19emea/presentation/underwood) explaining that all ideas that Google SREs and DevOps came up with, about the use of Machine Learning in observability were bad, and as Todd notes they should feel bad about it. - -At Netdata we are approaching machine learning in a completely different way. Instead of trying to make machine learning do something it cannot achieve, we tried to understand if and what useful insights it can provide and eventually we turned it to an assistant that can improve troubleshooting, reduce mean time to resolution and in many case prevent issues from escalating. - -## Design Principles - -The following are the high level design principles of Machine Learning in Netdata: - -1. **Unsupervised** - - In other words: whatever machine learning can do, it should do it by itself, without any help or assistance from users. - -2. **Real-time** - - We understand that Machine Learning will have some impact on resource utilization, especially in CPU utilization, but it shouldn't prevent Netdata from being real-time and high-fidelity. - -3. **Integrated** - - Everything achieved with machine learning should be tightly integrated to the infrastructure exploration and troubleshooting practices we are used to. - -4. **Assist, Advice, Consult** - - If we can't be sure that a decision made by Machine Learning is 100% accurate, we should use this to assist and consult users in their journey. - - In other words, we don't want to wake up someone at 3 AM, just because a machine learning model detected something. - -## Machine Learning per Time-Series - -Given the samples recently collected for a time-series, Machine Learning is used to detect if a sample just collected is an outlier or not. - -Since the query combinations are infinite, Netdata detects anomalies at the time-series level, and then combines the anomaly rates of all time-series involved in each query, to provide the anomaly rate for the query. - -When a collected sample is an outlier, we set the Anomaly Bit of the collected sample and we store it together with the sample value in the time-series database. - -## Multiple Machine Learning Models per Time-Series to Eliminate Noise - -Unsupervised machine learning has some noise, random false positives. - -To remove this noise, Netdata trains multiple machine learning models for each time-series, covering more than the last 2 days, in total. - -Netdata uses all of the available ML models to detect anomalies. So, all machine learning models of a time-series need to agree that a collected sample is an outlier, for it to be marked as an anomaly. - -This process removes 99% of the false positives, offering reliable unsupervised anomaly detection. - -## Node Level Anomaly - -When a metric becomes anomalous, in many cases a lot other metrics get anomalous too. - -For example, an anomaly on a web server may also introduce unusual network bandwidth, cpu usage, memory consumption, disk I/O, context switches, interrupts, etc. If the web server is serving an API that has an application server and a database server we may see anomalies being propagated to them too. - -To represent the spread of an anomaly in a node, Netdata computes a **Node Level Anomaly**. This is the percentage of the metrics of a node being concurrently anomalous, vs the total number of metrics of that node. - -## Node Anomaly Events - -Netdata produces a "node anomaly event" when a the percentage of concurrently anomalous time-series is high enough and persists over time. - -This anomaly event signals that there was sufficient evidence among all the time-series that some strange behavior might have been detected in a more global sense across the node. - -## What is the Anomaly Bit? - -Each sample collected, carries an Anomaly Bit. This bit (true/false) is set when the collected sample found to be an outlier, based on the machine learning models available for it so far. - -This bit is embedded into the custom floating point number the Netdata database uses, so it does not introduce any overheads in memory or disk footprint. - -The query engine of Netdata uses this bit to compute anomaly rates while it executes normal time-series queries. This eliminates to need for additional queries for anomaly rates, as all `/api/v2` time-series query include anomaly rate information. - -## What is the Anomaly Rate (AR)? - -The Anomaly Rate of a query, is a percentage, representing the number of samples in the query found anomalous, vs the total number of samples participating in the query. - -## How it works - a more technical presentation - -For each time-series Netdata trains every 3 hours, a `k-means clustering` model, using the last 6 hours of samples collected for it. - -Rather than using raw samples of each time-series, the model works on a preprocessed "feature vector" of recent smoothed and differenced values. - -This enables the model to detect a wider range of potentially anomalous patterns as opposed to just point anomalies like big spikes or drops. - -Some of the types of anomalies Netdata detects are: - -1. **Point Anomalies** or **Strange Points**: Single points that represent very big or very small values, not seen before (in some statistical sense). -2. **Contextual Anomalies** or **Strange Patterns**: Not strange points in their own, but unexpected sequences of points, given the history of the time-series. -3. **Collective Anomalies** or **Strange Multivariate Patterns**: Neither strange points nor strange patterns, but in global sense something looks off. -4. **Concept Drifts** or **Strange Trends**: A slow and steady drift to a new state. -5. **Change Point Detection** or **Strange Step**: A shift occurred and gradually a new normal is established. - -For a visual representation, check this infographic: - - - -A more detailed explanation can be found on [this (informal) presentation](https://docs.google.com/presentation/d/18zkCvU3nKP-Bw_nQZuXTEa4PIVM6wppH3VUnAauq-RU/edit#slide=id.p). +- K-means clustering [Machine Learning models](https://github.com/netdata/netdata/blob/master/src/ml/README.md) are trained to power the [Anomaly Advisor](https://github.com/netdata/netdata/blob/master/docs/dashboard/anomaly-advisor-tab.md) on the dashboard, which allows you to identify anomalies in your infrastructure +- [Metric Correlations](https://github.com/netdata/netdata/blob/master/docs/cloud/insights/metric-correlations.md) are possible through the dashboard using the [Two-sample Kolmogorov Smirnov](https://en.wikipedia.org/wiki/Kolmogorov%E2%80%93Smirnov_test#Two-sample_Kolmogorov%E2%80%93Smirnov_test) statistical test and Volume heuristic measures +- The [Netdata Assistant](https://github.com/netdata/netdata/blob/master/docs/cloud/netdata-assistant.md) is able to answer your prompts when it comes to troubleshooting alerts and anomalies. diff --git a/docs/cloud/insights/metric-correlations.md b/docs/cloud/insights/metric-correlations.md index 9ec4da86e9..1acd075b04 100644 --- a/docs/cloud/insights/metric-correlations.md +++ b/docs/cloud/insights/metric-correlations.md @@ -1,36 +1,22 @@ -<!-- -title: "Metric Correlations" -description: "Quickly find metrics and charts closely related to a particular timeframe of interest anywhere in your infrastructure to discover the root cause faster." -custom_edit_url: "https://github.com/netdata/netdata/blob/master/docs/cloud/insights/metric-correlations.md" -sidebar_label: "Metric Correlations" -learn_status: "Published" -learn_topic_type: "Tasks" -learn_rel_path: "Operations" ---> - # Metric Correlations -The Metric Correlations (MC) feature lets you quickly find metrics and charts related to a particular window of interest that you want to explore further. By displaying the standard Netdata dashboard, filtered to show only charts that are relevant to the window of interest, you can get to the root cause sooner. +The Metric Correlations feature lets you quickly find metrics and charts related to a particular window of interest that you want to explore further. + +By displaying the standard Netdata dashboard, filtered to show only charts that are relevant to the window of interest, you can get to the root cause sooner. Because Metric Correlations uses every available metric from your infrastructure, with as high as 1-second granularity, you get the most accurate insights using every possible metric. ## Using Metric Correlations -When viewing the overview or a single-node dashboard, the **Metric Correlations** button appears in the top right corner of the page. - -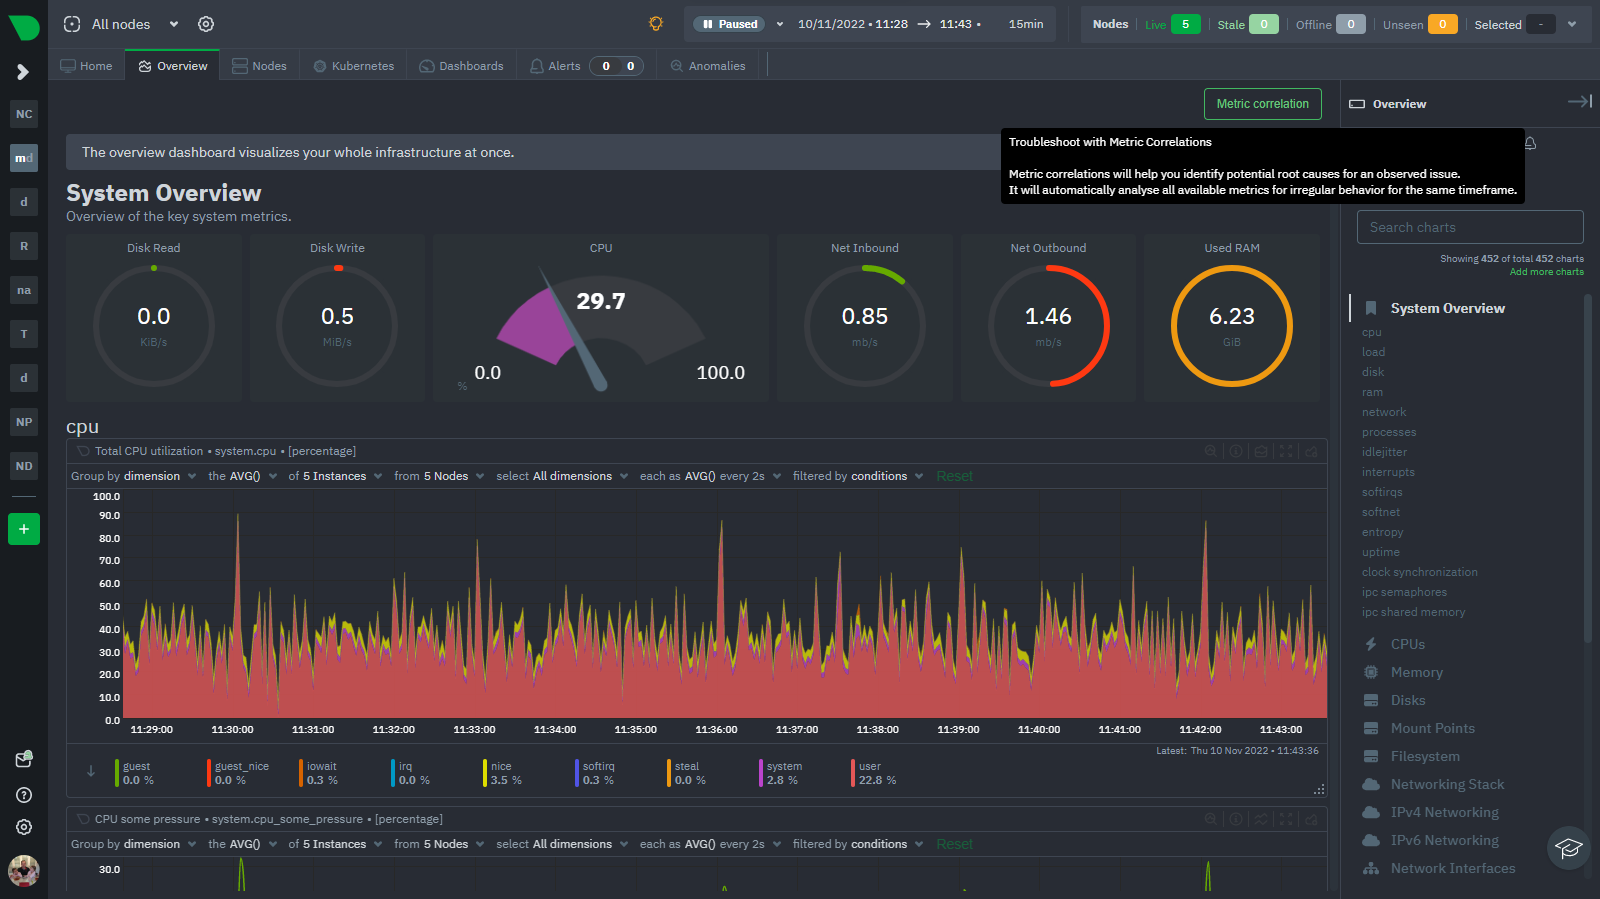 +When viewing the [Metrics tab or a single-node dashboard](https://github.com/netdata/netdata/blob/master/docs/dashboard/metrics-tab-and-single-node-tabs.md), the **Metric Correlations** button appears in the top right corner of the page. -To start correlating metrics, click the **Metric Correlations** button, then hold the `Alt` key (or `⌘` on macOS) and click-and-drag a selection of metrics on a single chart. The selected timeframe needs to be at least 15 seconds for Metric Correlation to work. +To start correlating metrics, click the **Metric Correlations** button, hold the `Alt` key (or `⌘` on macOS), and drag a selection of metrics on a single chart. The selected timeframe needs at least 15 seconds for Metric Correlation to work. The menu then displays information about the selected area and reference baseline. Metric Correlations uses the reference baseline to discover which additional metrics are most closely connected to the selected metrics. The reference baseline is based upon the period immediately preceding the highlighted window and is the length of 4 times the highlighted window. This is to ensure that the reference baseline is always immediately before the highlighted window of interest and a bit longer so as to ensure it's a more representative short term baseline. -Press the **Find Correlations** button to start up the correlations process, the button is only enabled when a valid timeframe is selected (at least 15 seconds). Once pressed, the process will score all available metrics on your nodes and return a filtered version of the Netdata dashboard. Now, you'll see only those metrics that have changed the most between a baseline window and the highlighted window you have selected. - -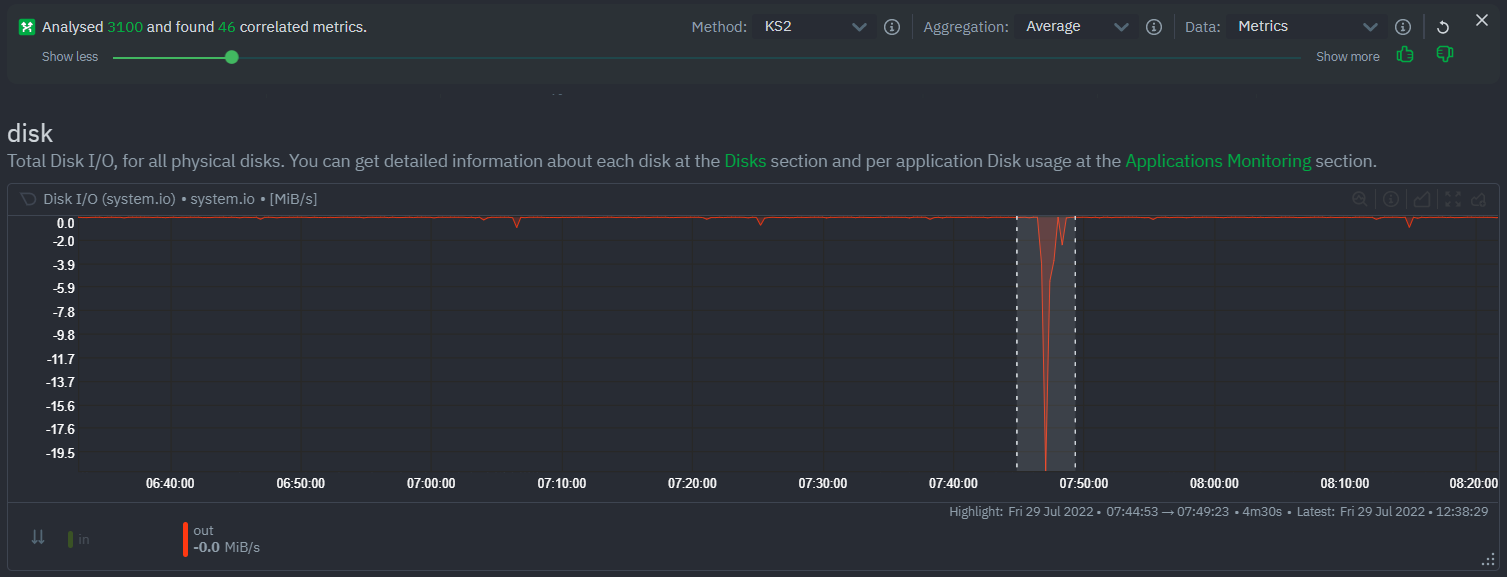 - -These charts are fully interactive, and whenever possible, will only show the _dimensions_ related to the timeline you selected. +Click the **Find Correlations** button to begin the correlation process. This button is only active if a valid timeframe is selected. Once clicked, the process will evaluate all available metrics on your nodes and return a filtered version of the Netdata dashboard. You will now only see the metrics that changed the most between the base window and the highlighted window you selected.. -You can interact with all the scored metrics via the slider. Slide toward **show less** for more nuanced and significant results, or toward **show more** to "loosen" the threshold to explore other charts that may have changed too, but in a less significant manner. +These charts are fully interactive, and whenever possible, will only show the **dimensions** related to the timeline you selected. If you find something else interesting in the results, you can select another window and press **Find Correlations** again to kick the process off again. @@ -53,29 +39,21 @@ Behind the scenes, Netdata will aggregate the raw data as needed such that arbit ### Data -Netdata is different from typical observability agents since, in addition to just collecting raw metric values, it will by default also assign an "[Anomaly Bit](https://github.com/netdata/netdata/tree/master/src/ml#anomaly-bit---100--anomalous-0--normal)" related to each collected metric each second. This bit will be 0 for "normal" and 1 for "anomalous". This means that each metric also natively has an "[Anomaly Rate](https://github.com/netdata/netdata/tree/master/src/ml#anomaly-rate---averageanomaly-bit)" associated with it and, as such, MC can be run against the raw metric values or their corresponding anomaly rates. +Unlike other observability agents that only collect raw metrics, Netdata also assigns an [Anomaly Bit](https://github.com/netdata/netdata/tree/master/src/ml#anomaly-bit) in real-time. This bit flags whether a metric is within normal ranges (0) or deviates significantly (1). This built-in anomaly detection allows for the analysis of both the raw data and the anomaly rates. **Note**: Read more [here](https://github.com/netdata/netdata/blob/master/src/ml/README.md) to learn more about the native anomaly detection features within netdata. - `Metrics` - Run MC on the raw metric values. - `Anomaly Rate` - Run MC on the corresponding anomaly rate for each metric. -## Metric Correlations on the agent - -As of `v1.35.0` Netdata is able to run the Metric Correlations algorithm ([Two Sample Kolmogorov-Smirnov test](https://en.wikipedia.org/wiki/Kolmogorov%E2%80%93Smirnov_test#Two-sample_Kolmogorov%E2%80%93Smirnov_test)) on the agent itself. This avoids sending the underlying raw data to the original Netdata Cloud based microservice and so typically will be much much faster as no data moves around and the computation happens instead on the agent. +## Metric Correlations on the Agent When a Metric Correlations request is made to Netdata Cloud, if any node instances have MC enabled then the request will be routed to the node instance with the highest hops (e.g. a parent node if one is found or the node itself if not). If no node instances have MC enabled then the request will be routed to the original Netdata Cloud based service which will request input data from the nodes and run the computation within the Netdata Cloud backend. -#### Enabling/Disabling Metric Correlations on the agent - -As of `v1.35.0-22-nightly` Metric Correlation has been enabled by default on all agents. After further optimizations to the implementation, the impact of running the metric correlations algorithm on the agent was less than the impact of preparing all the data to send to cloud for MC to run in the cloud, as such running MC on the agent is less impactful on local resources than running via cloud. - -Should you still want to, disabling nodes for Metric Correlation on the agent is a simple one line config change. Just set `enable metric correlations = no` in the `[global]` section of `netdata.conf` - -## Usage tips! +## Usage tips - When running Metric Correlations from the [Metrics tab](docs/dashboard/metrics-tab-and-single-node-tabs.md) across multiple nodes, you might find better results if you iterate on the initial results by grouping by node to then filter to nodes of interest and rerun the Metric Correlations. So a typical workflow in this case would be to: - - If unsure which nodes you are interested in then run MC on all nodes. + - If unsure which nodes you are interested in then run MC on all nodes. - Within the initial results returned group the most interesting chart by node to see if the changes are across all nodes or a subset of nodes. - If you see a subset of nodes clearly jump out when you group by node, then filter for just those nodes of interest and run the MC again. This will result in less aggregation needing to be done by Netdata and so should help give clearer results as you interact with the slider. - Use the `Volume` algorithm for metrics with a lot of gaps (e.g. request latency when there are few requests), otherwise stick with `KS2` |