
diff options
| author | Joel Hans <joel@netdata.cloud> | 2021-01-07 09:53:10 -0700 |
|---|---|---|
| committer | GitHub <noreply@github.com> | 2021-01-07 09:53:10 -0700 |
| commit | 0bb7a429b619bc68104983691e4f957482630787 (patch) | |
| tree | 040bc96ddd98ac59d7e83235f2babccc01ecb636 /docs/visualize | |
| parent | 3adf54ff452fbe8216b64dfce9c7ec04bc7a270b (diff) | |
Small updates, improvements, and housekeeping to docs (#10405)
* Fix Berkeley mentions
* Add new collectors to list
* Tweak Prometheus/OpenMetrics phrasing
* Fix heading depth in performance guide
* Clarify that exporting starts with Agent start
* Clarify usage of edit-config with new files
* Update images
* service -> systemctl
* Reverse systemctl order
Diffstat (limited to 'docs/visualize')
| -rw-r--r-- | docs/visualize/create-dashboards.md | 17 | ||||
| -rw-r--r-- | docs/visualize/interact-dashboards-charts.md | 6 | ||||
| -rw-r--r-- | docs/visualize/overview-infrastructure.md | 2 |
3 files changed, 13 insertions, 12 deletions
diff --git a/docs/visualize/create-dashboards.md b/docs/visualize/create-dashboards.md index d4bcf71c1f..91a8dccccc 100644 --- a/docs/visualize/create-dashboards.md +++ b/docs/visualize/create-dashboards.md @@ -14,12 +14,14 @@ In the War Room you want to monitor with this dashboard, click on your War Room' Add** button next to **Dashboards**. In the panel, give your new dashboard a name, and click **+ Add**. Click the **Add Chart** button to add your first chart card. From the dropdown, select the node you want to add the -chart from, then the context. Netdata Cloud shows you a preview of the chart before you finish adding it. The **Add -Text** button creates a new card with user-defined text, which you can use to describe or document a particular -dashboard's meaning and purpose. +chart from, then the context. Netdata Cloud shows you a preview of the chart before you finish adding it. -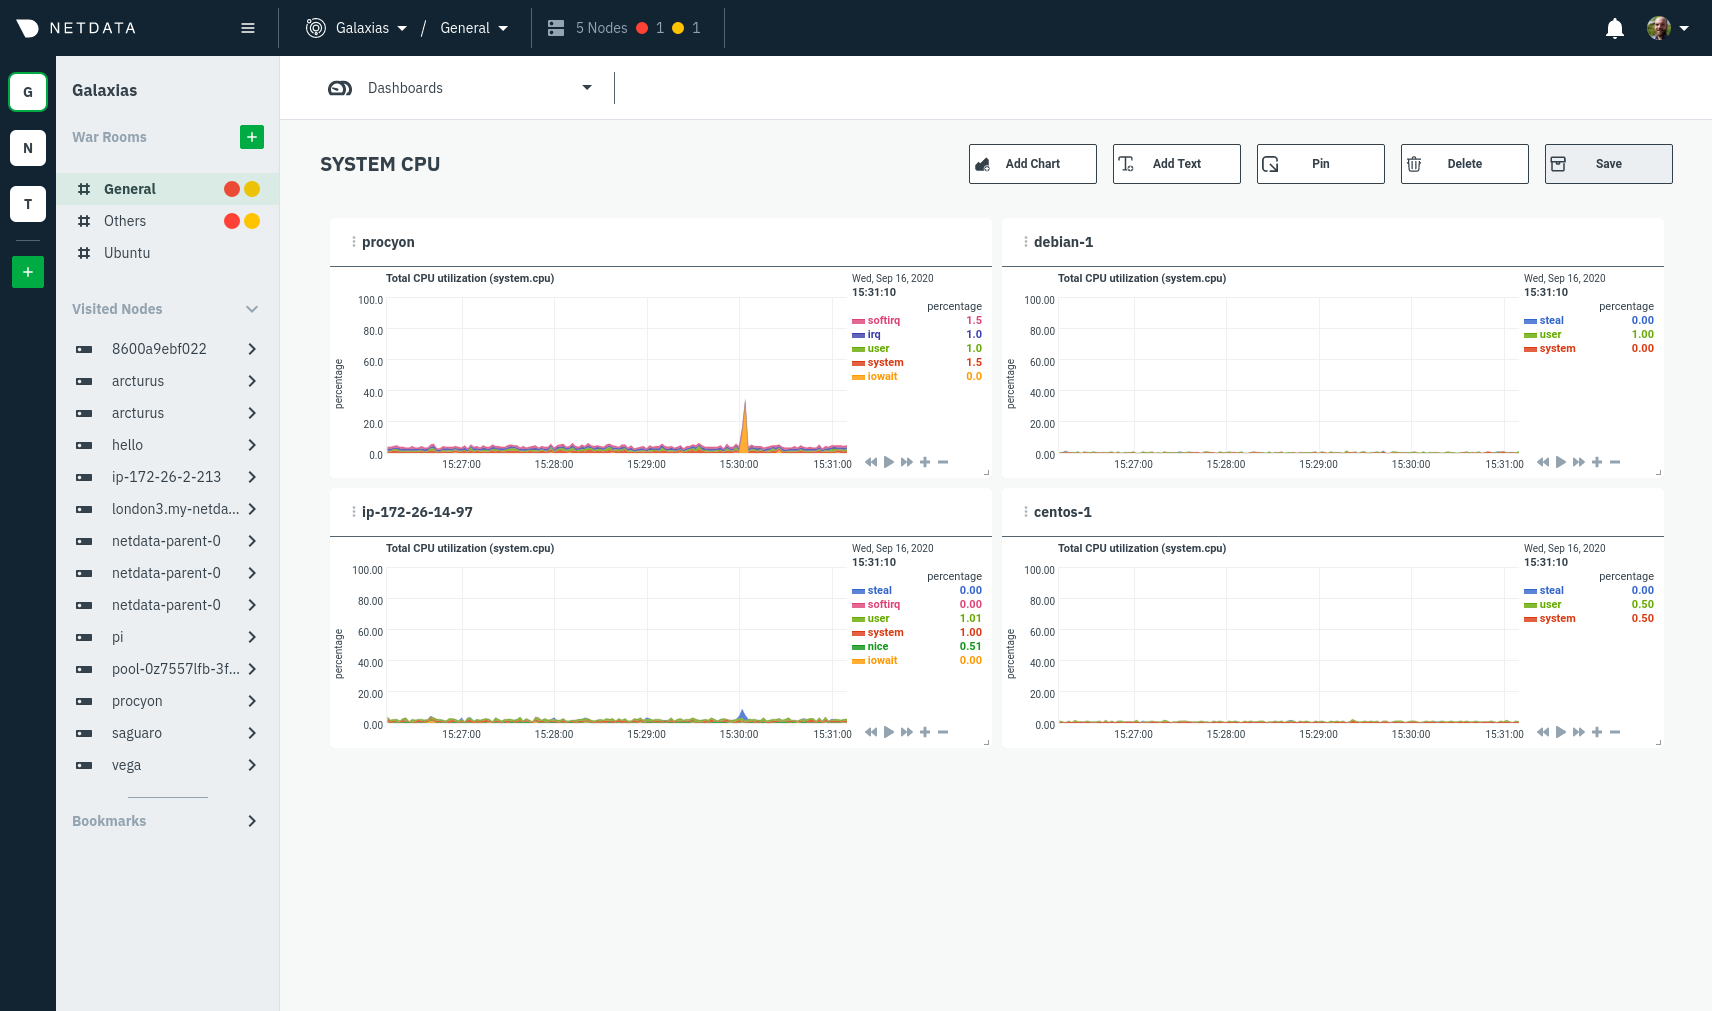 +The **Add Text** button creates a new card with user-defined text, which you can use to describe or document a +particular dashboard's meaning and purpose. Enrich the dashboards you create with documentation or procedures on how to +respond + +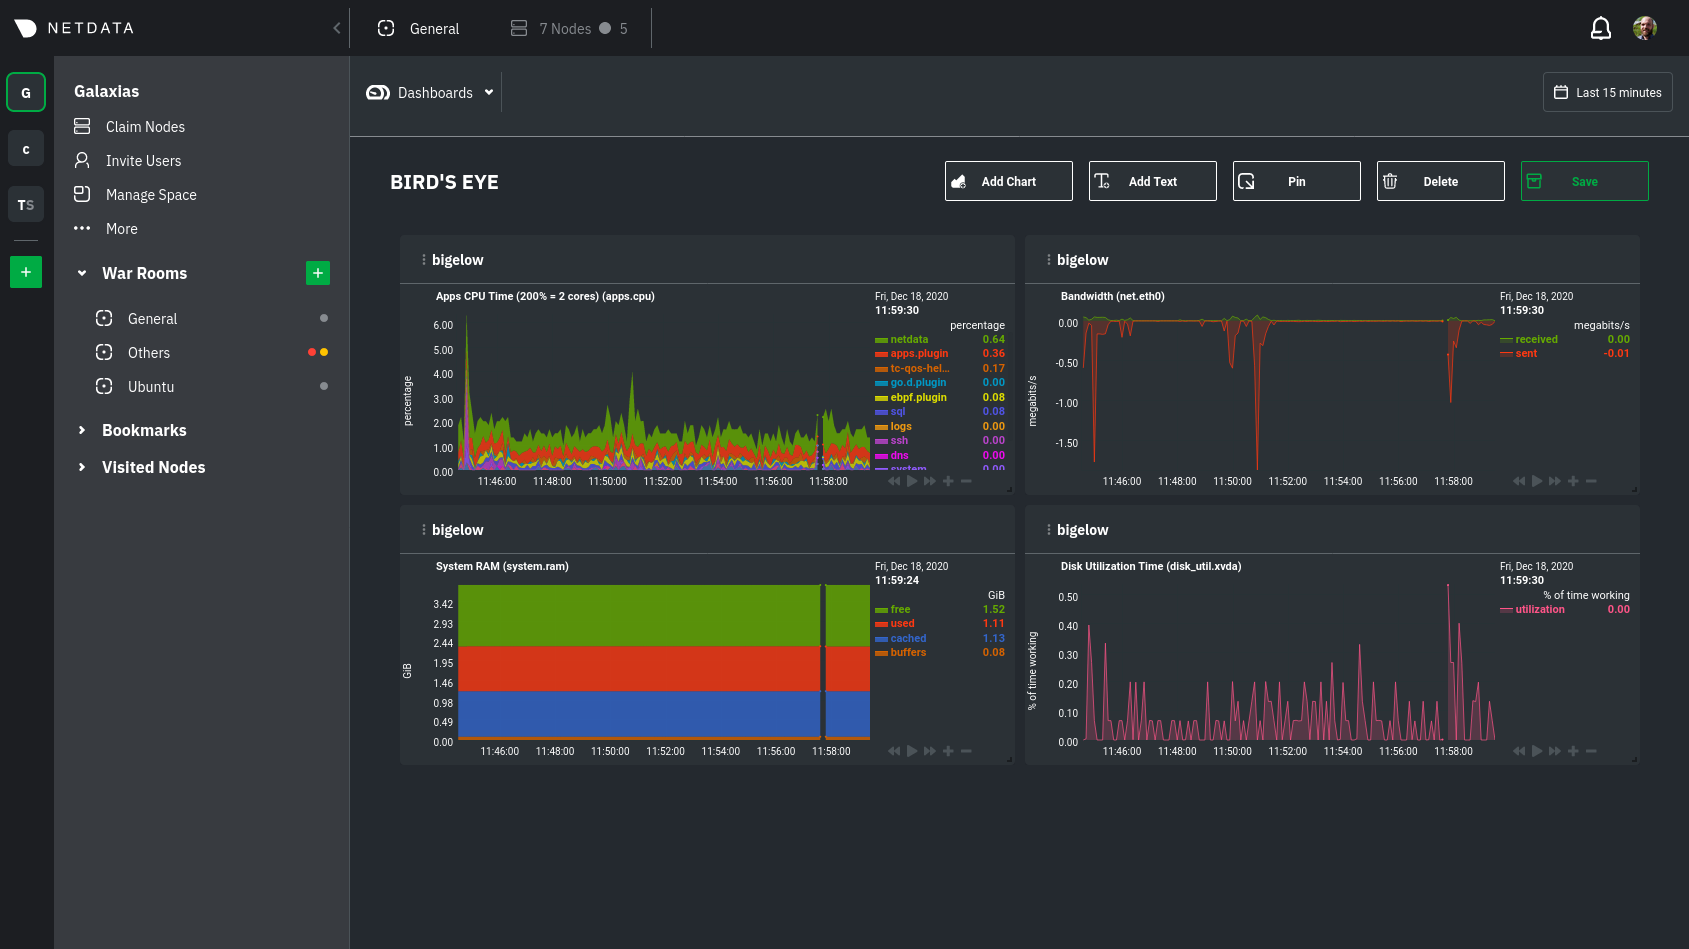 Charts in dashboards are [fully interactive](/docs/visualize/interact-dashboards-charts.md) and synchronized. You can pan through time, zoom, highlight specific timeframes, and more. @@ -41,7 +43,8 @@ complex performance problems. When viewing a single-node Cloud dashboard, you can also click on the add to dashboard icon <img src="https://user-images.githubusercontent.com/1153921/87587846-827fdb00-c697-11ea-9f31-aed0b8c6afba.png" alt="Dashboard -icon" class="image-inline" /> to quickly add that chart to a new or existing dashboard. You might find this useful when investigating an anomaly and want to quickly populate a dashboard with potentially correlated metrics. +icon" class="image-inline" /> to quickly add that chart to a new or existing dashboard. You might find this useful when +investigating an anomaly and want to quickly populate a dashboard with potentially correlated metrics. ## Pin dashboards and navigate through Netdata Cloud @@ -49,8 +52,6 @@ Click on the **Pin** button in any dashboard to put those charts into a separate can now navigate through Netdata Cloud freely, individual Cloud dashboards, the Nodes view, different War Rooms, or even different Spaces, and have those valuable metrics follow you. - - Pinning dashboards helps you correlate potentially related charts across your infrastructure and discover root causes faster. diff --git a/docs/visualize/interact-dashboards-charts.md b/docs/visualize/interact-dashboards-charts.md index dd1d10a9af..30503c2202 100644 --- a/docs/visualize/interact-dashboards-charts.md +++ b/docs/visualize/interact-dashboards-charts.md @@ -83,8 +83,8 @@ Whenever you use a chart in this way, Netdata synchronizes all the other charts | **Zoom** to a specific timeframe | `SHIFT` + `mouse selection` | | | | **Zoom** in/out | `SHIFT`/`ALT` + `mouse scrollwheel` | `SHIFT`/`ALT` + `two-finger pinch` (touchpad/touchscreen) | `SHIFT`/`ALT` + `two-finger scroll` (touchpad/touchscreen) | - + These interactions can also be triggered using the icons on the bottom-right corner of every chart. They are, respectively, `Pan Left`, `Reset`, `Pan Right`, `Zoom In`, and `Zoom Out`. @@ -97,7 +97,7 @@ You can resize any chart by clicking-and-dragging the icon on the bottom-right c to its original height, double-click the same icon.  +height](https://user-images.githubusercontent.com/1153921/102652691-24b25c00-412b-11eb-9e2c-95325fcedc67.gif) ### Composite charts in Netdata Cloud diff --git a/docs/visualize/overview-infrastructure.md b/docs/visualize/overview-infrastructure.md index 63a0bad7fb..675abd745b 100644 --- a/docs/visualize/overview-infrastructure.md +++ b/docs/visualize/overview-infrastructure.md @@ -15,7 +15,7 @@ anomalies, then drill down with filtering or single-node dashboards to see more. each chart visualizes average or sum metrics values from across 5 distributed nodes. 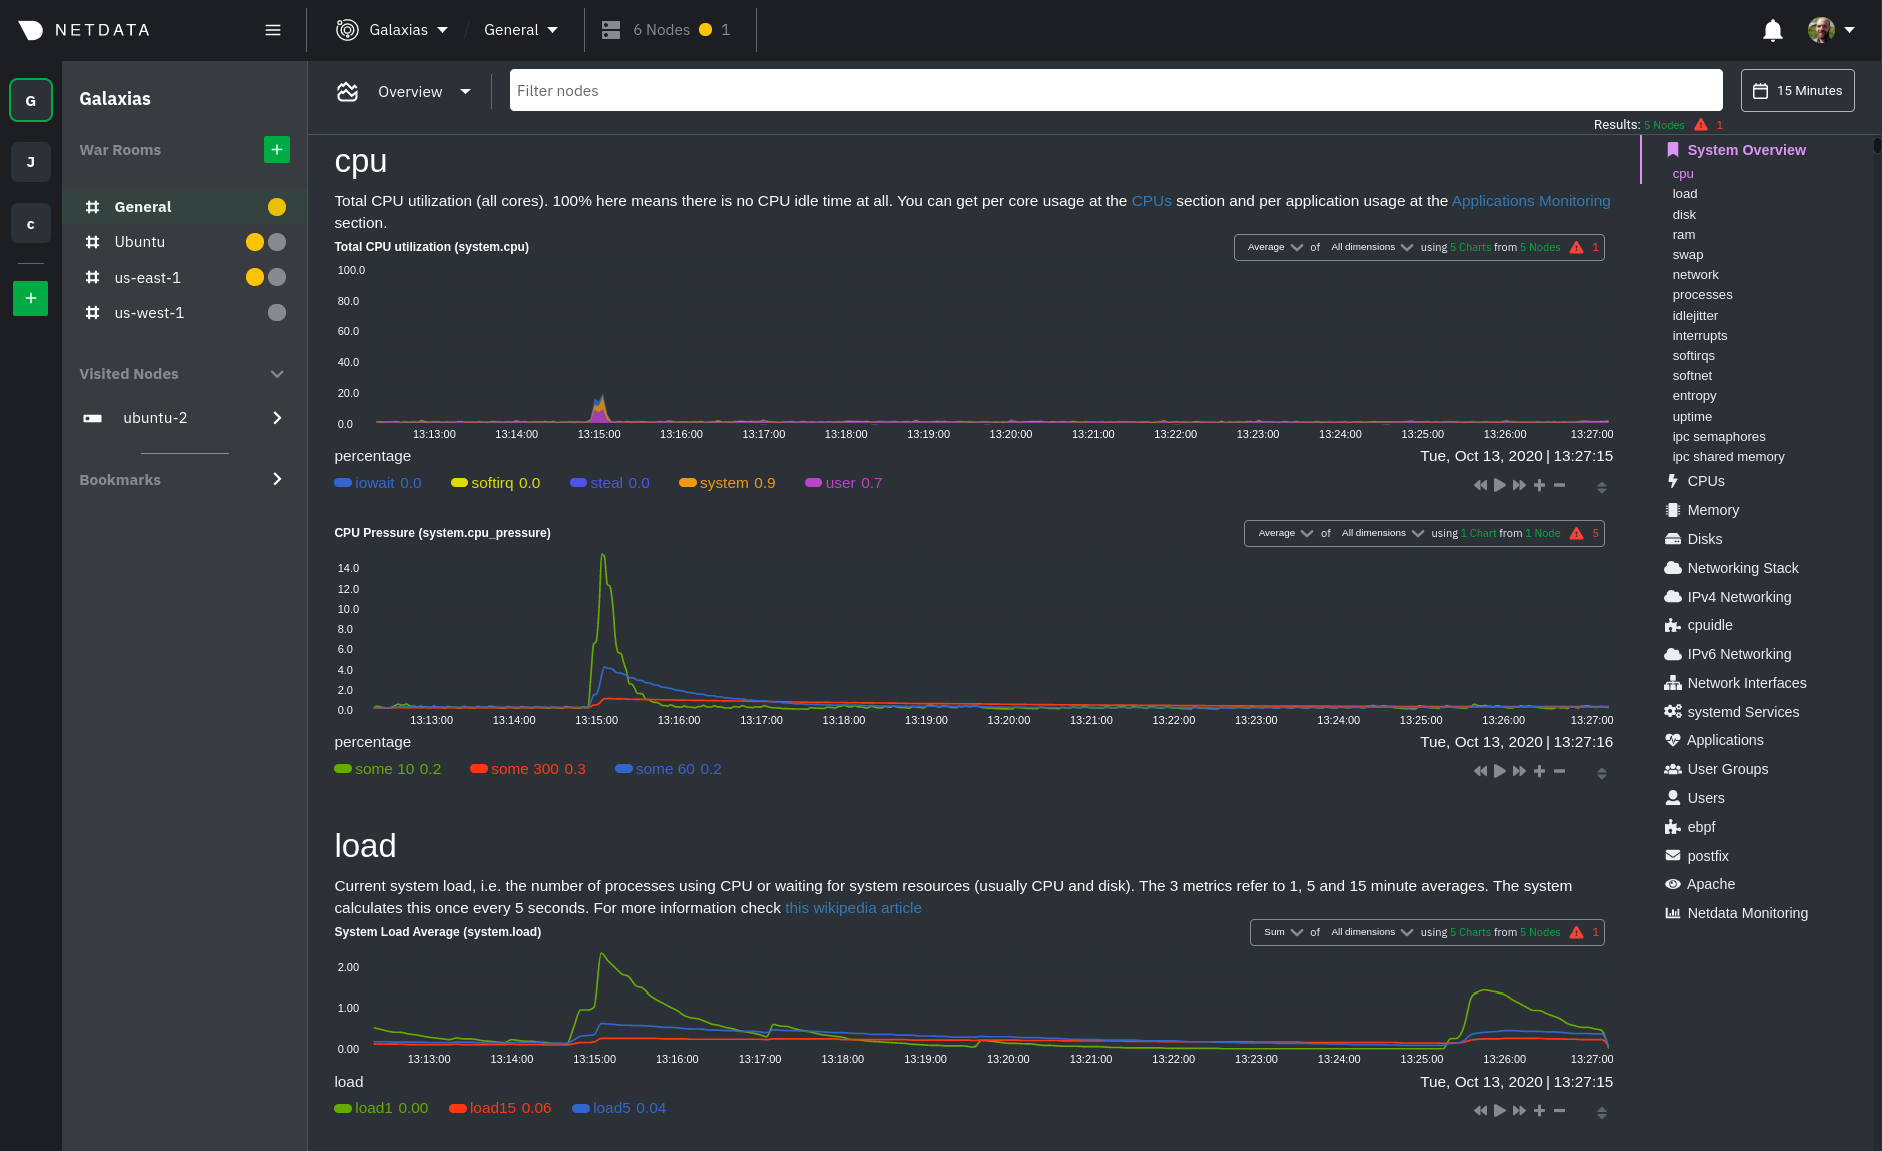 +Overview](https://user-images.githubusercontent.com/1153921/102651377-b1f4b100-4129-11eb-8e60-d2995d258c16.png) ## Using the Overview |