
diff options
| author | Joel Hans <joel@netdata.cloud> | 2020-10-21 05:45:15 -0700 |
|---|---|---|
| committer | GitHub <noreply@github.com> | 2020-10-21 08:45:15 -0400 |
| commit | d0634981533990aa6f4aec2368bb54ef081946be (patch) | |
| tree | 1395f4dc1f0bae518ae589b33b0dea1fe9072c51 /docs/visualize/overview-infrastructure.md | |
| parent | ab0ffcebf802803d1e88f6a5e47a314c292b45e3 (diff) | |
Add documentation for Cloud Overview (#10082)
* First pass on Overview revisions
* Finish up draft of infra doc with Overview
* Rename UI element
* Tweak to Graphite doc
* Copyedit pass
* Fixes for Amy
Diffstat (limited to 'docs/visualize/overview-infrastructure.md')
| -rw-r--r-- | docs/visualize/overview-infrastructure.md | 122 |
1 files changed, 122 insertions, 0 deletions
diff --git a/docs/visualize/overview-infrastructure.md b/docs/visualize/overview-infrastructure.md new file mode 100644 index 0000000000..93783a0968 --- /dev/null +++ b/docs/visualize/overview-infrastructure.md @@ -0,0 +1,122 @@ +<!-- +title: "See an overview of your infrastructure" +description: "With Netdata Cloud's War Rooms, you can see real-time metrics, from any number of nodes in your infrastructure, in composite charts." +custom_edit_url: https://github.com/netdata/netdata/edit/master/docs/visualize/overview-infrastructure.md +--> + +# See an overview of your infrastructure + +In Netdata Cloud, your nodes are organized into War Rooms. One of the two available views for a War Room is the +**Overview**, which uses composite charts to display real-time, aggregated metrics from all the nodes (or a filtered +selection) in a given War Room. + +With Overview's composite charts, you can see your infrastructure from a single pane of glass, discover trends or +anomalies, then drill down with filtering or single-node dashboards to see more. In the screenshot below, +each chart visualizes average or sum metrics values from across 5 distributed nodes. + +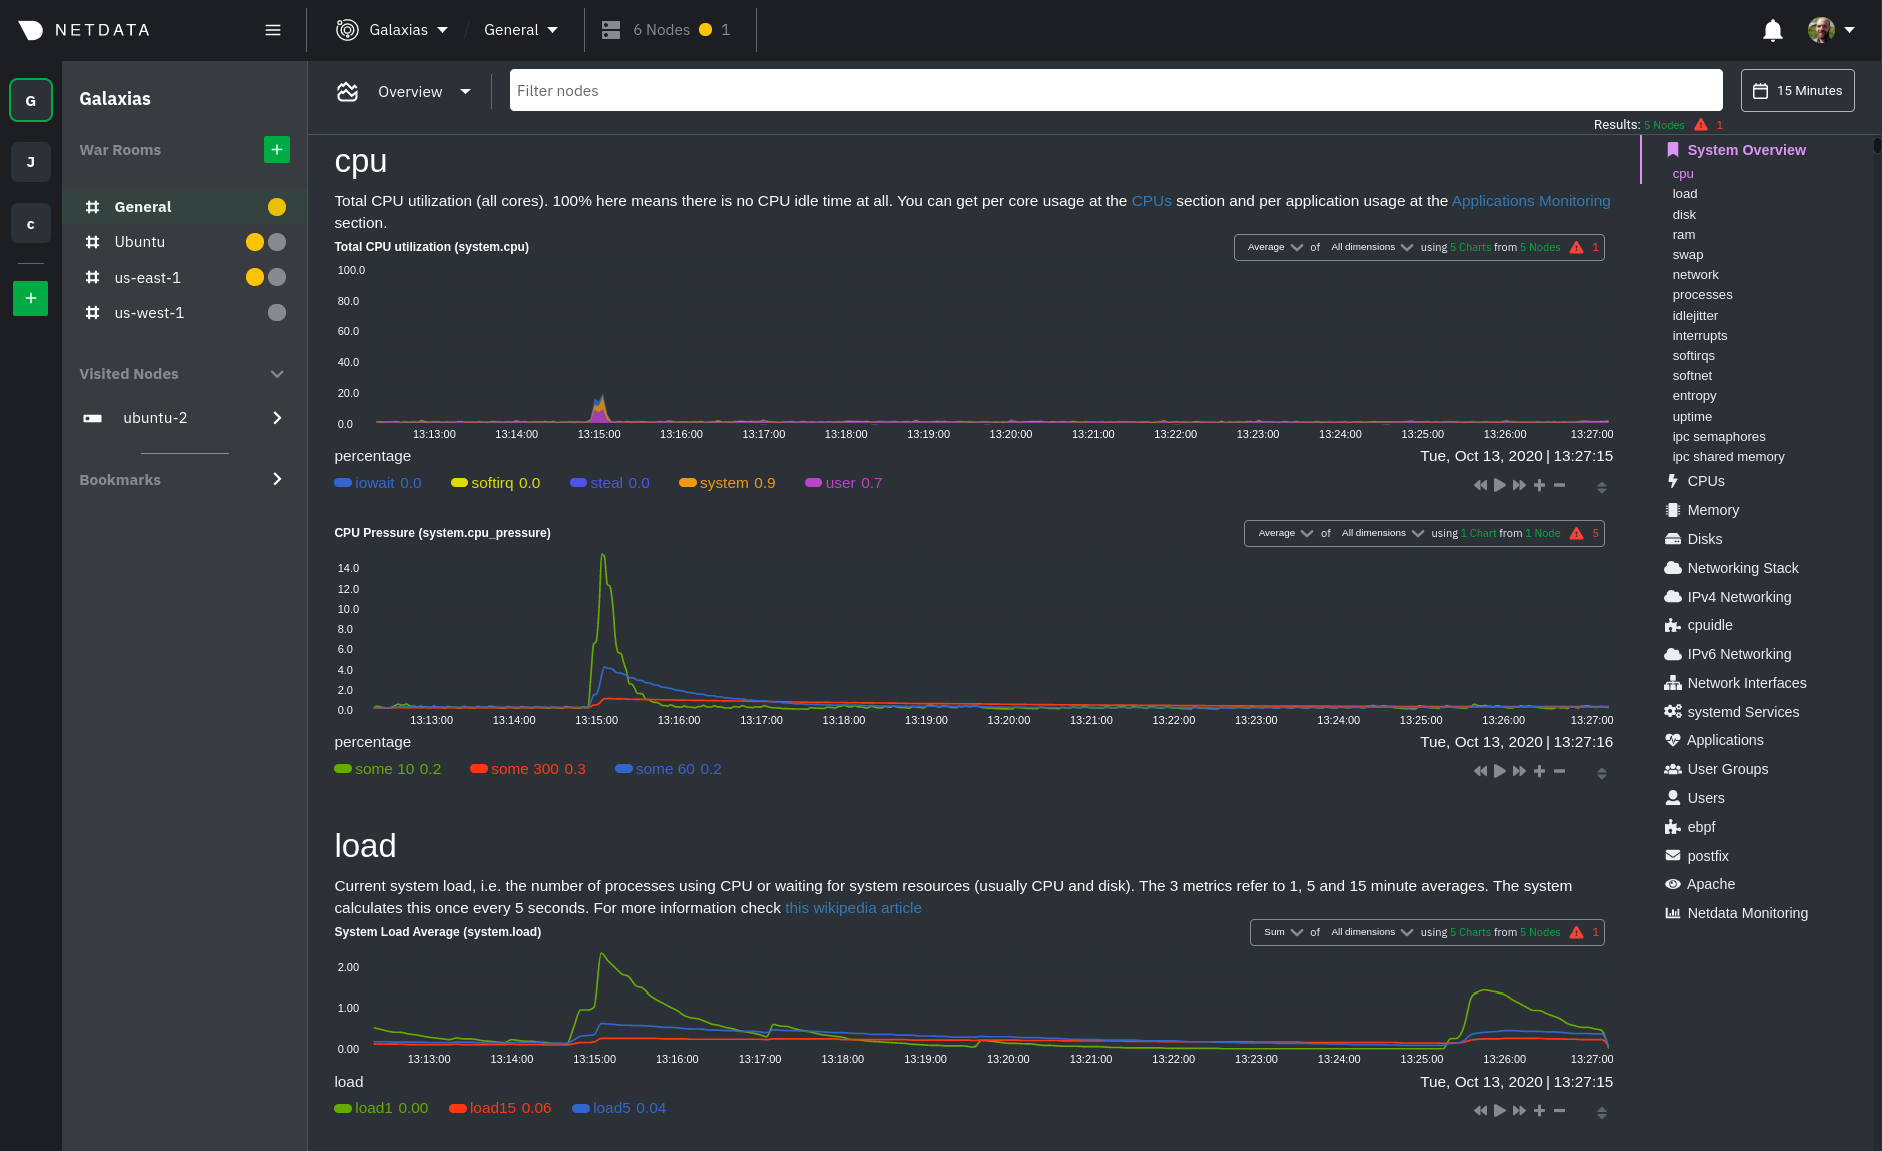 + +## Using the Overview + +> ⚠️ In order for nodes to contribute to composite charts, and thus the Overview UI, they must run v1.26.0 or later of +> the Netdata Agent. See our [update docs](/docs/agent/packaging/installer/update) for the preferred update method based +> on how you installed the Agent. + +The Overview uses roughly the same interface as local Agent dashboards or single-node dashboards in Netdata Cloud. By +showing all available metrics from all your nodes in a single interface, Netdata Cloud helps you visualize the overall +health of your infrastructure. Best of all, you don't have to worry about creating your own dashboards just to get +started with infrastructure monitoring. + +Let's walk through some examples of using the Overview to monitor and troubleshoot your infrastructure. + +### Filter nodes and pick relevant times + +While not exclusive to Overview, you can use two important features, [node +filtering](https://learn.netdata.cloud/docs/cloud/war-rooms#node-filter) and the [time & date +picker](https://learn.netdata.cloud/docs/cloud/war-rooms#time--date-picker), to widen or narrow your infrastructure +monitoring focus. + +By default, the Overview shows composite charts aggregated from every node in the War Room, but you can change that +behavior on an ad-hoc basis. The node filter allows you to create complex queries against your infrastructure based on +the name, OS, or services running on nodes. For example, use `(name contains aws AND os contains ubuntu) OR services == +apache` to show only nodes that have `aws` in the hostname and are Ubuntu-based, or any nodes that have an Apache +webserver running on them. + +The time & date picker helps you visualize both small and large timeframes depending on your goals, whether that's +establishing a baseline of infrastructure performance or targeted root cause analysis of a specific anomaly. + +For example, use the **Quick Selector** options to pick the 12-hour option first thing in the morning to check your +infrastructure for any odd behavior overnight. Use the 7-day option to observe trends between various days of the week. + +See the [War Rooms](https://learn.netdata.cloud/docs/cloud/war-rooms) docs for more details on both features. + +### Configure composite charts to identify problems + +Let's say you notice an interesting spike in disk I/O between `14:42:56` and `14:47:08`. Highlight the anomalous area +using `ALT/⌘ + mouse selection`, then zoom in with `SHIFT + mouse selection` to synchronize all composite charts around +this potentially problematic area. + +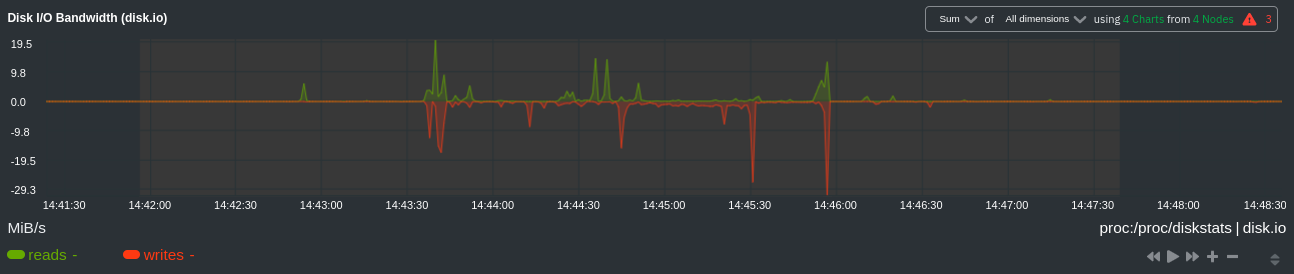 + +By default, the **Disk I/O Bandwidth (disk.io)** composite chart displays the **sum** of all dimensions (`reads` and +`writes`) from all nodes in that War Room. This smart default helps you identify anomalous behavior, but doesn't +necessarily provide the full picture. Let's say you want to understand the severity of disk writes. Use the definition +bar to change the aggregate function to **min** (because the `writes` dimension is on the negative axis), and display +only the `writes` dimension. + +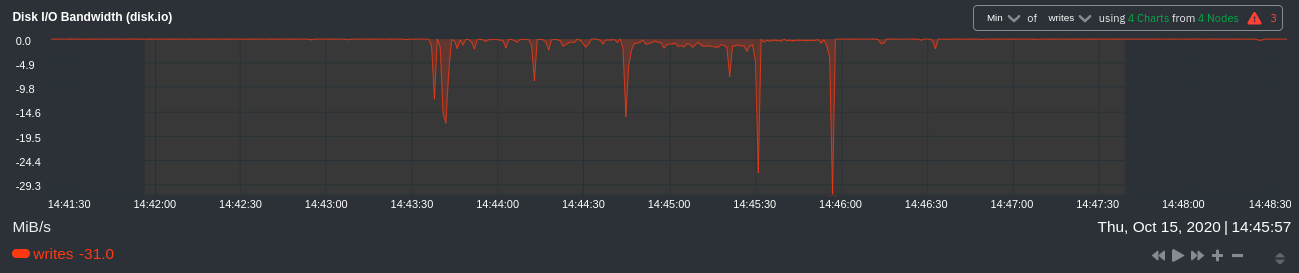 + +Because you're now looking at the largest magnitude of change on your infrastructure, you know a single node experienced +31 MiB/s in disk writes. By first using the Overview to gather baseline data, identify anomalies, and use aggregate +functions to your advantage, you've proactively recognized single-node issues using an infrastructure-wide interface. + +### Drill down to single-node dashboards + +Overview helps you take the investigation further with quick access to single-node dashboards in Netdata Cloud. + +Click on **X Charts** of any composite chart's definition bar to display a dropdown of contributing contexts and nodes +contributing. Click on the link icon <img class="img__inline img__inline--link" +src="https://user-images.githubusercontent.com/1153921/95762109-1d219300-0c62-11eb-8daa-9ba509a8e71c.png" /> next to a +given node to quickly _jump to the same chart in that node's single-node dashboard_ in Netdata Cloud. + +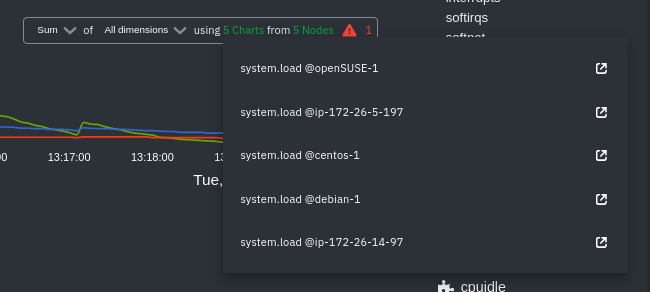) + +You can use single-node dashboards in Netdata Cloud to drill down on specific issues, scrub backward in time to +investigate historical data, and see like metrics presented meaningfully to help you troubleshoot performance problems. +All of the familiar [interactions](/docs/visualize/interact-dashboards-charts.md) are available, as is adding any chart +to a [new dashboard](/docs/visualize/create-dashboards.md). + +Using the above example, one of the single-node dashboards reveals similar spike in disk I/O. Interestingly enough, it +also shows a maximum disk write of 31 MiB/s at the exact same moment as the composite chart in Overview. + +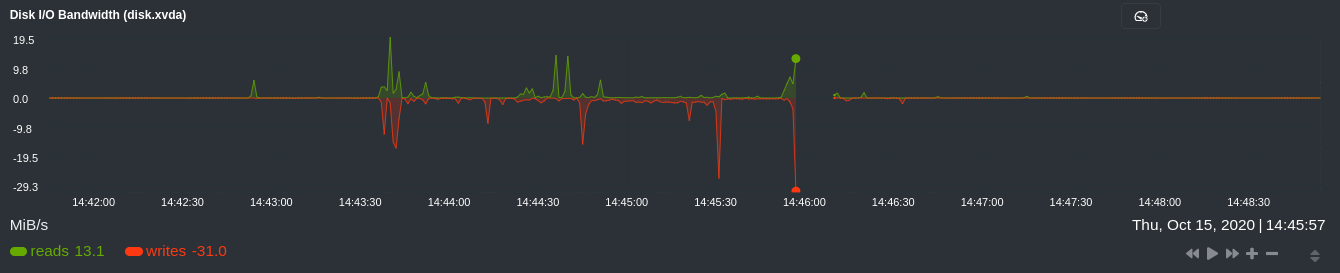 + +You now know that this particular node, during this particular time, experienced anomalous behavior. In this case, the +root cause of the disk I/O spike was due to updating the Netdata Agent itself, which is also the cause of the subsequent +gap in metrics history. + +## Nodes view + +You can also use the **Nodes view** to monitor the health status and user-configurable key metrics from multiple nodes +in a War Room. Read the [Nodes view doc](https://learn.netdata.cloud/docs/cloud/visualize/nodes) for details. + +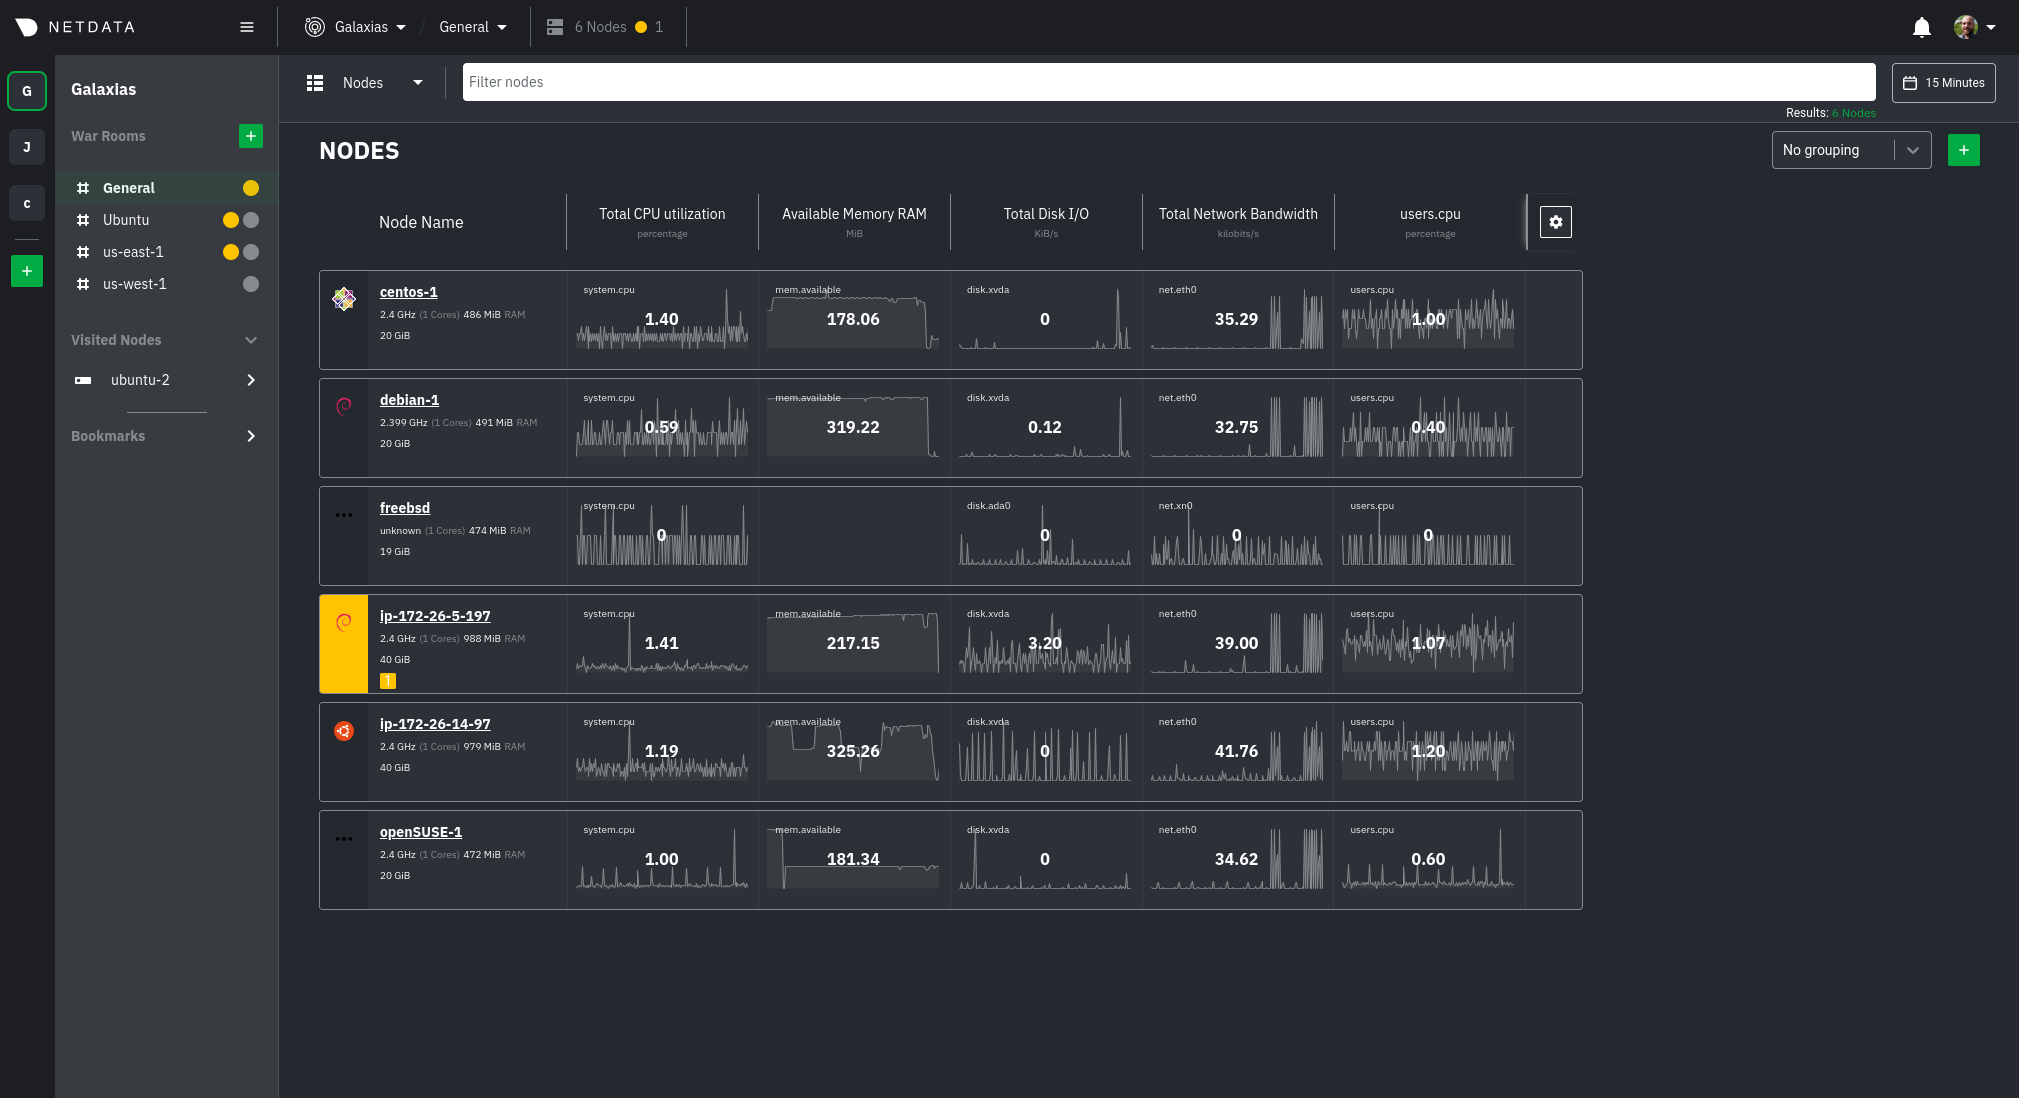 + +## What's next? + +To troubleshoot complex performance issues using Netdata, you need to understand how to interact with its meaningful +visualizations. Learn more about [interaction](/docs/visualize/interact-dashboards-charts.md) to see historical metrics, +highlight timeframes for targeted analysis, and more. + +### Related reference documentation + +- [Netdata Cloud · War Rooms](https://learn.netdata.cloud/docs/cloud/war-rooms) +- [Netdata Cloud · Overview](https://learn.netdata.cloud/docs/cloud/visualize/overview) +- [Netdata Cloud · Nodes view](https://learn.netdata.cloud/docs/cloud/visualize/nodes-view) + +[](<>) |