
diff options
| author | Joel Hans <joel@netdata.cloud> | 2021-02-23 09:39:28 -0700 |
|---|---|---|
| committer | GitHub <noreply@github.com> | 2021-02-23 09:39:28 -0700 |
| commit | b3eb8f41332aeb098495985bbf7c69c58cc18a24 (patch) | |
| tree | 57842d64821239133256ae7a8a2b5814d2a5adb0 /docs/visualize/overview-infrastructure.md | |
| parent | 39612243910bf7b87eb6f6c3a69639ea5bd42046 (diff) | |
Update screenshots and text for new Cloud nav (#10664)
* Update screenshots and text for new Cloud nav
* Update screenshots with new sidebar
* Fix broken link
* alerts -> alarms
Diffstat (limited to 'docs/visualize/overview-infrastructure.md')
| -rw-r--r-- | docs/visualize/overview-infrastructure.md | 15 |
1 files changed, 4 insertions, 11 deletions
diff --git a/docs/visualize/overview-infrastructure.md b/docs/visualize/overview-infrastructure.md index 675abd745b..c07e37b069 100644 --- a/docs/visualize/overview-infrastructure.md +++ b/docs/visualize/overview-infrastructure.md @@ -7,22 +7,18 @@ custom_edit_url: https://github.com/netdata/netdata/edit/master/docs/visualize/o # See an overview of your infrastructure In Netdata Cloud, your nodes are organized into War Rooms. One of the two available views for a War Room is the -**Overview**, which uses composite charts to display real-time, aggregated metrics from all the nodes (or a filtered -selection) in a given War Room. +[**Overview**](https://learn.netdata.cloud/docs/cloud/visualize/overview), which uses composite charts to display +real-time, aggregated metrics from all the nodes (or a filtered selection) in a given War Room. With Overview's composite charts, you can see your infrastructure from a single pane of glass, discover trends or anomalies, then drill down with filtering or single-node dashboards to see more. In the screenshot below, each chart visualizes average or sum metrics values from across 5 distributed nodes. 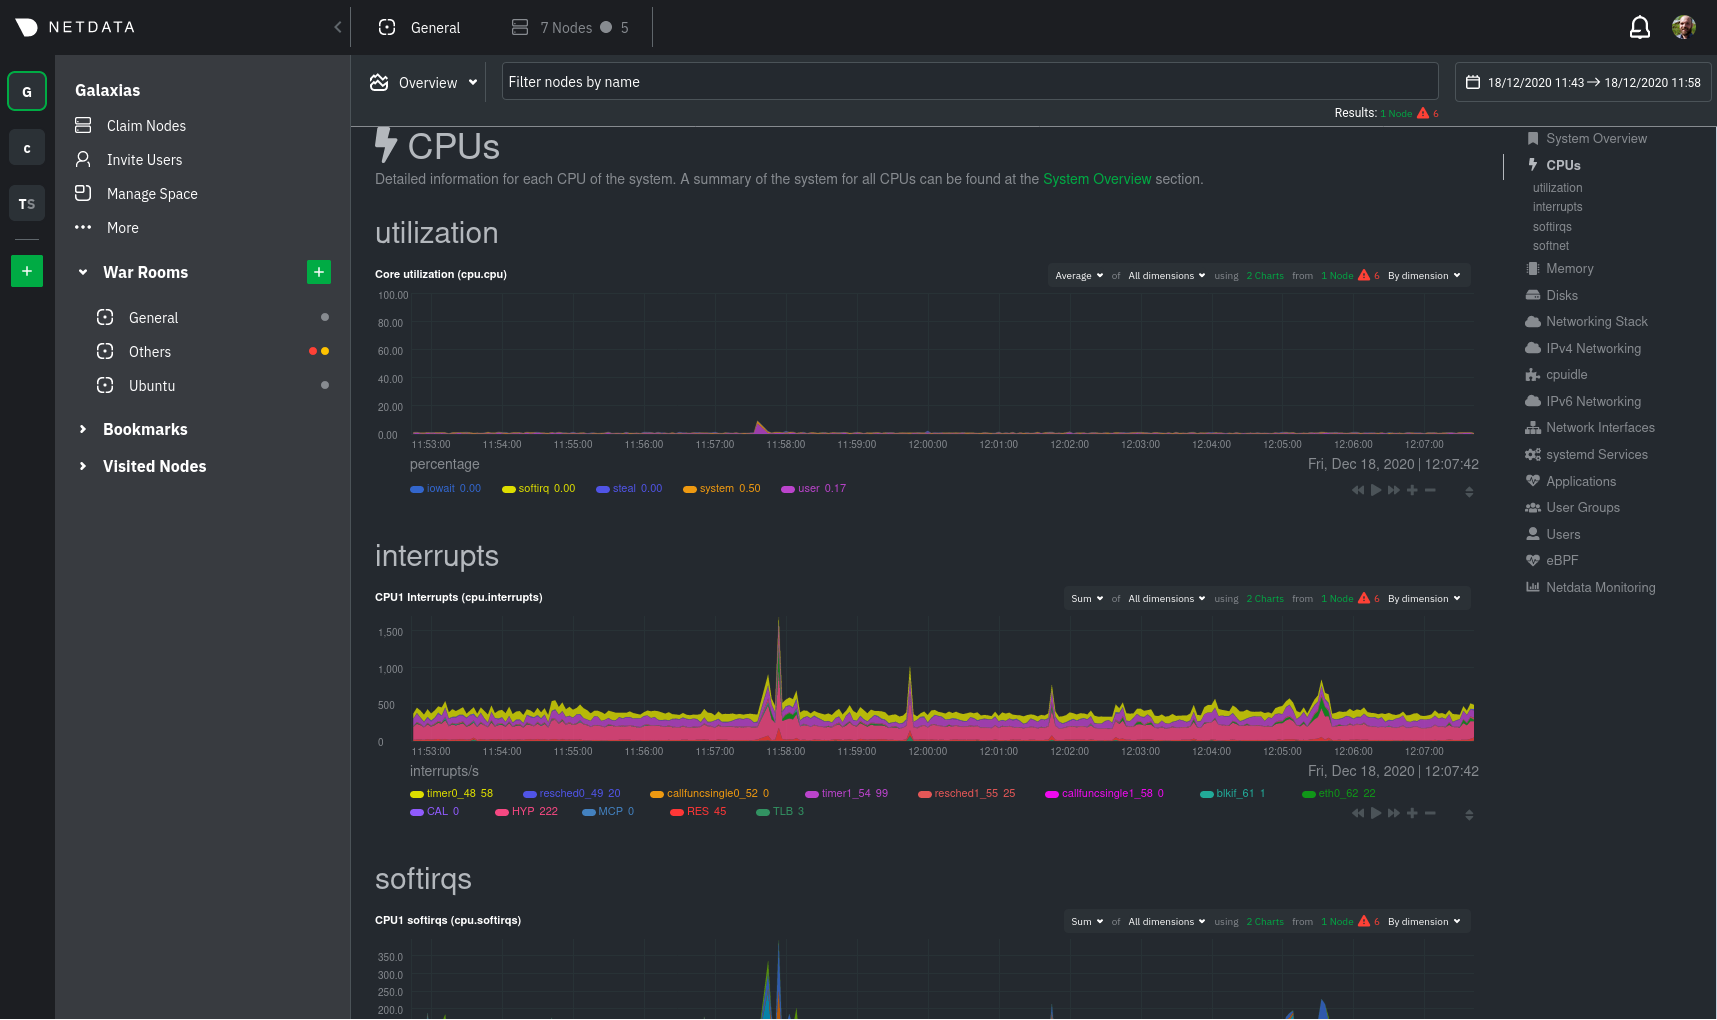 +Overview](https://user-images.githubusercontent.com/1153921/108732681-09791980-74eb-11eb-9ba2-98cb1b6608de.png) ## Using the Overview -> ⚠️ In order for nodes to contribute to composite charts, and thus the Overview UI, they must run v1.26.0 or later of -> the Netdata Agent. See our [update docs](/packaging/installer/UPDATE.md) for the preferred update method based on how -> you installed the Agent. - The Overview uses roughly the same interface as local Agent dashboards or single-node dashboards in Netdata Cloud. By showing all available metrics from all your nodes in a single interface, Netdata Cloud helps you visualize the overall health of your infrastructure. Best of all, you don't have to worry about creating your own dashboards just to get @@ -79,9 +75,6 @@ contributing. Click on the link icon <img class="img__inline img__inline--link" src="https://user-images.githubusercontent.com/1153921/95762109-1d219300-0c62-11eb-8daa-9ba509a8e71c.png" /> next to a given node to quickly _jump to the same chart in that node's single-node dashboard_ in Netdata Cloud. - - You can use single-node dashboards in Netdata Cloud to drill down on specific issues, scrub backward in time to investigate historical data, and see like metrics presented meaningfully to help you troubleshoot performance problems. All of the familiar [interactions](/docs/visualize/interact-dashboards-charts.md) are available, as is adding any chart @@ -92,7 +85,7 @@ to a [new dashboard](/docs/visualize/create-dashboards.md). You can also use the **Nodes view** to monitor the health status and user-configurable key metrics from multiple nodes in a War Room. Read the [Nodes view doc](https://learn.netdata.cloud/docs/cloud/visualize/nodes) for details. -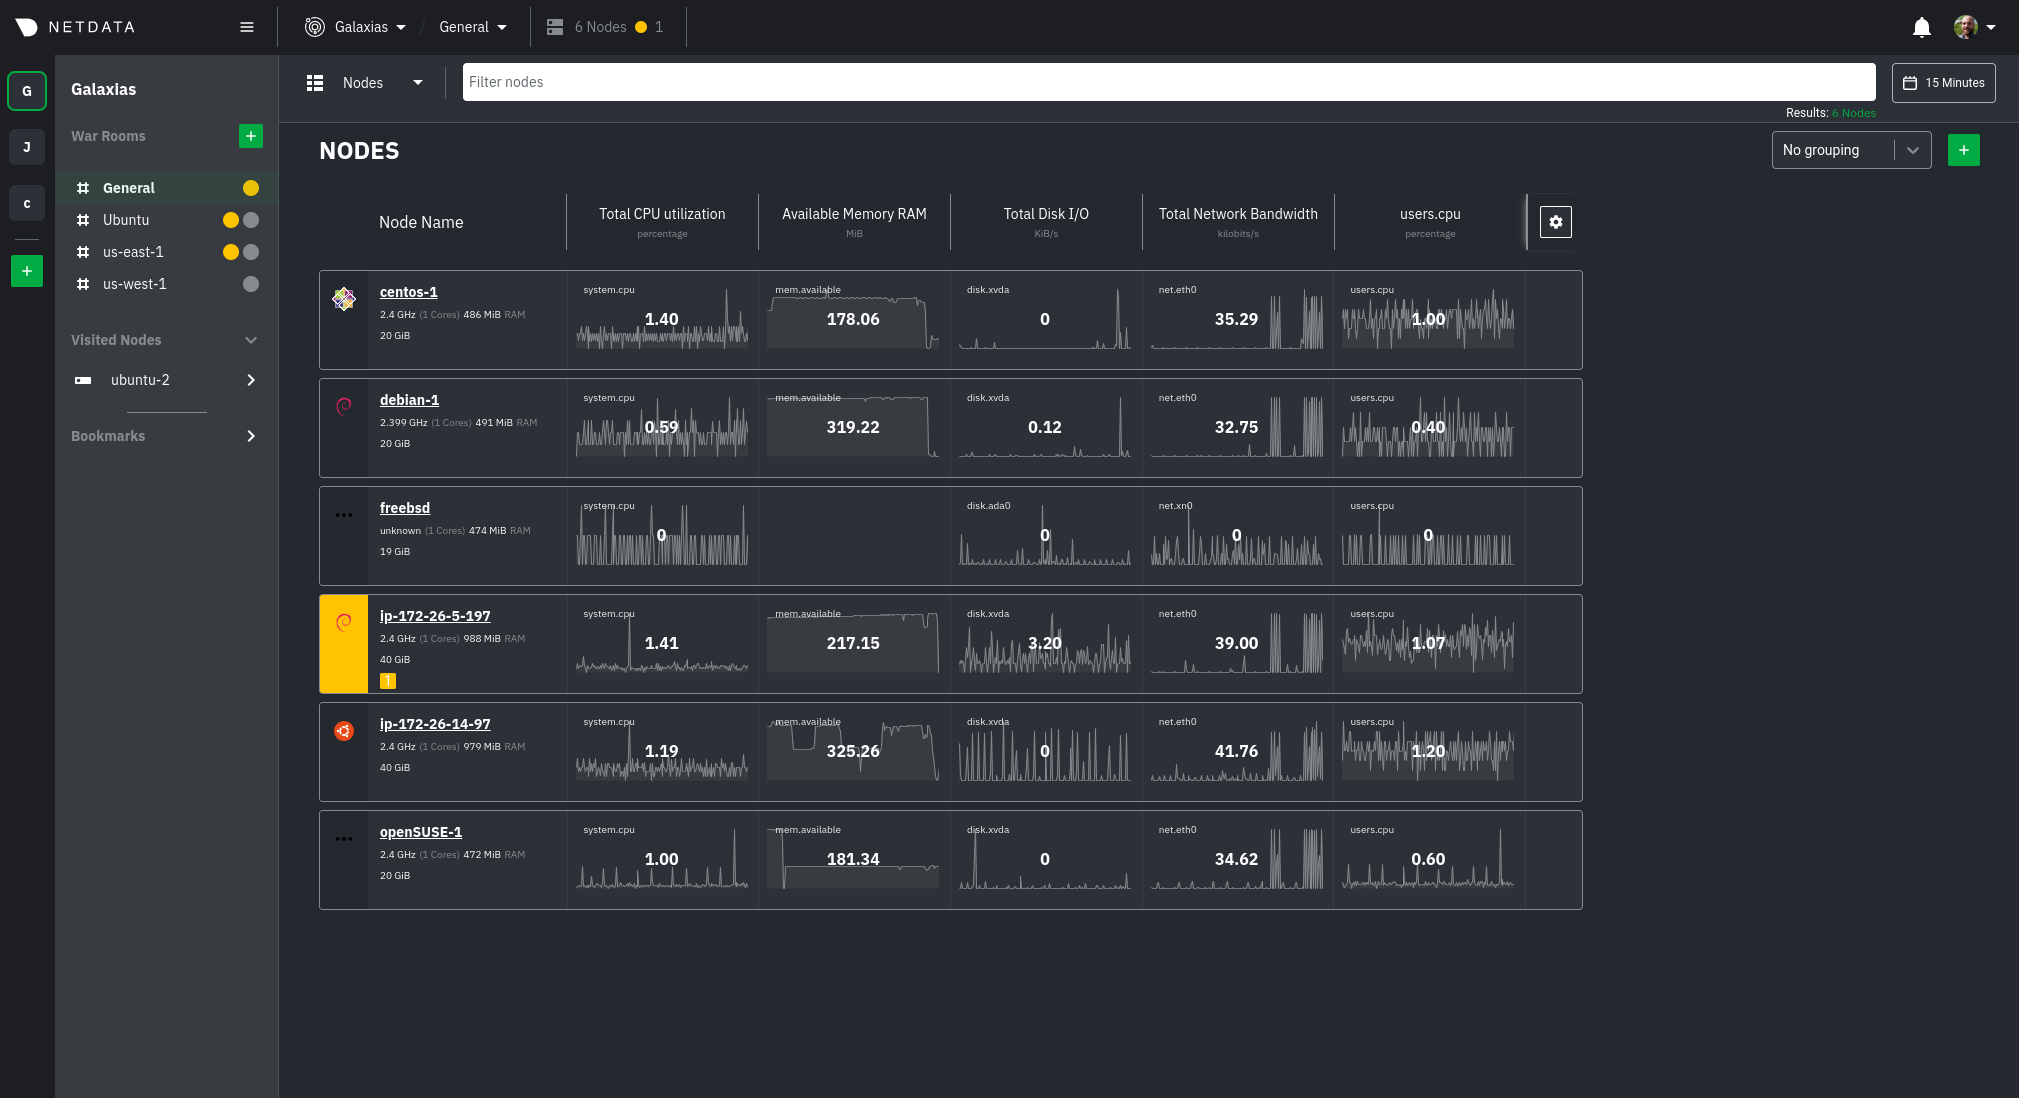 + ## What's next? |