diff options
| author | Joel Hans <joel@netdata.cloud> | 2020-10-21 05:45:15 -0700 |
|---|---|---|
| committer | GitHub <noreply@github.com> | 2020-10-21 08:45:15 -0400 |
| commit | d0634981533990aa6f4aec2368bb54ef081946be (patch) | |
| tree | 1395f4dc1f0bae518ae589b33b0dea1fe9072c51 /docs/visualize/interact-dashboards-charts.md | |
| parent | ab0ffcebf802803d1e88f6a5e47a314c292b45e3 (diff) | |
Add documentation for Cloud Overview (#10082)
* First pass on Overview revisions
* Finish up draft of infra doc with Overview
* Rename UI element
* Tweak to Graphite doc
* Copyedit pass
* Fixes for Amy
Diffstat (limited to 'docs/visualize/interact-dashboards-charts.md')
| -rw-r--r-- | docs/visualize/interact-dashboards-charts.md | 18 |
1 files changed, 16 insertions, 2 deletions
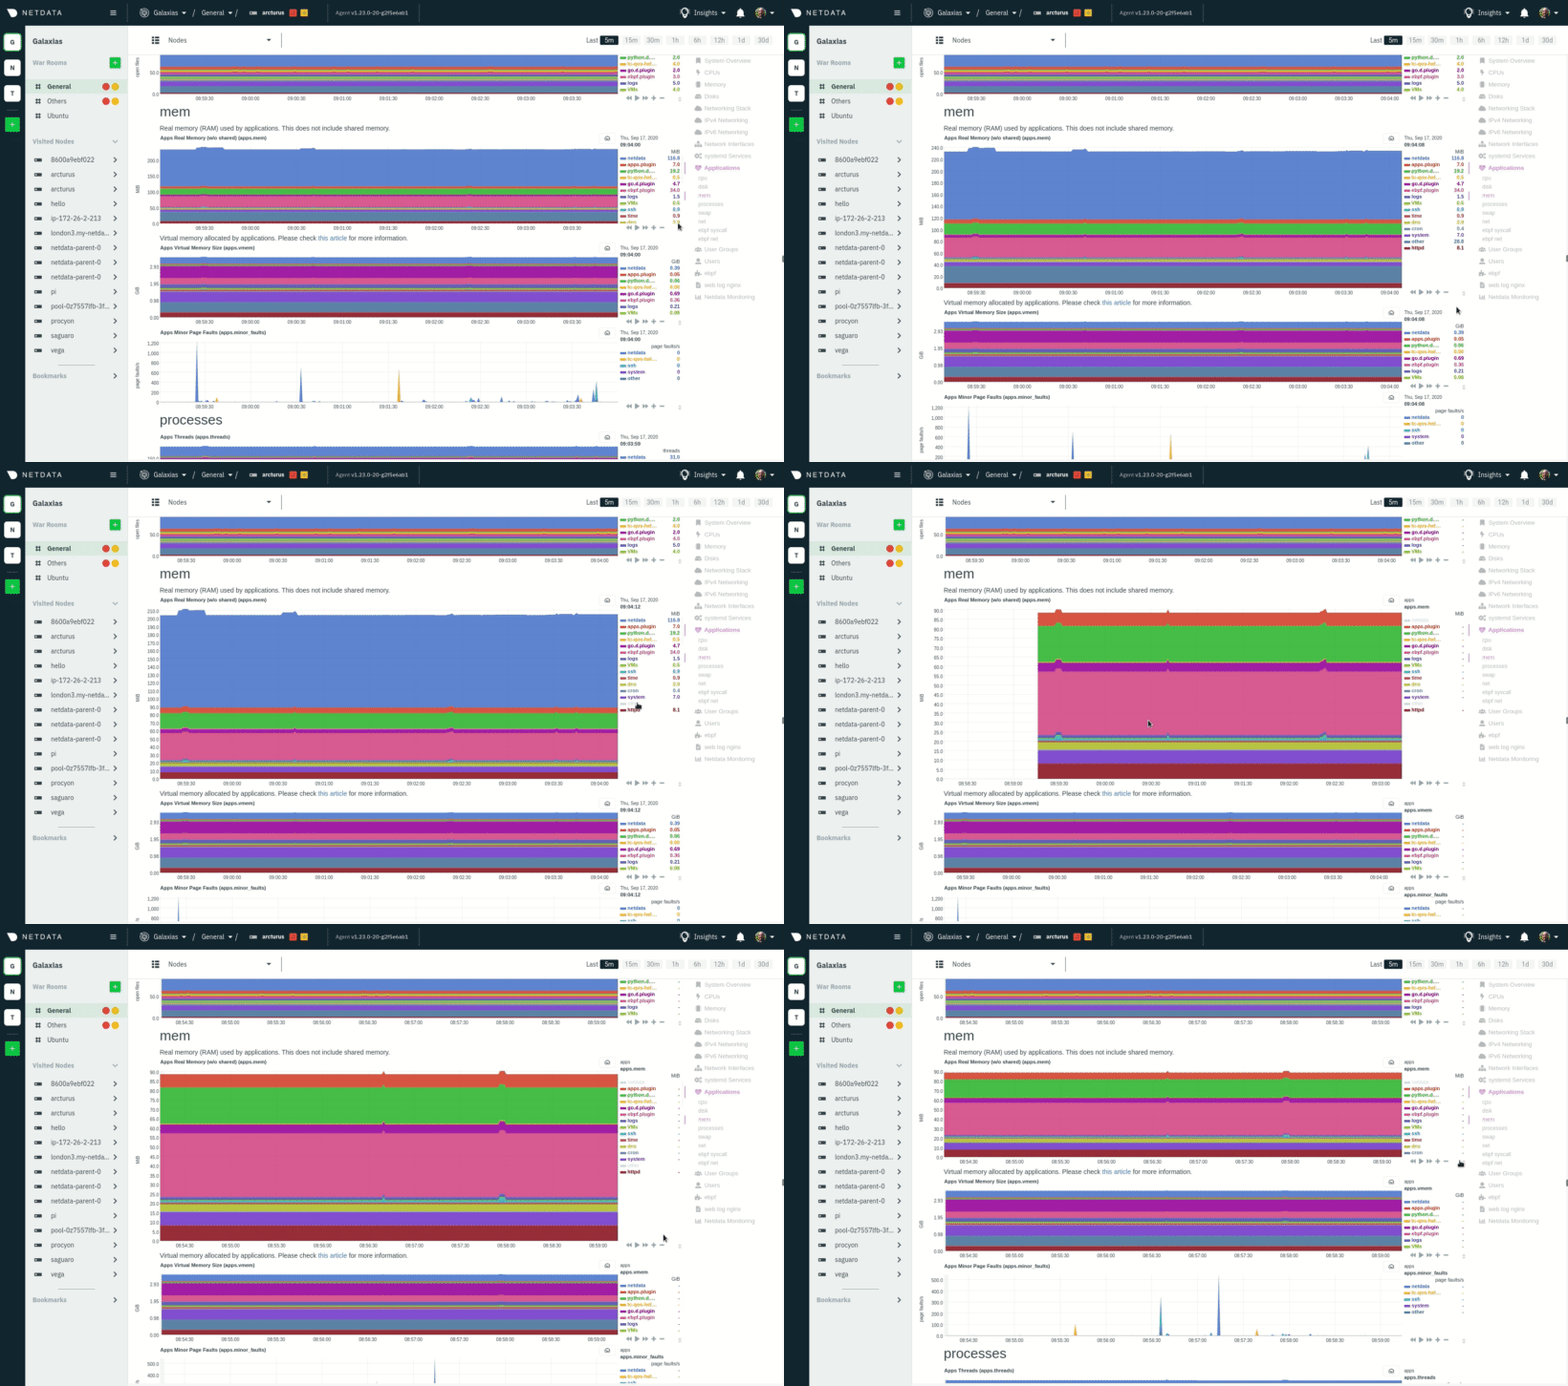
diff --git a/docs/visualize/interact-dashboards-charts.md b/docs/visualize/interact-dashboards-charts.md index 6b0076e07a..7deae1ff14 100644 --- a/docs/visualize/interact-dashboards-charts.md +++ b/docs/visualize/interact-dashboards-charts.md @@ -67,8 +67,9 @@ charts](https://user-images.githubusercontent.com/1153921/93497197-071fed00-f8c5 These interactions can also be triggered using the icons on the bottom-right corner of every chart. They are, respectively, `Pan Left`, `Reset`, `Pan Right`, `Zoom In`, and `Zoom Out`. -You can show and hide individual dimensions by clicking on their names. Hiding dimensions simplifies the chart and can -help you better discover exactly which aspect of your system is behaving strangely. +You can show and hide individual dimensions by clicking on their names. Use `SHIFT + click` to hide or show dimensions +one at a time. Hiding dimensions simplifies the chart and can help you better discover exactly which aspect of your +system is behaving strangely. You can resize any chart by clicking-and-dragging the icon on the bottom-right corner of any chart. To restore the chart to its original height, double-click the same icon. @@ -76,6 +77,13 @@ to its original height, double-click the same icon.  +### Composite charts in Netdata Cloud + +Netdata Cloud now supports composite charts in the Overview interface. Composite charts come with a few additional UI +elements and varied interactions, such as the location of dimensions and a utility bar for configuring the state of +individual composite charts. All of these de4tails are covered in the [Overview +reference](https://learn.netdata.cloud/docs/cloud/visualize/overview) doc. + ## What's next? Netdata Cloud users can [build new dashboards](/docs/visualize/create-dashboards.md) in just a few clicks. By @@ -86,4 +94,10 @@ If you're finished with dashboards for now, skip to Netdata's health watchdog fo configuring](/docs/monitor/configure-alarms.md) alarms, and [send notifications](/docs/monitor/enable-notifications.md) to get informed when something goes wrong in your infrastructure. +### Related reference documentation + +- [Netdata Agent · Web dashboards overview](/web/README.md) +- [Netdata Cloud · War Rooms](https://learn.netdata.cloud/docs/cloud/war-rooms) +- [Netdata Cloud · Overview](https://learn.netdata.cloud/docs/cloud/visualize/overview) + [](<>) |
