
diff options
| author | Joel Hans <joel@netdata.cloud> | 2020-06-04 09:05:25 -0700 |
|---|---|---|
| committer | GitHub <noreply@github.com> | 2020-06-04 09:05:25 -0700 |
| commit | fecbb89d0c33e2bbe84aa14c0b3204cb60134218 (patch) | |
| tree | 40b7581657e2bf13c0f72646c7f5137b4770172e /docs/guides | |
| parent | 78ca668e50d88670f8aaf4d2434e325f705f975c (diff) | |
Move/refactor docs to accomodate new Guides section on Learn (#9266)
* Move directories and change verbiage to guide
* Move health guides
* Quick fix to collectors quickstart
* Fix broken links
* Remove health/tutorials dir
* Fix links in collectors quickstart
* Fix links to go.d pages
Diffstat (limited to 'docs/guides')
20 files changed, 3415 insertions, 0 deletions
diff --git a/docs/guides/collect-apache-nginx-web-logs.md b/docs/guides/collect-apache-nginx-web-logs.md new file mode 100644 index 0000000000..6a32c8971d --- /dev/null +++ b/docs/guides/collect-apache-nginx-web-logs.md @@ -0,0 +1,161 @@ +<!-- +title: "Monitor Nginx or Apache web server log files with Netdata" +custom_edit_url: https://github.com/netdata/netdata/edit/master/docs/guides/collect-apache-nginx-web-logs.md +--> + +# Monitor Nginx or Apache web server log files with Netdata + +Log files have been a critical resource for developers and system administrators who want to understand the health and +performance of their web servers, and Netdata is taking important steps to make them even more valuable. + +By parsing web server log files with Netdata, and seeing the volume of redirects, requests, or server errors over time, +you can better understand what's happening on your infrastructure. Too many bad requests? Maybe a recent deploy missed a +few small SVG icons. Too many requsests? Time to batten down the hatches—it's a DDoS. + +Netdata has been capable of monitoring web log files for quite some time, thanks for the [weblog python.d +module](/collectors/python.d.plugin/web_log/README.md), but we recently refactored this module in Go, and that effort +comes with a ton of improvements. + +You can now use the [LTSV log format](http://ltsv.org/), track TLS and cipher usage, and the whole parser is faster than +ever. In one test on a system with SSD storage, the collector consistently parsed the logs for 200,000 requests in +200ms, using ~30% of a single core. To learn more about these improvements, see our [v1.19 release post](https://blog.netdata.cloud/posts/release-1.19/). + +The [go.d plugin](https://learn.netdata.cloud/docs/agent/collectors/go.d.plugin/modules/weblog/) is currently compatible +with [Nginx](https://nginx.org/en/) and [Apache](https://httpd.apache.org/). + +This guide will walk you through using the new Go-based web log collector to turn the logs these web servers +constantly write to into real-time insights into your infrastructure. + +## Set up your web servers + +As with all data sources, Netdata can auto-detect Nginx or Apache servers if you installed them using their standard +installation procedures. + +Almost all web server installations will need _no_ configuration to start collecting metrics. As long as your web server +has readable access log file, you can configure the web log plugin to access and parse it. + +## Configure the web log collector + +To use the Go version of this plugin, you need to explicitly enable it, and disable the deprecated Python version. +First, open `python.d.conf`: + +```bash +cd /etc/netdata/ # Replace with your Netdata configuration directory, if not /etc/netdata/ +./edit-config python.d.conf +``` + +Find the `web_log` line, uncomment it, and set it to `web_log: no`. Next, open the `go.d.conf` file for editing. + +```bash +./edit-config go.d.conf +``` + +Find the `web_log` line again, uncomment it, and set it to `web_log: yes`. + +Finally, restart Netdata with `service netdata restart`, or the appropriate method for your system. You should see +metrics in your Netdata dashboard! + +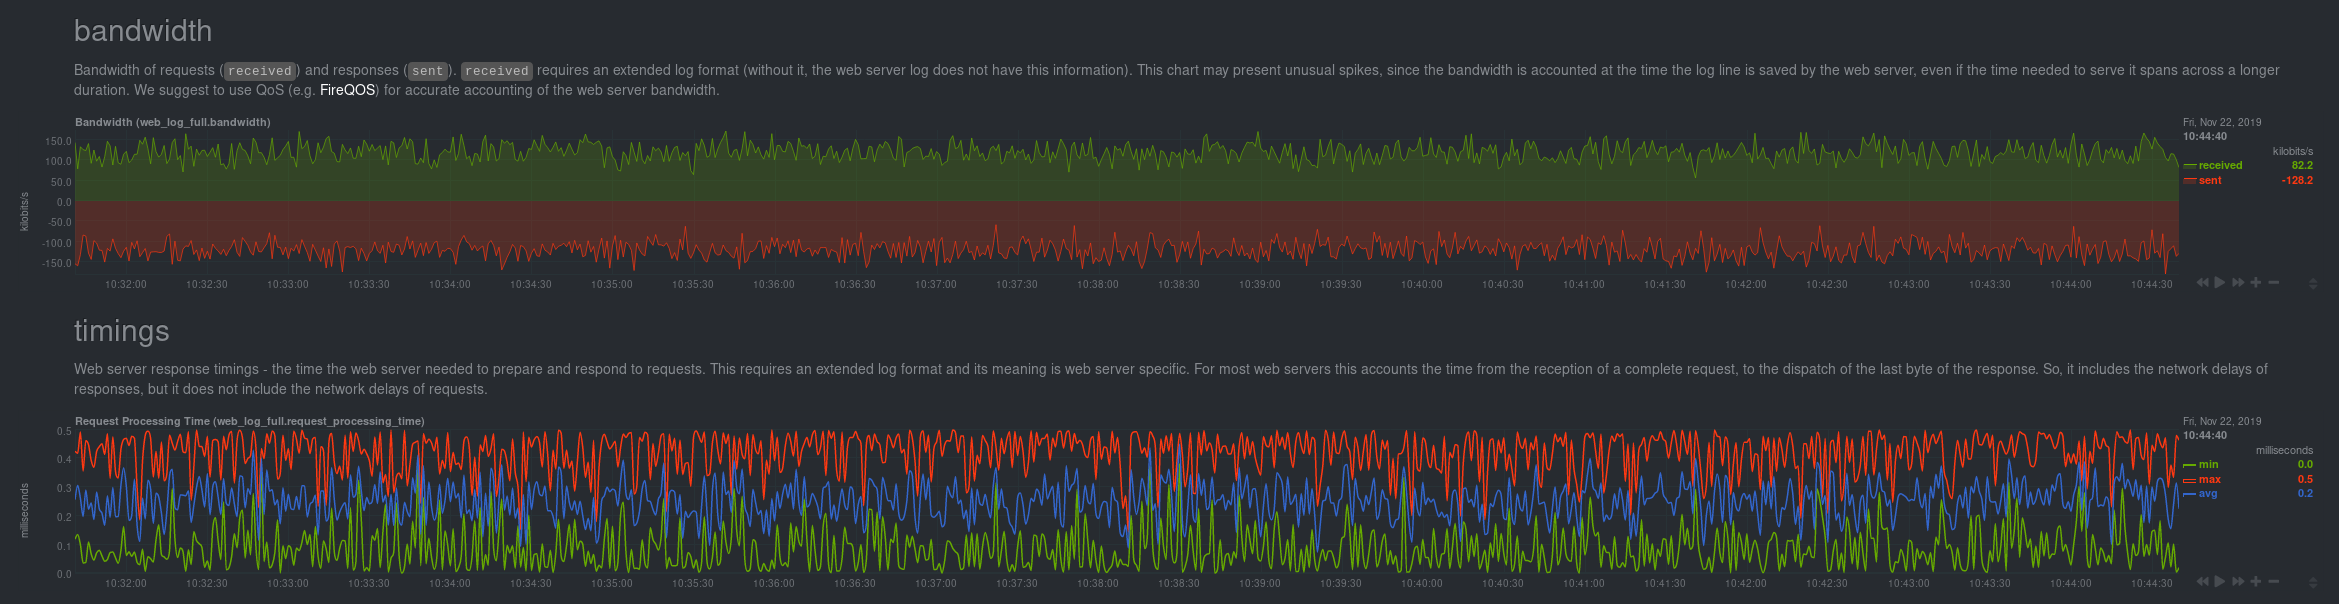 + +If you don't see web log charts, or **web log nginx**/**web log apache** menus on the right-hand side of your dashboard, +continue reading for other configuration options. + +## Custom configuration of the web log collector + +The web log collector's default configuration comes with a few example jobs that should cover most Linux distributions +and their default locations for log files: + +```yaml +# [ JOBS ] +jobs: +# NGINX +# debian, arch + - name: nginx + path: /var/log/nginx/access.log + +# gentoo + - name: nginx + path: /var/log/nginx/localhost.access_log + +# APACHE +# debian + - name: apache + path: /var/log/apache2/access.log + +# gentoo + - name: apache + path: /var/log/apache2/access_log + +# arch + - name: apache + path: /var/log/httpd/access_log + +# debian + - name: apache_vhosts + path: /var/log/apache2/other_vhosts_access.log + +# GUNICORN + - name: gunicorn + path: /var/log/gunicorn/access.log + + - name: gunicorn + path: /var/log/gunicorn/gunicorn-access.log +``` + +However, if your log files were not auto-detected, it might be because they are in a different location. Try the default +`web_log.conf` file. + +```bash +./edit-config go.d/web_log.conf +``` + +To create a new custom configuration, you need to set the `path` parameter to point to your web server's access log +file. You can give it a `name` as well, and set the `log_type` to `auto`. + +```yaml +jobs: + - name: example + path: /path/to/file.log + log_type: auto +``` + +Restart Netdata with `service netdata restart` or the appropriate method for your system. Netdata should pick up your +web server's access log and begin showing real-time charts! + +### Custom log formats and fields + +The web log collector is capable of parsing custom Nginx and Apache log formats and presenting them as charts, but we'll +leave that topic for a separate guide. + +We do have [extensive +documentation](https://learn.netdata.cloud/docs/agent/collectors/go.d.plugin/modules/weblog/#custom-log-format) on how +to build custom parsing for Nginx and Apache logs. + +## Tweak web log collector alarms + +Over time, we've created some default alarms for web log monitoring. These alarms are designed to work only when your +web server is receiving more than 120 requests per minute. Otherwise, there's simply not enough data to make conclusions +about what is "too few" or "too many." + +- [web log alarms](https://raw.githubusercontent.com/netdata/netdata/master/health/health.d/web_log.conf). + +You can also edit this file directly with `edit-config`: + +```bash +./edit-config health.d/weblog.conf +``` + +For more information about editing the defaults or writing new alarm entities, see our [health monitoring +documentation](/health/README.md). + +## What's next? + +Now that you have web log collection up and running, we recommend you take a look at the documentation for our +[python.d](/collectors/python.d.plugin/web_log/README.md) for some ideas of how you can turn these rather "boring" logs +into powerful real-time tools for keeping your servers happy. + +Don't forget to give GitHub user [Wing924](https://github.com/Wing924) a big 👍 for his hard work in starting up the Go +refactoring effort. + +[](<>) diff --git a/docs/guides/collect-unbound-metrics.md b/docs/guides/collect-unbound-metrics.md new file mode 100644 index 0000000000..2994647452 --- /dev/null +++ b/docs/guides/collect-unbound-metrics.md @@ -0,0 +1,138 @@ +<!-- +title: "Monitor Unbound DNS servers with Netdata" +date: 2020-03-31 +custom_edit_url: https://github.com/netdata/netdata/edit/master/docs/guides/collect-unbound-metrics.md +--> + +# Monitor Unbound DNS servers with Netdata + +[Unbound](https://nlnetlabs.nl/projects/unbound/about/) is a "validating, recursive, caching DNS resolver" from NLNet +Labs. In v1.19 of Netdata, we release a completely refactored collector for collecting real-time metrics from Unbound +servers and displaying them in Netdata dashboards. + +Unbound runs on FreeBSD, OpenBSD, NetBSD, macOS, Linux, and Windows, and supports DNS-over-TLS, which ensures that DNS +queries and answers are all encrypted with TLS. In theory, that should reduce the risk of eavesdropping or +man-in-the-middle attacks when communicating to DNS servers. + +This guide will show you how to collect dozens of essential metrics from your Unbound servers with minimal +configuration. + +## Set up your Unbound installation + +As with all data sources, Netdata can auto-detect Unbound servers if you installed them using the standard installation +procedure. + +Regardless of whether you're connecting to a local or remote Unbound server, you need to be able to access the server's +`remote-control` interface via an IP address, FQDN, or Unix socket. + +To set up the `remote-control` interface, you can use `unbound-control`. First, run `unbound-control-setup` to generate +the TLS key files that will encrypt connections to the remote interface. Then add the following to the end of your +`unbound.conf` configuration file. See the [Unbound +documentation](https://nlnetlabs.nl/documentation/unbound/howto-setup/#setup-remote-control) for more details on using +`unbound-control`, such as how to handle situations when Unbound is run under a unique user. + +```conf +# enable remote-control +remote-control: + control-enable: yes +``` + +Next, make your `unbound.conf`, `unbound_control.key`, and `unbound_control.pem` files readable by Netdata using [access +control lists](https://wiki.archlinux.org/index.php/Access_Control_Lists) (ACL). + +```bash +sudo setfacl -m user:netdata:r unbound.conf +sudo setfacl -m user:netdata:r unbound_control.key +sudo setfacl -m user:netdata:r unbound_control.pem +``` + +Finally, take note whether you're using Unbound in _cumulative_ or _non-cumulative_ mode. This will become relevant when +configuring the collector. + +## Configure the Unbound collector + +You may not need to do any more configuration to have Netdata collect your Unbound metrics. + +If you followed the steps above to enable `remote-control` and make your Unbound files readable by Netdata, that should +be enough. Restart Netdata with `service netdata restart`, or the appropriate method for your system. You should see +Unbound metrics in your Netdata dashboard! + + + +If that failed, you will need to manually configure `unbound.conf`. See the next section for details. + +### Manual setup for a local Unbound server + +To configure Netdata's Unbound collector module, navigate to your Netdata configuration directory (typically at +`/etc/netdata/`) and use `edit-config` to initialize and edit your Unbound configuration file. + +```bash +cd /etc/netdata/ # Replace with your Netdata configuration directory, if not /etc/netdata/ +sudo ./edit-config go.d/unbound.conf +``` + +The file contains all the global and job-related parameters. The `name` setting is required, and two Unbound servers +can't have the same name. + +> It is important you know whether your Unbound server is running in cumulative or non-cumulative mode, as a conflict +> between modes will create incorrect charts. + +Here are two examples for local Unbound servers, which may work based on your unique setup: + +```yaml +jobs: + - name: local + address: 127.0.0.1:8953 + cumulative: no + use_tls: yes + tls_skip_verify: yes + tls_cert: /path/to/unbound_control.pem + tls_key: /path/to/unbound_control.key + + - name: local + address: 127.0.0.1:8953 + cumulative: yes + use_tls: no +``` + +Netdata will attempt to read `unbound.conf` to get the appropriate `address`, `cumulative`, `use_tls`, `tls_cert`, and +`tls_key` parameters. + +Restart Netdata with `service netdata restart`, or the appropriate method for your system. + +### Manual setup for a remote Unbound server + +Collecting metrics from remote Unbound servers requires manual configuration. There are too many possibilities to cover +all remote connections here, but the [default `unbound.conf` +file](https://github.com/netdata/go.d.plugin/blob/master/config/go.d/unbound.conf) contains a few useful examples: + +```yaml +jobs: + - name: remote + address: 203.0.113.10:8953 + use_tls: no + + - name: remote_cumulative + address: 203.0.113.11:8953 + use_tls: no + cumulative: yes + + - name: remote + address: 203.0.113.10:8953 + cumulative: yes + use_tls: yes + tls_cert: /etc/unbound/unbound_control.pem + tls_key: /etc/unbound/unbound_control.key +``` + +To see all the available options, see the default [unbound.conf +file](https://github.com/netdata/go.d.plugin/blob/master/config/go.d/unbound.conf). + +## What's next? + +Now that you're collecting metrics from your Unbound servers, let us know how it's working for you! There's always room +for improvement or refinement based on real-world use cases. Feel free to [file an +issue](https://github.com/netdata/netdata/issues/new?labels=bug%2C+needs+triage&template=bug_report.md) with your +thoughts. + +[](<>) diff --git a/docs/guides/longer-metrics-storage.md b/docs/guides/longer-metrics-storage.md new file mode 100644 index 0000000000..5c542f427f --- /dev/null +++ b/docs/guides/longer-metrics-storage.md @@ -0,0 +1,158 @@ +<!-- +title: "Change how long Netdata stores metrics" +description: "With a single configuration change, the Netdata Agent can store days, weeks, or months of metrics at its famous per-second granularity." +custom_edit_url: https://github.com/netdata/netdata/edit/master/docs/guides/longer-metrics-storage.md +--> + +# Change how long Netdata stores metrics + +Netdata helps you collect thousands of system and application metrics every second, but what about storing them for the +long term? + +Many people think Netdata can only store about an hour's worth of real-time metrics, but that's simply not true any +more. With the right settings, Netdata is quite capable of efficiently storing hours or days worth of historical, +per-second metrics without having to rely on an [exporting engine](/exporting/README.md). + +This guide gives two options for configuring Netdata to store more metrics. **We recommend the default [database +engine](#using-the-database-engine)**, but you can stick with or switch to the round-robin database if you prefer. + +Let's get started. + +## Using the database engine + +The database engine uses RAM to store recent metrics while also using a "spill to disk" feature that takes advantage of +available disk space for long-term metrics storage. This feature of the database engine allows you to store a much +larger dataset than your system's available RAM. + +The database engine is currently the default method of storing metrics, but if you're not sure which database you're +using, check out your `netdata.conf` file and look for the `memory mode` setting: + +```conf +[global] + memory mode = dbengine +``` + +If `memory mode` is set to anything but `dbengine`, change it and restart Netdata using the standard command for +restarting services on your system. You're now using the database engine! + +What makes the database engine efficient? While it's structured like a traditional database, the database engine splits +data between RAM and disk. The database engine caches and indexes data on RAM to keep memory usage low, and then +compresses older metrics onto disk for long-term storage. + +When the Netdata dashboard queries for historical metrics, the database engine will use its cache, stored in RAM, to +return relevant metrics for visualization in charts. + +Now, given that the database engine uses _both_ RAM and disk, there are two other settings to consider: `page cache +size` and `dbengine disk space`. + +```conf +[global] + page cache size = 32 + dbengine disk space = 256 +``` + +`page cache size` sets the maximum amount of RAM (in MiB) the database engine will use for caching and indexing. +`dbengine disk space` sets the maximum disk space (again, in MiB) the database engine will use for storing compressed +metrics. The default settings retain about two day's worth of metris on a system collecting 2,000 metrics every second. + +[**See our database engine calculator**](https://learn.netdata.cloud/docs/agent/database/calculator) to help you +correctly set `dbengine disk space` based on your needs. The calculator gives an accurate estimate based on how many +slave nodes you have, how many metrics your Agent collects, and more. + +With the database engine active, you can back up your `/var/cache/netdata/dbengine/` folder to another location for +redundancy. + +Now that you know how to switch to the database engine, let's cover the default round-robin database for those who +aren't ready to make the move. + +## Using the round-robin database + +In previous versions, Netdata used a round-robin database to store 1 hour of per-second metrics. + +To see if you're still using this database, or if you would like to switch to it, open your `netdata.conf` file and see +if `memory mode` option is set to `save`. + +```conf +[global] + memory mode = save +``` + +If `memory mode` is set to `save`, then you're using the round-robin database. If so, the `history` option is set to +`3600`, which is the equivalent to 3,600 seconds, or one hour. + +To increase your historical metrics, you can increase `history` to the number of seconds you'd like to store: + +```conf +[global] + # 2 hours = 2 * 60 * 60 = 7200 seconds + history = 7200 + # 4 hours = 4 * 60 * 60 = 14440 seconds + history = 14440 + # 24 hours = 24 * 60 * 60 = 86400 seconds + history = 86400 +``` + +And so on. + +Next, check to see how many metrics Netdata collects on your system, and how much RAM that uses. Visit the Netdata +dashboard and look at the bottom-right corner of the interface. You'll find a sentence similar to the following: + +> Every second, Netdata collects 1,938 metrics, presents them in 299 charts and monitors them with 81 alarms. Netdata is +> using 25 MB of memory on **netdata-linux** for 1 hour, 6 minutes and 36 seconds of real-time history. + +On this desktop system, using a Ryzen 5 1600 and 16GB of RAM, the round-robin databases uses 25 MB of RAM to store just +over an hour's worth of data for nearly 2,000 metrics. + +To increase the `history` option, you need to edit your `netdata.conf` file and increase the `history` setting. In most +installations, you'll find it at `/etc/netdata/netdata.conf`, but some operating systems place it at +`/opt/netdata/etc/netdata/netdata.conf`. + +Use `/etc/netdata/edit-config netdata.conf`, or your favorite text editor, to replace `3600` with the number of seconds +you'd like to store. + +You should base this number on two things: How much history you need for your use case, and how much RAM you're willing +to dedicate to Netdata. + +> Take care when you change the `history` option on production systems. Netdata is configured to stop its process if +> your system starts running out of RAM, but you can never be too careful. Out of memory situations are very bad. + +How much RAM will a longer history use? Let's use a little math. + +The round-robin database needs 4 bytes for every value Netdata collects. If Netdata collects metrics every second, +that's 4 bytes, per second, per metric. + +```text +4 bytes * X seconds * Y metrics = RAM usage in bytes +``` + +Let's assume your system collects 1,000 metrics per second. + +```text +4 bytes * 3600 seconds * 1,000 metrics = 14400000 bytes = 14.4 MB RAM +``` + +With that formula, you can calculate the RAM usage for much larger history settings. + +```conf +# 2 hours at 1,000 metrics per second +4 bytes * 7200 seconds * 1,000 metrics = 28800000 bytes = 28.8 MB RAM +# 2 hours at 2,000 metrics per second +4 bytes * 7200 seconds * 2,000 metrics = 57600000 bytes = 57.6 MB RAM +# 4 hours at 2,000 metrics per second +4 bytes * 14440 seconds * 2,000 metrics = 115520000 bytes = 115.52 MB RAM +# 24 hours at 1,000 metrics per second +4 bytes * 86400 seconds * 1,000 metrics = 345600000 bytes = 345.6 MB RAM +``` + +## What's next? + +Now that you have either configured database engine or round-robin database engine to store more metrics, you'll +probably want to see it in action! + +For more information about how to pan charts to view historical metrics, see our documentation on [using +charts](/web/README.md#using-charts). + +And if you'd now like to reduce Netdata's resource usage, view our [performance guide](/docs/Performance.md) for +our best practices on optimization. + +[](<>) diff --git a/docs/guides/monitor-cockroachdb.md b/docs/guides/monitor-cockroachdb.md new file mode 100644 index 0000000000..fd0e7db643 --- /dev/null +++ b/docs/guides/monitor-cockroachdb.md @@ -0,0 +1,136 @@ +<!-- +title: "Monitor CockroachDB metrics with Netdata" +custom_edit_url: https://github.com/netdata/netdata/edit/master/docs/guides/monitor-cockroachdb.md +--> + +# Monitor CockroachDB metrics with Netdata + +[CockroachDB](https://github.com/cockroachdb/cockroach) is an open-source project that brings SQL databases into +scalable, disaster-resilient cloud deployments. Thanks to a [new CockroachDB +collector](https://learn.netdata.cloud/docs/agent/collectors/go.d.plugin/modules/cockroachdb/) released in +[v1.20](https://blog.netdata.cloud/posts/release-1.20/), you can now monitor any number of CockroachDB databases with +maximum granularity using Netdata. Collect more than 50 unique metrics and put them on interactive visualizations +designed for better visual anomaly detection. + +Netdata itself uses CockroachDB as part of its Netdata Cloud infrastructure, so we're happy to introduce this new +collector and help others get started with it straightaway. + +Let's dive in and walk through the process of monitoring CockroachDB metrics with Netdata. + +## What's in this guide + +- [Configure the CockroachDB collector](#configure-the-cockroachdb-collector) + - [Manual setup for a local CockroachDB database](#manual-setup-for-a-local-cockroachdb-database) +- [Tweak CockroachDB alarms](#tweak-cockroachdb-alarms) + +## Configure the CockroachDB collector + +Because _all_ of Netdata's collectors can auto-detect the services they monitor, you _shouldn't_ need to worry about +configuring CockroachDB. Netdata only needs to regularly query the database's `_status/vars` page to gather metrics and +display them on the dashboard. + +If your CockroachDB instance is accessible through `http://localhost:8080/` or `http://127.0.0.1:8080`, your setup is +complete. Restart Netdata with `service netdata restart`, or use the [appropriate +method](../getting-started.md#start-stop-and-restart-netdata) for your system, and refresh your browser. You should see +CockroachDB metrics in your Netdata dashboard! + +<figure> + <img src="https://user-images.githubusercontent.com/1153921/73564467-d7e36b00-441c-11ea-9ec9-b5d5ea7277d4.png" alt="CPU utilization charts from a CockroachDB database monitored by Netdata" /> + <figcaption>CPU utilization charts from a CockroachDB database monitored by Netdata</figcaption> +</figure> + +> Note: Netdata collects metrics from CockroachDB every 10 seconds, instead of our usual 1 second, because CockroachDB +> only updates `_status/vars` every 10 seconds. You can't change this setting in CockroachDB. + +If you don't see CockroachDB charts, you may need to configure the collector manually. + +### Manual setup for a local CockroachDB database + +To configure Netdata's CockroachDB collector, navigate to your Netdata configuration directory (typically at +`/etc/netdata/`) and use `edit-config` to initialize and edit your CockroachDB configuration file. + +```bash +cd /etc/netdata/ # Replace with your Netdata configuration directory, if not /etc/netdata/ +./edit-config go.d/cockroachdb.conf +``` + +Scroll down to the `[JOBS]` section at the bottom of the file. You will see the two default jobs there, which you can +edit, or create a new job with any of the parameters listed above in the file. Both the `name` and `url` values are +required, and everything else is optional. + +For a production cluster, you'll use either an IP address or the system's hostname. Be sure that your remote system +allows TCP communication on port 8080, or whichever port you have configured CockroachDB's [Admin +UI](https://www.cockroachlabs.com/docs/stable/monitoring-and-alerting.html#prometheus-endpoint) to listen on. + +```yaml +# [ JOBS ] +jobs: + - name: remote + url: http://203.0.113.0:8080/_status/vars + + - name: remote_hostname + url: http://cockroachdb.example.com:8080/_status/vars +``` + +For a secure cluster, use `https` in the `url` field instead. + +```yaml +# [ JOBS ] +jobs: + - name: remote + url: https://203.0.113.0:8080/_status/vars + tls_skip_verify: yes # If your certificate is self-signed + + - name: remote_hostname + url: https://cockroachdb.example.com:8080/_status/vars + tls_skip_verify: yes # If your certificate is self-signed +``` + +You can add as many jobs as you'd like based on how many CockroachDB databases you have—Netdata will create separate +charts for each job. Once you've edited `cockroachdb.conf` according to the needs of your infrastructure, restart +Netdata to see your new charts. + +<figure> + <img src="https://user-images.githubusercontent.com/1153921/73564469-d7e36b00-441c-11ea-8333-02ba0e1c294c.png" alt="Charts showing a node failure during a simulated test" /> + <figcaption>Charts showing a node failure during a simulated test</figcaption> +</figure> + +## Tweak CockroachDB alarms + +This release also includes eight pre-configured alarms for live nodes, such as whether the node is live, storage +capacity, issues with replication, and the number of SQL connections/statements. See [health.d/cockroachdb.conf on +GitHub](https://raw.githubusercontent.com/netdata/netdata/master/health/health.d/cockroachdb.conf) for details. + +You can also edit these files directly with `edit-config`: + +```bash +cd /etc/netdata/ # Replace with your Netdata configuration directory, if not /etc/netdata/ +./edit-config health.d/cockroachdb.conf # You may need to use `sudo` for write privileges +``` + +For more information about editing the defaults or writing new alarm entities, see our health monitoring [quickstart +guide](/health/QUICKSTART.md). + +## What's next? + +Now that you're collecting metrics from your CockroachDB databases, let us know how it's working for you! There's always +room for improvement or refinement based on real-world use cases. Feel free to [file an +issue](https://github.com/netdata/netdata/issues/new?labels=bug%2C+needs+triage&template=bug_report.md) with your +thoughts. + +Also, be sure to check out these useful resources: + +- [Netdata's CockroachDB + documentation](https://learn.netdata.cloud/docs/agent/collectors/go.d.plugin/modules/cockroachdb/) +- [Netdata's CockroachDB + configuration](https://github.com/netdata/go.d.plugin/blob/master/config/go.d/cockroachdb.conf) +- [Netdata's CockroachDB + alarms](https://github.com/netdata/netdata/blob/29d9b5e51603792ee27ef5a21f1de0ba8e130158/health/health.d/cockroachdb.conf) +- [CockroachDB homepage](https://www.cockroachlabs.com/product/) +- [CockroachDB documentation](https://www.cockroachlabs.com/docs/stable/) +- [`_status/vars` endpoint + docs](https://www.cockroachlabs.com/docs/stable/monitoring-and-alerting.html#prometheus-endpoint) +- [Monitor CockroachDB with + Prometheus](https://www.cockroachlabs.com/docs/stable/monitor-cockroachdb-with-prometheus.html) + +[](<>) diff --git a/docs/guides/monitor-hadoop-cluster.md b/docs/guides/monitor-hadoop-cluster.md new file mode 100644 index 0000000000..17901f2815 --- /dev/null +++ b/docs/guides/monitor-hadoop-cluster.md @@ -0,0 +1,204 @@ +<!-- +title: "Monitor a Hadoop cluster with Netdata" +custom_edit_url: https://github.com/netdata/netdata/edit/master/docs/guides/monitor-hadoop-cluster.md +--> + +# Monitor a Hadoop cluster with Netdata + +Hadoop is an [Apache project](https://hadoop.apache.org/) is a framework for processing large sets of data across a +distributed cluster of systems. + +And while Hadoop is designed to be a highly-available and fault-tolerant service, those who operate a Hadoop cluster +will want to monitor the health and performance of their [Hadoop Distributed File System +(HDFS)](https://hadoop.apache.org/docs/r1.2.1/hdfs_design.html) and [Zookeeper](https://zookeeper.apache.org/) +implementations. + +Netdata comes with built-in and pre-configured support for monitoring both HDFS and Zookeeper. + +This guide assumes you have a Hadoop cluster, with HDFS and Zookeeper, running already. If you don't, please follow +the [official Hadoop +instructions](http://hadoop.apache.org/docs/stable/hadoop-project-dist/hadoop-common/SingleCluster.html) or an +alternative, like the guide available from +[DigitalOcean](https://www.digitalocean.com/community/tutorials/how-to-install-hadoop-in-stand-alone-mode-on-ubuntu-18-04). + +For more specifics on the collection modules used in this guide, read the respective pages in our documentation: + +- [HDFS](https://learn.netdata.cloud/docs/agent/collectors/go.d.plugin/modules/hdfs) +- [Zookeeper](https://learn.netdata.cloud/docs/agent/collectors/go.d.plugin/modules/zookeeper) + +## Set up your HDFS and Zookeeper installations + +As with all data sources, Netdata can auto-detect HDFS and Zookeeper nodes if you installed them using the standard +installation procedure. + +For Netdata to collect HDFS metrics, it needs to be able to access the node's `/jmx` endpoint. You can test whether an +JMX endpoint is accessible by using `curl HDFS-IP:PORT/jmx`. For a NameNode, you should see output similar to the +following: + +```json +{ + "beans" : [ { + "name" : "Hadoop:service=NameNode,name=JvmMetrics", + "modelerType" : "JvmMetrics", + "MemNonHeapUsedM" : 65.67851, + "MemNonHeapCommittedM" : 67.3125, + "MemNonHeapMaxM" : -1.0, + "MemHeapUsedM" : 154.46341, + "MemHeapCommittedM" : 215.0, + "MemHeapMaxM" : 843.0, + "MemMaxM" : 843.0, + "GcCount" : 15, + "GcTimeMillis" : 305, + "GcNumWarnThresholdExceeded" : 0, + "GcNumInfoThresholdExceeded" : 0, + "GcTotalExtraSleepTime" : 92, + "ThreadsNew" : 0, + "ThreadsRunnable" : 6, + "ThreadsBlocked" : 0, + "ThreadsWaiting" : 7, + "ThreadsTimedWaiting" : 34, + "ThreadsTerminated" : 0, + "LogFatal" : 0, + "LogError" : 0, + "LogWarn" : 2, + "LogInfo" : 348 + }, + { ... } + ] +} +``` + +The JSON result for a DataNode's `/jmx` endpoint is slightly different: + +```json +{ + "beans" : [ { + "name" : "Hadoop:service=DataNode,name=DataNodeActivity-dev-slave-01.dev.loc +al-9866", + "modelerType" : "DataNodeActivity-dev-slave-01.dev.local-9866", + "tag.SessionId" : null, + "tag.Context" : "dfs", + "tag.Hostname" : "dev-slave-01.dev.local", + "BytesWritten" : 500960407,< |