
diff options
| author | Joel Hans <joel@netdata.cloud> | 2020-10-21 05:45:15 -0700 |
|---|---|---|
| committer | GitHub <noreply@github.com> | 2020-10-21 08:45:15 -0400 |
| commit | d0634981533990aa6f4aec2368bb54ef081946be (patch) | |
| tree | 1395f4dc1f0bae518ae589b33b0dea1fe9072c51 /docs/guides | |
| parent | ab0ffcebf802803d1e88f6a5e47a314c292b45e3 (diff) | |
Add documentation for Cloud Overview (#10082)
* First pass on Overview revisions
* Finish up draft of infra doc with Overview
* Rename UI element
* Tweak to Graphite doc
* Copyedit pass
* Fixes for Amy
Diffstat (limited to 'docs/guides')
| -rw-r--r-- | docs/guides/export/export-netdata-metrics-graphite.md | 6 | ||||
| -rw-r--r-- | docs/guides/troubleshoot/monitor-debug-applications-ebpf.md | 8 |
2 files changed, 7 insertions, 7 deletions
diff --git a/docs/guides/export/export-netdata-metrics-graphite.md b/docs/guides/export/export-netdata-metrics-graphite.md index 31eb4830fa..4b11c3b15c 100644 --- a/docs/guides/export/export-netdata-metrics-graphite.md +++ b/docs/guides/export/export-netdata-metrics-graphite.md @@ -165,9 +165,9 @@ You can also show these exporting engine metrics on Netdata Cloud. If you don't in](https://app.netdata.cloud) and get started for free. If you need some help along the way, read the [get started with Cloud guide](https://learn.netdata.cloud/docs/cloud/get-started). -Add more metrics to the Nodes view by clicking on the **Add metric** button, then typing `exporting` into the context -field. Choose the exporting contexts you want to add, then click **Add**. You'll see these charts alongside any others -you've customized in Netdata Cloud. +Add more metrics to a War Room's Nodes view by clicking on the **Add metric** button, then typing `exporting` into the +context field. Choose the exporting contexts you want to add, then click **Add**. You'll see these charts alongside any +others you've customized in Netdata Cloud. 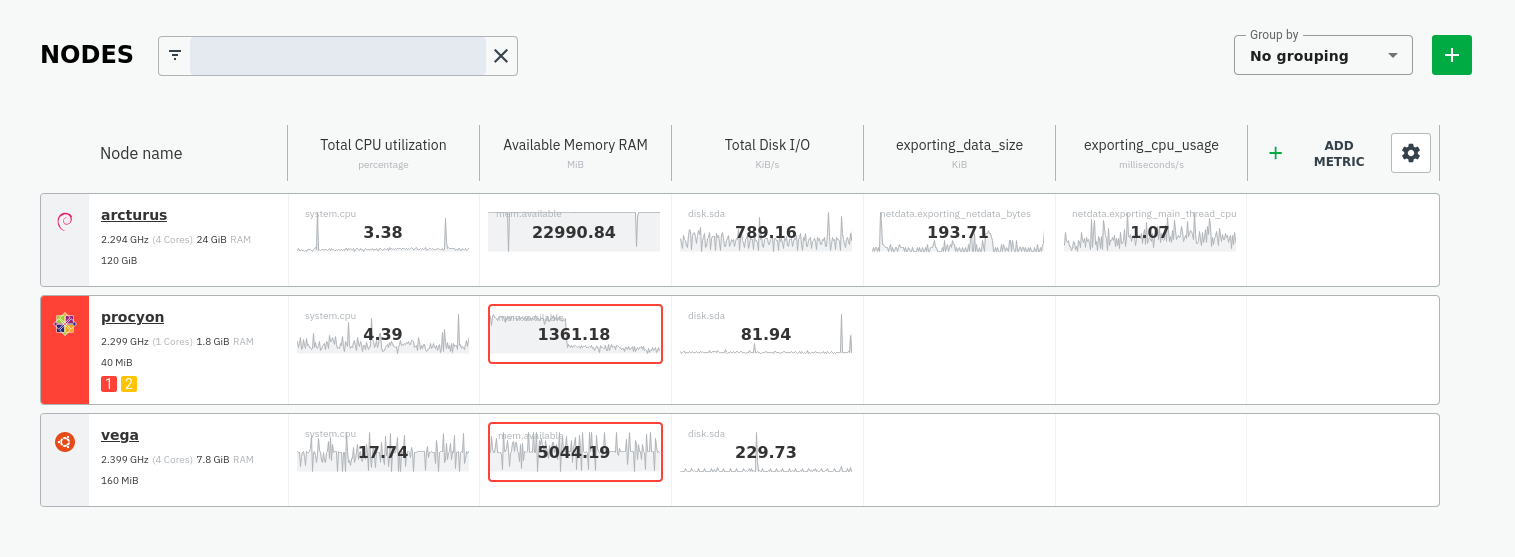 diff --git a/docs/guides/troubleshoot/monitor-debug-applications-ebpf.md b/docs/guides/troubleshoot/monitor-debug-applications-ebpf.md index e0e9958539..721d84afd3 100644 --- a/docs/guides/troubleshoot/monitor-debug-applications-ebpf.md +++ b/docs/guides/troubleshoot/monitor-debug-applications-ebpf.md @@ -236,10 +236,10 @@ If you don't already have a Netdata Cloud account, go [sign in](https://app.netd Read the [get started with Cloud guide](https://learn.netdata.cloud/docs/cloud/get-started) for a walkthrough of node claiming and other fundamentals. -Add more charts to the Nodes view by clicking on the gear icon at the far end of the table. Click on the **Context** -input and scroll until you find the eBPF chart you're interested in, or type in the name of the context directly. Maybe -something like `apps.vfs_write_call`? Next, click on the **Dimensions** input and find the `dev` dimension, or maybe -`apache`/`redis` if you set your `apps_groups.conf` up like the examples above. +Add more charts to a War Room's Overview, or the Nodes view, by clicking on the gear icon at the far end of the table. +Click on the **Context** input and scroll until you find the eBPF chart you're interested in, or type in the name of the +context directly. Maybe something like `apps.vfs_write_call`? Next, click on the **Dimensions** input and find the `dev` +dimension, or maybe `apache`/`redis` if you set your `apps_groups.conf` up like the examples above. Click **Save** to add the chart for all your claimed nodes. Now you can see how your application interacts with multiple Linux kernels on multiple Linux systems. |