
diff options
| author | Joel Hans <joel@netdata.cloud> | 2021-03-03 11:14:14 -0700 |
|---|---|---|
| committer | GitHub <noreply@github.com> | 2021-03-03 11:14:14 -0700 |
| commit | 1d003fa0d5111066e1459997c18bb115a036eb94 (patch) | |
| tree | 5ba84d07418857d0763c360b1fed9020890533db /docs/guides | |
| parent | 71e711430cd793daa0599c5f911018889778798b (diff) | |
Change all refs from service to systemctl (#10703)
Diffstat (limited to 'docs/guides')
| -rw-r--r-- | docs/guides/collect-apache-nginx-web-logs.md | 9 | ||||
| -rw-r--r-- | docs/guides/collect-unbound-metrics.md | 8 | ||||
| -rw-r--r-- | docs/guides/export/export-netdata-metrics-graphite.md | 4 | ||||
| -rw-r--r-- | docs/guides/monitor-cockroachdb.md | 6 | ||||
| -rw-r--r-- | docs/guides/monitor-hadoop-cluster.md | 4 | ||||
| -rw-r--r-- | docs/guides/monitor/anomaly-detection.md | 7 | ||||
| -rw-r--r-- | docs/guides/monitor/pi-hole-raspberry-pi.md | 8 | ||||
| -rw-r--r-- | docs/guides/monitor/process.md | 10 | ||||
| -rw-r--r-- | docs/guides/step-by-step/step-04.md | 4 | ||||
| -rw-r--r-- | docs/guides/step-by-step/step-05.md | 4 | ||||
| -rw-r--r-- | docs/guides/step-by-step/step-06.md | 10 | ||||
| -rw-r--r-- | docs/guides/step-by-step/step-09.md | 10 | ||||
| -rw-r--r-- | docs/guides/troubleshoot/monitor-debug-applications-ebpf.md | 8 |
13 files changed, 51 insertions, 41 deletions
diff --git a/docs/guides/collect-apache-nginx-web-logs.md b/docs/guides/collect-apache-nginx-web-logs.md index 215ced3efb..1ffa9d3b6b 100644 --- a/docs/guides/collect-apache-nginx-web-logs.md +++ b/docs/guides/collect-apache-nginx-web-logs.md @@ -52,8 +52,8 @@ Find the `web_log` line, uncomment it, and set it to `web_log: no`. Next, open t Find the `web_log` line again, uncomment it, and set it to `web_log: yes`. -Finally, restart Netdata with `service netdata restart`, or the appropriate method for your system. You should see -metrics in your Netdata dashboard! +Finally, restart Netdata with `sudo systemctl restart netdata`, or the [appropriate +method](/docs/configure/start-stop-restart.md) for your system. You should see metrics in your Netdata dashboard! 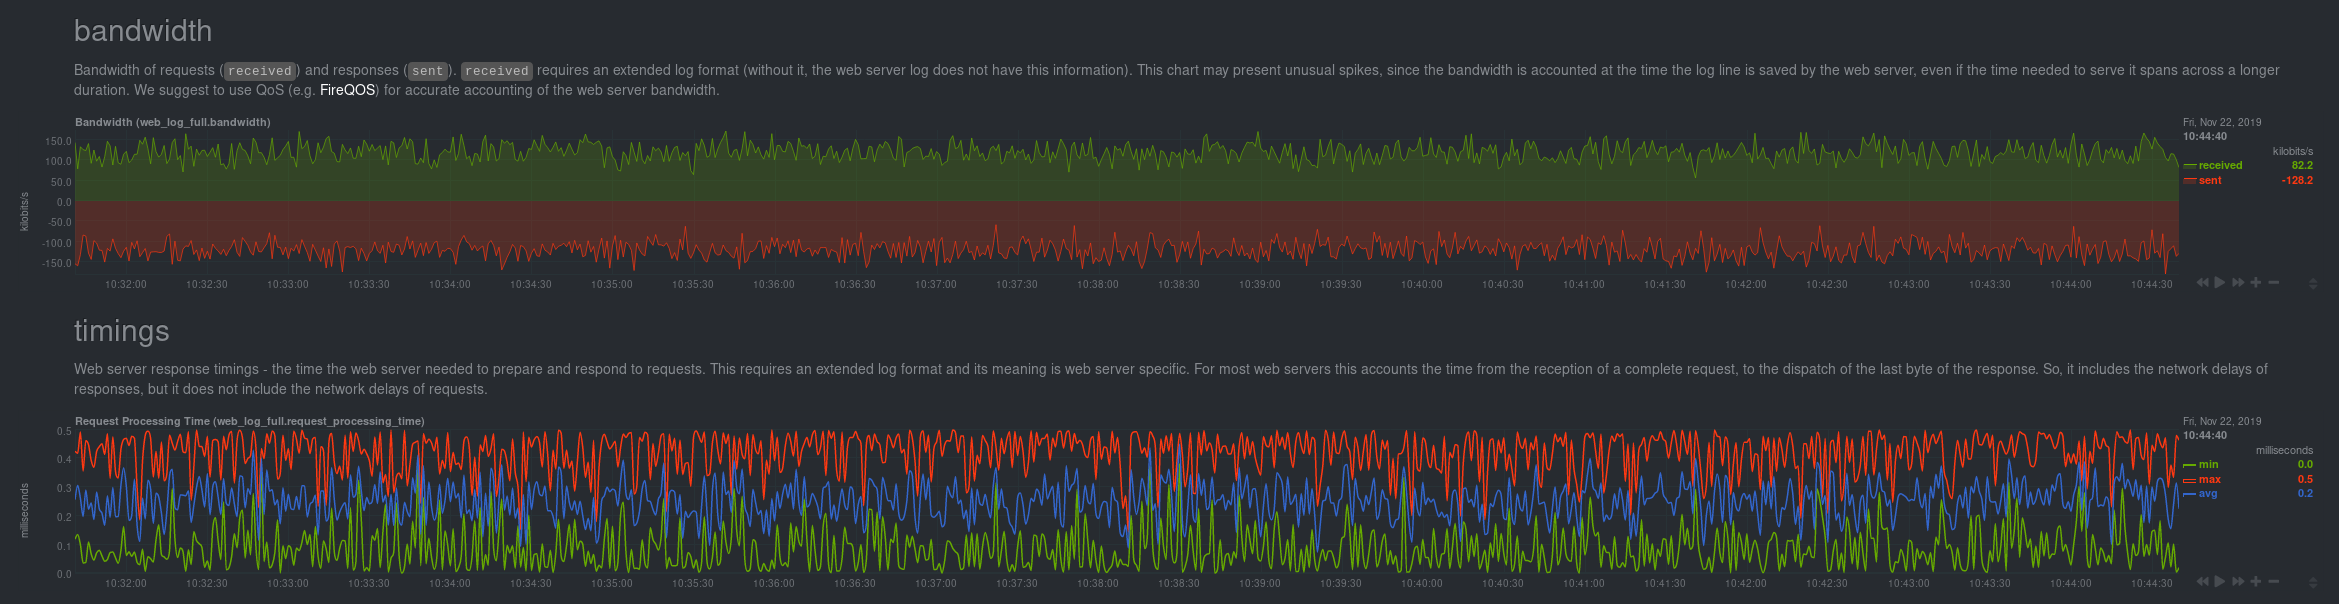 @@ -120,8 +120,9 @@ jobs: log_type: auto ``` -Restart Netdata with `service netdata restart` or the appropriate method for your system. Netdata should pick up your -web server's access log and begin showing real-time charts! +Restart Netdata with `sudo systemctl restart netdata`, or the [appropriate +method](/docs/configure/start-stop-restart.md) for your system. Netdata should pick up your web server's access log and +begin showing real-time charts! ### Custom log formats and fields diff --git a/docs/guides/collect-unbound-metrics.md b/docs/guides/collect-unbound-metrics.md index 2994647452..a6a4de02f0 100644 --- a/docs/guides/collect-unbound-metrics.md +++ b/docs/guides/collect-unbound-metrics.md @@ -54,8 +54,9 @@ configuring the collector. You may not need to do any more configuration to have Netdata collect your Unbound metrics. If you followed the steps above to enable `remote-control` and make your Unbound files readable by Netdata, that should -be enough. Restart Netdata with `service netdata restart`, or the appropriate method for your system. You should see -Unbound metrics in your Netdata dashboard! +be enough. Restart Netdata with `sudo systemctl restart netdata`, or the [appropriate +method](/docs/configure/start-stop-restart.md) for your system. You should see Unbound metrics in your Netdata +dashboard!  @@ -98,7 +99,8 @@ jobs: Netdata will attempt to read `unbound.conf` to get the appropriate `address`, `cumulative`, `use_tls`, `tls_cert`, and `tls_key` parameters. -Restart Netdata with `service netdata restart`, or the appropriate method for your system. +Restart Netdata with `sudo systemctl restart netdata`, or the [appropriate +method](/docs/configure/start-stop-restart.md) for your system. ### Manual setup for a remote Unbound server diff --git a/docs/guides/export/export-netdata-metrics-graphite.md b/docs/guides/export/export-netdata-metrics-graphite.md index 9a4a4f5ca6..ad18980b5e 100644 --- a/docs/guides/export/export-netdata-metrics-graphite.md +++ b/docs/guides/export/export-netdata-metrics-graphite.md @@ -115,8 +115,8 @@ the port accordingly. ... ``` -We'll not worry about the rest of the settings for now. Restart the Agent using `sudo service netdata restart`, or the -appropriate method for your system, to spin up the exporting engine. +We'll not worry about the rest of the settings for now. Restart the Agent using `sudo systemctl restart netdata`, or the +[appropriate method](/docs/configure/start-stop-restart.md) for your system, to spin up the exporting engine. ## See and organize Netdata metrics in Graphite diff --git a/docs/guides/monitor-cockroachdb.md b/docs/guides/monitor-cockroachdb.md index fd0e7db643..0ff9f3c772 100644 --- a/docs/guides/monitor-cockroachdb.md +++ b/docs/guides/monitor-cockroachdb.md @@ -30,9 +30,9 @@ configuring CockroachDB. Netdata only needs to regularly query the database's `_ display them on the dashboard. If your CockroachDB instance is accessible through `http://localhost:8080/` or `http://127.0.0.1:8080`, your setup is -complete. Restart Netdata with `service netdata restart`, or use the [appropriate -method](../getting-started.md#start-stop-and-restart-netdata) for your system, and refresh your browser. You should see -CockroachDB metrics in your Netdata dashboard! +complete. Restart Netdata with `sudo systemctl restart netdata`, or the [appropriate +method](/docs/configure/start-stop-restart.md) for your system, and refresh your browser. You should see CockroachDB +metrics in your Netdata dashboard! <figure> <img src="https://user-images.githubusercontent.com/1153921/73564467-d7e36b00-441c-11ea-9ec9-b5d5ea7277d4.png" alt="CPU utilization charts from a CockroachDB database monitored by Netdata" /> diff --git a/docs/guides/monitor-hadoop-cluster.md b/docs/guides/monitor-hadoop-cluster.md index 1ca2c03e11..dce56b7c76 100644 --- a/docs/guides/monitor-hadoop-cluster.md +++ b/docs/guides/monitor-hadoop-cluster.md @@ -161,10 +161,10 @@ jobs: address : 203.0.113.10:2182 ``` -Finally, restart Netdata. +Finally, [restart Netdata](/docs/configure/start-stop-restart.md). ```sh -sudo service restart netdata +sudo systemctl restart netdata ``` Upon restart, Netdata should recognize your HDFS/Zookeeper servers, enable the HDFS and Zookeeper modules, and begin diff --git a/docs/guides/monitor/anomaly-detection.md b/docs/guides/monitor/anomaly-detection.md index bb9dbc8293..ef66e261c6 100644 --- a/docs/guides/monitor/anomaly-detection.md +++ b/docs/guides/monitor/anomaly-detection.md @@ -79,9 +79,10 @@ yourself if it doesn't already exist. Either way, the final result should look l anomalies: yes ``` -[Restart the Agent](/docs/configure/start-stop-restart.md) with `sudo systemctl restart netdata` to start up the -anomalies collector. By default, the model training process runs every 30 minutes, and uses the previous 4 hours of -metrics to establish a baseline for health and performance across the default included charts. +[Restart the Agent](/docs/configure/start-stop-restart.md) with `sudo systemctl restart netdata`, or the [appropriate +method](/docs/configure/start-stop-restart.md) for your system, to start up the anomalies collector. By default, the +model training process runs every 30 minutes, and uses the previous 4 hours of metrics to establish a baseline for +health and performance across the default included charts. > 💡 The anomaly collector may need 30-60 seconds to finish its initial training and have enough data to start > generating anomaly scores. You may need to refresh your browser tab for the **Anomalies** section to appear in menus diff --git a/docs/guides/monitor/pi-hole-raspberry-pi.md b/docs/guides/monitor/pi-hole-raspberry-pi.md index a180466fb0..dc5e0b314e 100644 --- a/docs/guides/monitor/pi-hole-raspberry-pi.md +++ b/docs/guides/monitor/pi-hole-raspberry-pi.md @@ -83,9 +83,9 @@ As far as configuring Netdata to monitor Pi-hole metrics, there's nothing you ac collector](https://learn.netdata.cloud/docs/agent/collectors/go.d.plugin/modules/pihole) will autodetect the new service running on your Raspberry Pi and immediately start collecting metrics every second. -Restart Netdata with `sudo service netdata restart` to start Netdata, which will then recognize that Pi-hole is running -and start a per-second collection job. When you refresh your Netdata dashboard or load it up again in a new tab, you'll -see a new entry in the menu for **Pi-hole** metrics. +Restart Netdata with `sudo systemctl restart netdata`, which will then recognize that Pi-hole is running and start a +per-second collection job. When you refresh your Netdata dashboard or load it up again in a new tab, you'll see a new +entry in the menu for **Pi-hole** metrics. ## Use Netdata to explore and monitor your Raspberry Pi and Pi-hole @@ -119,7 +119,7 @@ cd /etc/netdata sudo ./edit-config charts.d.conf ``` -Uncomment the `sensors=force` line and save the file. Restart Netdata with `sudo service netdata restart` to enable +Uncomment the `sensors=force` line and save the file. Restart Netdata with `sudo systemctl restart netdata` to enable Raspberry Pi temperature sensor monitoring. ### Storing historical metrics on your Raspberry Pi diff --git a/docs/guides/monitor/process.md b/docs/guides/monitor/process.md index 893e6b7049..0f7c6861aa 100644 --- a/docs/guides/monitor/process.md +++ b/docs/guides/monitor/process.md @@ -169,8 +169,9 @@ postgres: postgres* sql: mariad* postmaster* oracle_* ora_* sqlservr ``` -Restart Netdata with `service netdata restart`, or the appropriate method for your system, to start collecting -utilization metrics from your application. Time to [visualize your process metrics](#visualize-process-metrics). +Restart Netdata with `sudo systemctl restart netdata`, or the [appropriate +method](/docs/configure/start-stop-restart.md) for your system, to start collecting utilization metrics from your +application. Time to [visualize your process metrics](#visualize-process-metrics). ### Custom applications @@ -194,8 +195,9 @@ custom-app: custom-app ... ``` -Restart Netdata with `service netdata restart`, or the appropriate method for your system, to start collecting -utilization metrics from your application. +Restart Netdata with `sudo systemctl restart netdata`, or the [appropriate +method](/docs/configure/start-stop-restart.md) for your system, to start collecting utilization metrics from your +application. ## Visualize process metrics diff --git a/docs/guides/step-by-step/step-04.md b/docs/guides/step-by-step/step-04.md index 0495145f48..41431b1d03 100644 --- a/docs/guides/step-by-step/step-04.md +++ b/docs/guides/step-by-step/step-04.md @@ -95,8 +95,8 @@ section and give it the value of `1`. test = 1 ``` -Restart Netdata with `service restart netdata` or the [appropriate -alternative](/docs/getting-started.md#start-stop-and-restart-netdata) for your system. +Restart Netdata with `sudo systemctl restart netdata`, or the [appropriate +method](/docs/configure/start-stop-restart.md) for your system. Now, open up your browser and navigate to `http://HOST:19999/netdata.conf`. You'll see that Netdata has recognized that our fake option isn't valid and added a notice that Netdata will ignore it. diff --git a/docs/guides/step-by-step/step-05.md b/docs/guides/step-by-step/step-05.md index 5e627632d0..30ab329cd8 100644 --- a/docs/guides/step-by-step/step-05.md +++ b/docs/guides/step-by-step/step-05.md @@ -69,8 +69,8 @@ the `warn` and `crit` lines to the values of your choosing. For example: crit: $this > (($status == $CRITICAL) ? (75) : (85)) ``` -You _can_ [restart Netdata](/docs/getting-started.md#start-stop-and-restart-netdata) to enable your tune, but you can -also reload _only_ the health monitoring component using one of the available [methods](/health/QUICKSTART.md#reload-health-configuration). +You _can_ restart Netdata with `sudo systemctl restart netdata`, to enable your tune, but you can also reload _only_ the +health monitoring component using one of the available [methods](/health/QUICKSTART.md#reload-health-configuration). You can also tune any other aspect of the default alarms. To better understand how each line in a health entity works, read our [health documentation](/health/README.md). diff --git a/docs/guides/step-by-step/step-06.md b/docs/guides/step-by-step/step-06.md index 160b1b1f62..618886076b 100644 --- a/docs/guides/step-by-step/step-06.md +++ b/docs/guides/step-by-step/step-06.md @@ -7,8 +7,8 @@ custom_edit_url: https://github.com/netdata/netdata/edit/master/docs/guides/step When Netdata _starts_, it auto-detects dozens of **data sources**, such as database servers, web servers, and more. -To auto-detect and collect metrics from a source you just installed, you need to [restart -Netdata](/docs/getting-started.md#start-stop-and-restart-netdata). +To auto-detect and collect metrics from a source you just installed, you need to restart Netdata using `sudo systemctl +restart netdata`, or the [appropriate method](/docs/configure/start-stop-restart.md) for your system. However, auto-detection only works if you installed the source using its standard installation procedure. If Netdata isn't collecting metrics after a restart, your source probably isn't configured @@ -99,9 +99,9 @@ Next, edit your `/etc/nginx/sites-enabled/default` file to include a `location` } ``` -Restart Netdata using `service netdata restart` or the [correct -alternative](/docs/getting-started.md#start-stop-and-restart-netdata) for your system, and Netdata will auto-detect -metrics from your Nginx web server! +Restart Netdata using `sudo systemctl restart netdata`, or the [appropriate +method](/docs/configure/start-stop-restart.md) for your system, and Netdata will auto-detect metrics from your Nginx web +server! While not necessary for most auto-detection and collection purposes, you can also configure the Nginx collector itself by editing its configuration file: diff --git a/docs/guides/step-by-step/step-09.md b/docs/guides/step-by-step/step-09.md index 636ffea1f8..c5b2ecd54e 100644 --- a/docs/guides/step-by-step/step-09.md +++ b/docs/guides/step-by-step/step-09.md @@ -62,7 +62,8 @@ metrics your Agent collects, and more. dbengine disk space = 512 ``` -After you've made your changes, [restart Netdata](/docs/getting-started.md#start-stop-and-restart-netdata). +After you've made your changes, restart Netdata using `sudo systemctl restart netdata`, or the [appropriate +method](/docs/configure/start-stop-restart.md) for your system. To confirm the database engine is working, go to your Netdata dashboard and click on the **Netdata Monitoring** menu on the right-hand side. You can find `dbengine` metrics after `queries`. @@ -142,9 +143,10 @@ Add the following section to the file: collection = netdata_metrics ``` -[Restart](/docs/getting-started.md#start-stop-and-restart-netdata) Netdata to enable the MongoDB exporting connector. -Click on the **Netdata Monitoring** menu and check out the **exporting my mongo instance** sub-menu. You should start -seeing these charts fill up with data about the exporting process! +Restart Netdata using `sudo systemctl restart netdata`, or the [appropriate +method](/docs/configure/start-stop-restart.md) for your system, to enable the MongoDB exporting connector. Click on the +**Netdata Monitoring** menu and check out the **exporting my mongo instance** sub-menu. You should start seeing these +charts fill up with data about the exporting process! 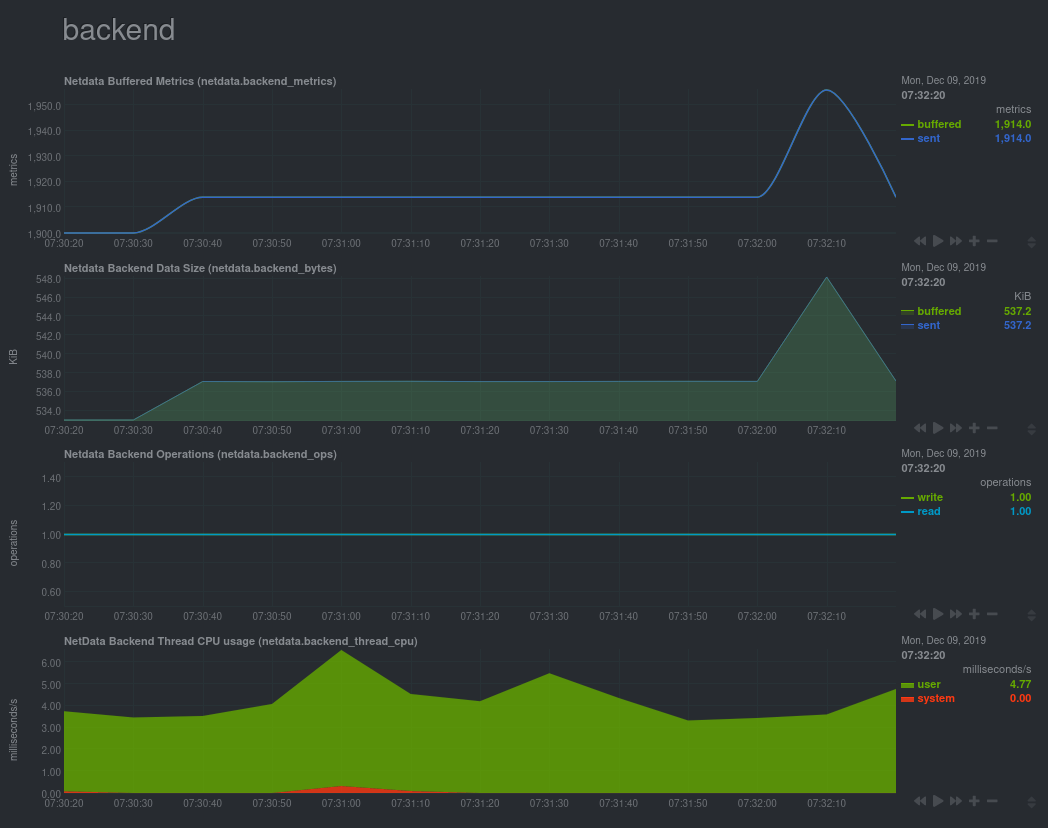 diff --git a/docs/guides/troubleshoot/monitor-debug-applications-ebpf.md b/docs/guides/troubleshoot/monitor-debug-applications-ebpf.md index 342193c583..13efa20e8a 100644 --- a/docs/guides/troubleshoot/monitor-debug-applications-ebpf.md +++ b/docs/guides/troubleshoot/monitor-debug-applications-ebpf.md @@ -57,8 +57,9 @@ dev: custom-app ... ``` -Restart Netdata with `sudo service netdata restart` or the appropriate method for your system to begin seeing metrics -for this particular group+process. You can also add additional processes to the same group. +Restart Netdata with `sudo systemctl restart netdata`, or the [appropriate +method](/docs/configure/start-stop-restart.md) for your system, to begin seeing metrics for this particular +group+process. You can also add additional processes to the same group. You can set up `apps_groups.conf` to more show more precise eBPF metrics for any application or service running on your system, even if it's a standard package like Redis, Apache, or any other [application/service Netdata collects @@ -105,7 +106,8 @@ Replace `entry` with `return`: network viewer = yes ``` -Restart Netdata with `sudo service netdata restart` or the appropriate method for your system. +Restart Netdata with `sudo systemctl restart netdata`, or the [appropriate +method](/docs/configure/start-stop-restart.md) for your system. ## Get familiar with per-application eBPF metrics and charts |