diff options
| author | Fotis Voutsas <fotis@netdata.cloud> | 2023-02-24 22:17:44 +0200 |
|---|---|---|
| committer | GitHub <noreply@github.com> | 2023-02-24 12:17:44 -0800 |
| commit | f66c74e0a82bb6bd360e659c7ad7609147612b57 (patch) | |
| tree | ab2569c84112dff46fd8a085f21508d49bb437b2 /docs/guides/monitor | |
| parent | 427c101796e0d9154cb97d275bd460ed58faab4b (diff) | |
Fix broken links (#14605)
* fix broken links
* fix a link to kernel-collector readme, make it to not point at .md
Diffstat (limited to 'docs/guides/monitor')
| -rw-r--r-- | docs/guides/monitor/lamp-stack.md | 2 |
1 files changed, 1 insertions, 1 deletions
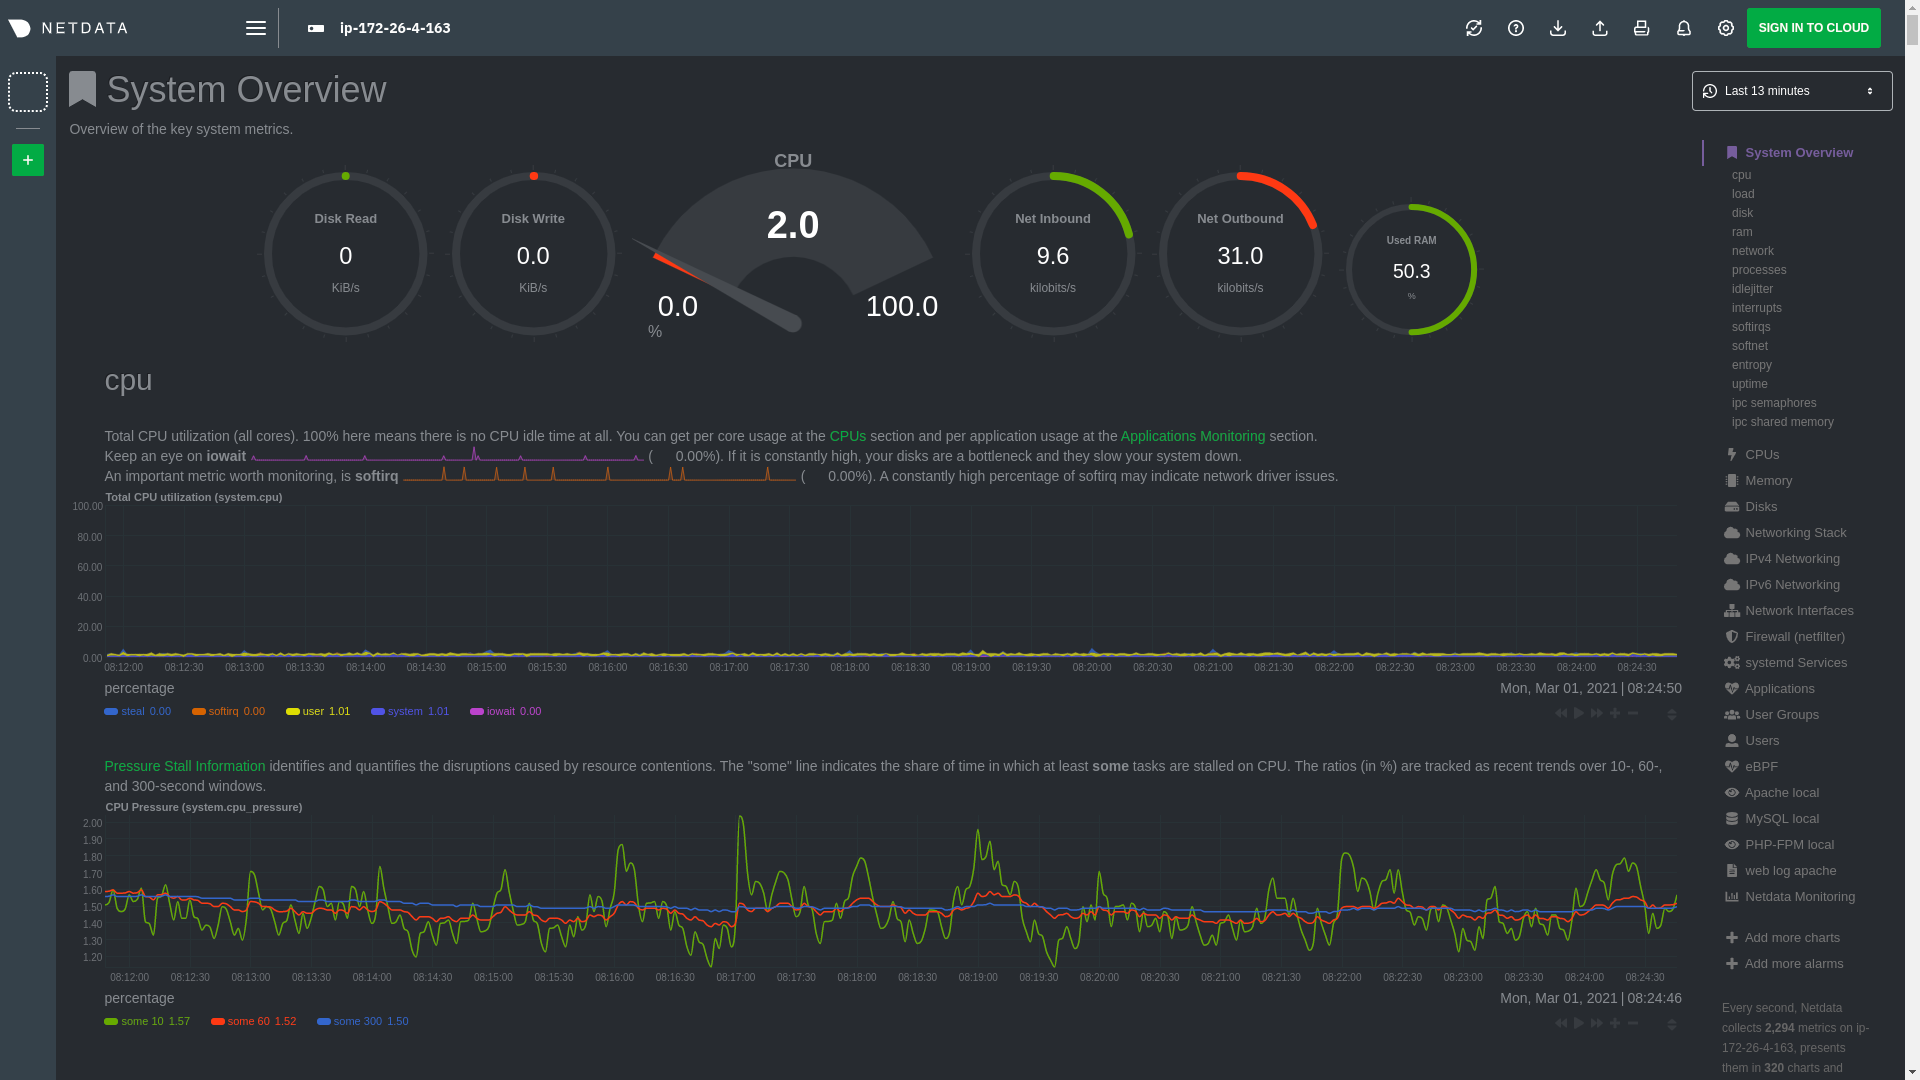
diff --git a/docs/guides/monitor/lamp-stack.md b/docs/guides/monitor/lamp-stack.md index 47a13177b6..42b4ee6321 100644 --- a/docs/guides/monitor/lamp-stack.md +++ b/docs/guides/monitor/lamp-stack.md @@ -171,7 +171,7 @@ If the Netdata Agent isn't already open in your browser, open a new tab and navi Netdata automatically organizes all metrics and charts onto a single page for easy navigation. Peek at gauges to see overall system performance, then scroll down to see more. Click-and-drag with your mouse to pan _all_ charts back and forth through different time intervals, or hold `SHIFT` and use the scrollwheel (or two-finger scroll) to zoom in and -out. Check out our doc on [interacting with charts](https://github.com/netdata/netdata/blob/master/docs/visualize/interact-dashboards-charts.md) for all the details. +out. Check out our doc on [interacting with charts](https://github.com/netdata/netdata/blob/master/docs/dashboard/interact-charts.md) for all the details.  |
