
diff options
| author | Tasos Katsoulas <tasos@netdata.cloud> | 2023-02-15 13:29:43 +0200 |
|---|---|---|
| committer | Tasos Katsoulas <tasos@netdata.cloud> | 2023-02-15 13:29:43 +0200 |
| commit | 50f04e9fc9eaaf287f811ae69f2eb2479bb9c0f9 (patch) | |
| tree | e0f4c56e3bf0f480a74df41a82eb0ccaca628fd7 | |
| parent | 3c4676c9bab20c79db0cd444a17898ff9722c2ec (diff) | |
Add troubleshooting sections to all python modulesfixPythonREADMEs
Signed-off-by: Tasos Katsoulas <tasos@netdata.cloud>
45 files changed, 916 insertions, 37 deletions
diff --git a/collectors/python.d.plugin/adaptec_raid/README.md b/collectors/python.d.plugin/adaptec_raid/README.md index 6354b0f589..47f9f437b7 100644 --- a/collectors/python.d.plugin/adaptec_raid/README.md +++ b/collectors/python.d.plugin/adaptec_raid/README.md @@ -78,6 +78,26 @@ sudo ./edit-config python.d/adaptec_raid.conf 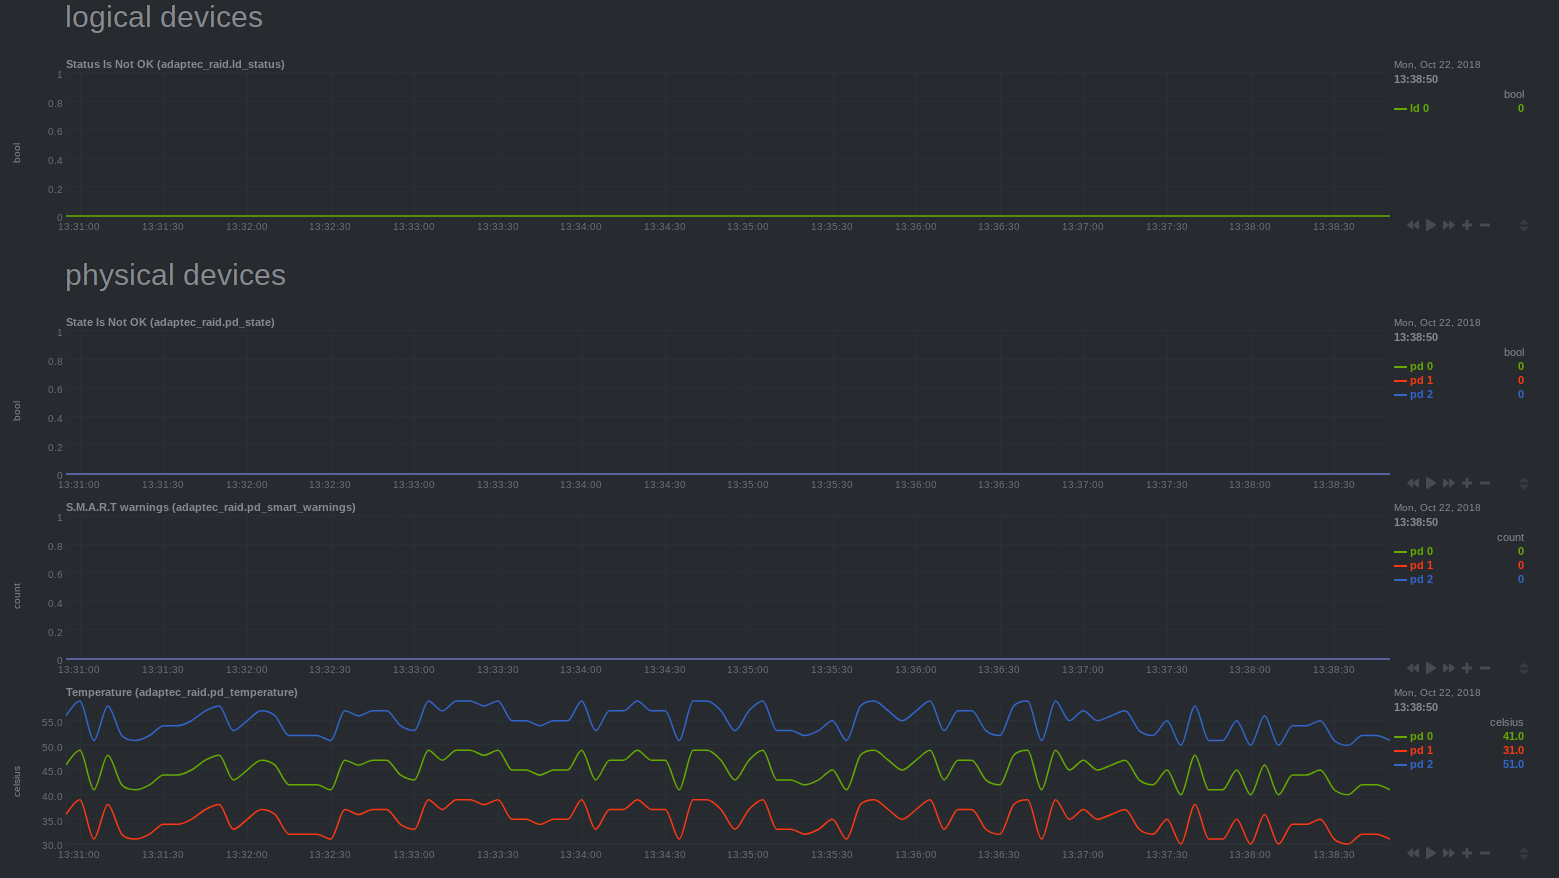 ---- + +### Troubleshooting + +To troubleshoot issues with the `adaptec_raid` module, run the `python.d.plugin` with the debug option enabled. The +output will give you the output of the data collection job or error messages on why the collector isn't working. + +First, navigate to your plugins directory, usually they are located under `/usr/libexec/netdata/plugins.d/`. If that's +not the case on your system, open `netdata.conf` and look for the setting `plugins directory`. Once you're in the +plugin's directory, switch to the `netdata` user. + +```bash +cd /usr/libexec/netdata/plugins.d/ +sudo su -s /bin/bash netdata +``` + +Now you can manually run the `adaptec_raid` module in debug mode: + +```bash +./python.d.plugin adaptec_raid debug trace +``` + diff --git a/collectors/python.d.plugin/alarms/README.md b/collectors/python.d.plugin/alarms/README.md index 9ffb3da220..9af35a595a 100644 --- a/collectors/python.d.plugin/alarms/README.md +++ b/collectors/python.d.plugin/alarms/README.md @@ -67,3 +67,23 @@ local: ``` It will default to pulling all alarms at each time step from the Netdata rest api at `http://127.0.0.1:19999/api/v1/alarms?all` +### Troubleshooting + +To troubleshoot issues with the `alarms` module, run the `python.d.plugin` with the debug option enabled. The +output will give you the output of the data collection job or error messages on why the collector isn't working. + +First, navigate to your plugins directory, usually they are located under `/usr/libexec/netdata/plugins.d/`. If that's +not the case on your system, open `netdata.conf` and look for the setting `plugins directory`. Once you're in the +plugin's directory, switch to the `netdata` user. + +```bash +cd /usr/libexec/netdata/plugins.d/ +sudo su -s /bin/bash netdata +``` + +Now you can manually run the `alarms` module in debug mode: + +```bash +./python.d.plugin alarms debug trace +``` + diff --git a/collectors/python.d.plugin/am2320/README.md b/collectors/python.d.plugin/am2320/README.md index 90a04f06cd..b8a6acb0b3 100644 --- a/collectors/python.d.plugin/am2320/README.md +++ b/collectors/python.d.plugin/am2320/README.md @@ -54,3 +54,23 @@ Software install: - restart the netdata service. - check the dashboard. +### Troubleshooting + +To troubleshoot issues with the `am2320` module, run the `python.d.plugin` with the debug option enabled. The +output will give you the output of the data collection job or error messages on why the collector isn't working. + +First, navigate to your plugins directory, usually they are located under `/usr/libexec/netdata/plugins.d/`. If that's +not the case on your system, open `netdata.conf` and look for the setting `plugins directory`. Once you're in the +plugin's directory, switch to the `netdata` user. + +```bash +cd /usr/libexec/netdata/plugins.d/ +sudo su -s /bin/bash netdata +``` + +Now you can manually run the `am2320` module in debug mode: + +```bash +./python.d.plugin am2320 debug trace +``` + diff --git a/collectors/python.d.plugin/anomalies/README.md b/collectors/python.d.plugin/anomalies/README.md index 2013213c13..a508c8a83c 100644 --- a/collectors/python.d.plugin/anomalies/README.md +++ b/collectors/python.d.plugin/anomalies/README.md @@ -83,7 +83,7 @@ sudo ./edit-config python.d/anomalies.conf The default configuration should look something like this. Here you can see each parameter (with sane defaults) and some information about each one and what it does. ```conf -# ---------------------------------------------------------------------- +# - # JOBS (data collection sources) # Pull data from local Netdata node. diff --git a/collectors/python.d.plugin/beanstalk/README.md b/collectors/python.d.plugin/beanstalk/README.md index 86c0c31850..209cfe4bc9 100644 --- a/collectors/python.d.plugin/beanstalk/README.md +++ b/collectors/python.d.plugin/beanstalk/README.md @@ -131,6 +131,26 @@ port : 11300 If no configuration is given, module will attempt to connect to beanstalkd on `127.0.0.1:11300` address ---- + +### Troubleshooting + +To troubleshoot issues with the `beanstalk` module, run the `python.d.plugin` with the debug option enabled. The +output will give you the output of the data collection job or error messages on why the collector isn't working. + +First, navigate to your plugins directory, usually they are located under `/usr/libexec/netdata/plugins.d/`. If that's +not the case on your system, open `netdata.conf` and look for the setting `plugins directory`. Once you're in the +plugin's directory, switch to the `netdata` user. + +```bash +cd /usr/libexec/netdata/plugins.d/ +sudo su -s /bin/bash netdata +``` + +Now you can manually run the `beanstalk` module in debug mode: + +```bash +./python.d.plugin beanstalk debug trace +``` + diff --git a/collectors/python.d.plugin/bind_rndc/README.md b/collectors/python.d.plugin/bind_rndc/README.md index f2fa056247..6daeb1a92a 100644 --- a/collectors/python.d.plugin/bind_rndc/README.md +++ b/collectors/python.d.plugin/bind_rndc/README.md @@ -77,6 +77,26 @@ local: If no configuration is given, module will attempt to read named.stats file at `/var/log/bind/named.stats` ---- + +### Troubleshooting + +To troubleshoot issues with the `bind_rndc` module, run the `python.d.plugin` with the debug option enabled. The +output will give you the output of the data collection job or error messages on why the collector isn't working. + +First, navigate to your plugins directory, usually they are located under `/usr/libexec/netdata/plugins.d/`. If that's +not the case on your system, open `netdata.conf` and look for the setting `plugins directory`. Once you're in the +plugin's directory, switch to the `netdata` user. + +```bash +cd /usr/libexec/netdata/plugins.d/ +sudo su -s /bin/bash netdata +``` + +Now you can manually run the `bind_rndc` module in debug mode: + +```bash +./python.d.plugin bind_rndc debug trace +``` + diff --git a/collectors/python.d.plugin/boinc/README.md b/collectors/python.d.plugin/boinc/README.md index 5fa3a36828..2b0605ad90 100644 --- a/collectors/python.d.plugin/boinc/README.md +++ b/collectors/python.d.plugin/boinc/README.md @@ -39,6 +39,26 @@ remote: password: some-password ``` ---- + +### Troubleshooting + +To troubleshoot issues with the `boinc` module, run the `python.d.plugin` with the debug option enabled. The +output will give you the output of the data collection job or error messages on why the collector isn't working. + +First, navigate to your plugins directory, usually they are located under `/usr/libexec/netdata/plugins.d/`. If that's +not the case on your system, open `netdata.conf` and look for the setting `plugins directory`. Once you're in the +plugin's directory, switch to the `netdata` user. + +```bash +cd /usr/libexec/netdata/plugins.d/ +sudo su -s /bin/bash netdata +``` + +Now you can manually run the `boinc` module in debug mode: + +```bash +./python.d.plugin boinc debug trace +``` + diff --git a/collectors/python.d.plugin/ceph/README.md b/collectors/python.d.plugin/ceph/README.md index 1f3972393d..8b2a1cb51f 100644 --- a/collectors/python.d.plugin/ceph/README.md +++ b/collectors/python.d.plugin/ceph/README.md @@ -46,6 +46,26 @@ local: keyring_file: '/etc/ceph/ceph.client.admin.keyring' ``` ---- + +### Troubleshooting + +To troubleshoot issues with the `ceph` module, run the `python.d.plugin` with the debug option enabled. The +output will give you the output of the data collection job or error messages on why the collector isn't working. + +First, navigate to your plugins directory, usually they are located under `/usr/libexec/netdata/plugins.d/`. If that's +not the case on your system, open `netdata.conf` and look for the setting `plugins directory`. Once you're in the +plugin's directory, switch to the `netdata` user. + +```bash +cd /usr/libexec/netdata/plugins.d/ +sudo su -s /bin/bash netdata +``` + +Now you can manually run the `ceph` module in debug mode: + +```bash +./python.d.plugin ceph debug trace +``` + diff --git a/collectors/python.d.plugin/changefinder/README.md b/collectors/python.d.plugin/changefinder/README.md index c3623d4a46..0da060b8fd 100644 --- a/collectors/python.d.plugin/changefinder/README.md +++ b/collectors/python.d.plugin/changefinder/README.md @@ -108,7 +108,7 @@ The default configuration should look something like this. Here you can see each information about each one and what it does. ```yaml -# ---------------------------------------------------------------------- +# - # JOBS (data collection sources) # Pull data from local Netdata node. @@ -219,3 +219,23 @@ sudo su -s /bin/bash netdata - Novelty and outlier detection in the [scikit-learn documentation](https://scikit-learn.org/stable/modules/outlier_detection.html). +### Troubleshooting + +To troubleshoot issues with the `changefinder` module, run the `python.d.plugin` with the debug option enabled. The +output will give you the output of the data collection job or error messages on why the collector isn't working. + +First, navigate to your plugins directory, usually they are located under `/usr/libexec/netdata/plugins.d/`. If that's +not the case on your system, open `netdata.conf` and look for the setting `plugins directory`. Once you're in the +plugin's directory, switch to the `netdata` user. + +```bash +cd /usr/libexec/netdata/plugins.d/ +sudo su -s /bin/bash netdata +``` + +Now you can manually run the `changefinder` module in debug mode: + +```bash +./python.d.plugin changefinder debug trace +``` + diff --git a/collectors/python.d.plugin/dovecot/README.md b/collectors/python.d.plugin/dovecot/README.md index b6c866b3e1..2bd6f20eed 100644 --- a/collectors/python.d.plugin/dovecot/README.md +++ b/collectors/python.d.plugin/dovecot/README.md @@ -103,6 +103,26 @@ localsocket: If no configuration is given, module will attempt to connect to dovecot using unix socket localized in `/var/run/dovecot/stats` ---- + +### Troubleshooting + +To troubleshoot issues with the `dovecot` module, run the `python.d.plugin` with the debug option enabled. The +output will give you the output of the data collection job or error messages on why the collector isn't working. + +First, navigate to your plugins directory, usually they are located under `/usr/libexec/netdata/plugins.d/`. If that's +not the case on your system, open `netdata.conf` and look for the setting `plugins directory`. Once you're in the +plugin's directory, switch to the `netdata` user. + +```bash +cd /usr/libexec/netdata/plugins.d/ +sudo su -s /bin/bash netdata +``` + +Now you can manually run the `dovecot` module in debug mode: + +```bash +./python.d.plugin dovecot debug trace +``` + diff --git a/collectors/python.d.plugin/example/README.md b/collectors/python.d.plugin/example/README.md index 9aabbf7b3c..50ba5c894b 100644 --- a/collectors/python.d.plugin/example/README.md +++ b/collectors/python.d.plugin/example/README.md @@ -16,3 +16,23 @@ Netdata provides an [example python data collection module](https://github.com/n If you want to write your own collector, read our [writing a new Python module](https://github.com/netdata/netdata/blob/master/collectors/python.d.plugin/README.md#how-to-write-a-new-module) tutorial. +### Troubleshooting + +To troubleshoot issues with the `example` module, run the `python.d.plugin` with the debug option enabled. The +output will give you the output of the data collection job or error messages on why the collector isn't working. + +First, navigate to your plugins directory, usually they are located under `/usr/libexec/netdata/plugins.d/`. If that's +not the case on your system, open `netdata.conf` and look for the setting `plugins directory`. Once you're in the +plugin's directory, switch to the `netdata` user. + +```bash +cd /usr/libexec/netdata/plugins.d/ +sudo su -s /bin/bash netdata +``` + +Now you can manually run the `example` module in debug mode: + +```bash +./python.d.plugin example debug trace +``` |