
diff options
Diffstat (limited to 'docs/quickstart/infrastructure.md')
| -rw-r--r-- | docs/quickstart/infrastructure.md | 24 |
1 files changed, 12 insertions, 12 deletions
diff --git a/docs/quickstart/infrastructure.md b/docs/quickstart/infrastructure.md index 4ee593dfe1..06ce860ac3 100644 --- a/docs/quickstart/infrastructure.md +++ b/docs/quickstart/infrastructure.md @@ -68,16 +68,16 @@ These tabs can be separated into "static", meaning they are by default presented #### Static tabs -- The default tab for any War Room is the [Home tab](https://github.com/netdata/netdata/blob/master/docs/cloud/visualize/overview.md#home), which gives you an overview of this Space. +- The default tab for any War Room is the [Home tab](https://github.com/netdata/netdata/blob/master/docs/dashboard/home-tab.md), which gives you an overview of this Space. Here you can see the number of Nodes claimed, data retention statics, users by role, alerts and more. -- The second and most important tab is the [Overview tab](https://github.com/netdata/netdata/blob/master/docs/cloud/visualize/overview.md#overview-and-single-node-view) which uses composite charts to display real-time metrics from every available node in a given War Room. +- The [Nodes tab](https://github.com/netdata/netdata/blob/master/docs/dashboard/nodes-tab.md) gives you the ability to see the status (offline or online), host details, alert status and also a short overview of some key metrics from all your nodes at a glance. -- The [Nodes tab](https://github.com/netdata/netdata/blob/master/docs/cloud/visualize/nodes.md) gives you the ability to see the status (offline or online), host details, alert status and also a short overview of some key metrics from all your nodes at a glance. +- The third and most important tab is the [Metrics tab](https://github.com/netdata/netdata/blob/master/docs/dashboard/metrics-tab-and-single-node-tabs.md) which uses composite charts to display real-time metrics from every available node in a given War Room. - [Kubernetes tab](https://github.com/netdata/netdata/blob/master/docs/cloud/visualize/kubernetes.md) is a logical grouping of charts regarding your Kubernetes clusters. It contains a subset of the charts available in the **Overview tab**. -- The [Dashboards tab](https://github.com/netdata/netdata/blob/master/docs/cloud/visualize/dashboards.md) gives you the ability to have tailored made views of specific/targeted interfaces for your infrastructure using any number of charts from any number of nodes. +- The [Dashboards tab](https://github.com/netdata/netdata/blob/master/docs/dashboard/dashboards-tab.md) gives you the ability to have tailored made views of specific/targeted interfaces for your infrastructure using any number of charts from any number of nodes. - The [Alerts tab](https://github.com/netdata/netdata/blob/master/docs/monitor/view-active-alerts.md) provides you with an overview for all the active alerts you receive for the nodes in this War Room, you can also see all the alerts that are configured to be triggered in any given moment. @@ -89,7 +89,7 @@ These tabs can be separated into "static", meaning they are by default presented #### Dynamic tabs -If you open a [new dashboard](https://github.com/netdata/netdata/blob/master/docs/cloud/visualize/dashboards.md), jump to a single-node dashboard, or navigate to a dedicated alert page, a new tab will open in War Room bar. +If you open a [new dashboard](https://github.com/netdata/netdata/blob/master/docs/dashboard/dashboards-tab.md), jump to a single-node dashboard, or navigate to a dedicated alert page, a new tab will open in War Room bar. Tabs can be rearranged with drag-and-drop or closed with the **X** button. Open tabs persist between sessions, so you can always come right back to your preferred setup. @@ -112,7 +112,7 @@ from every node in your infrastructure on a single dashboard. 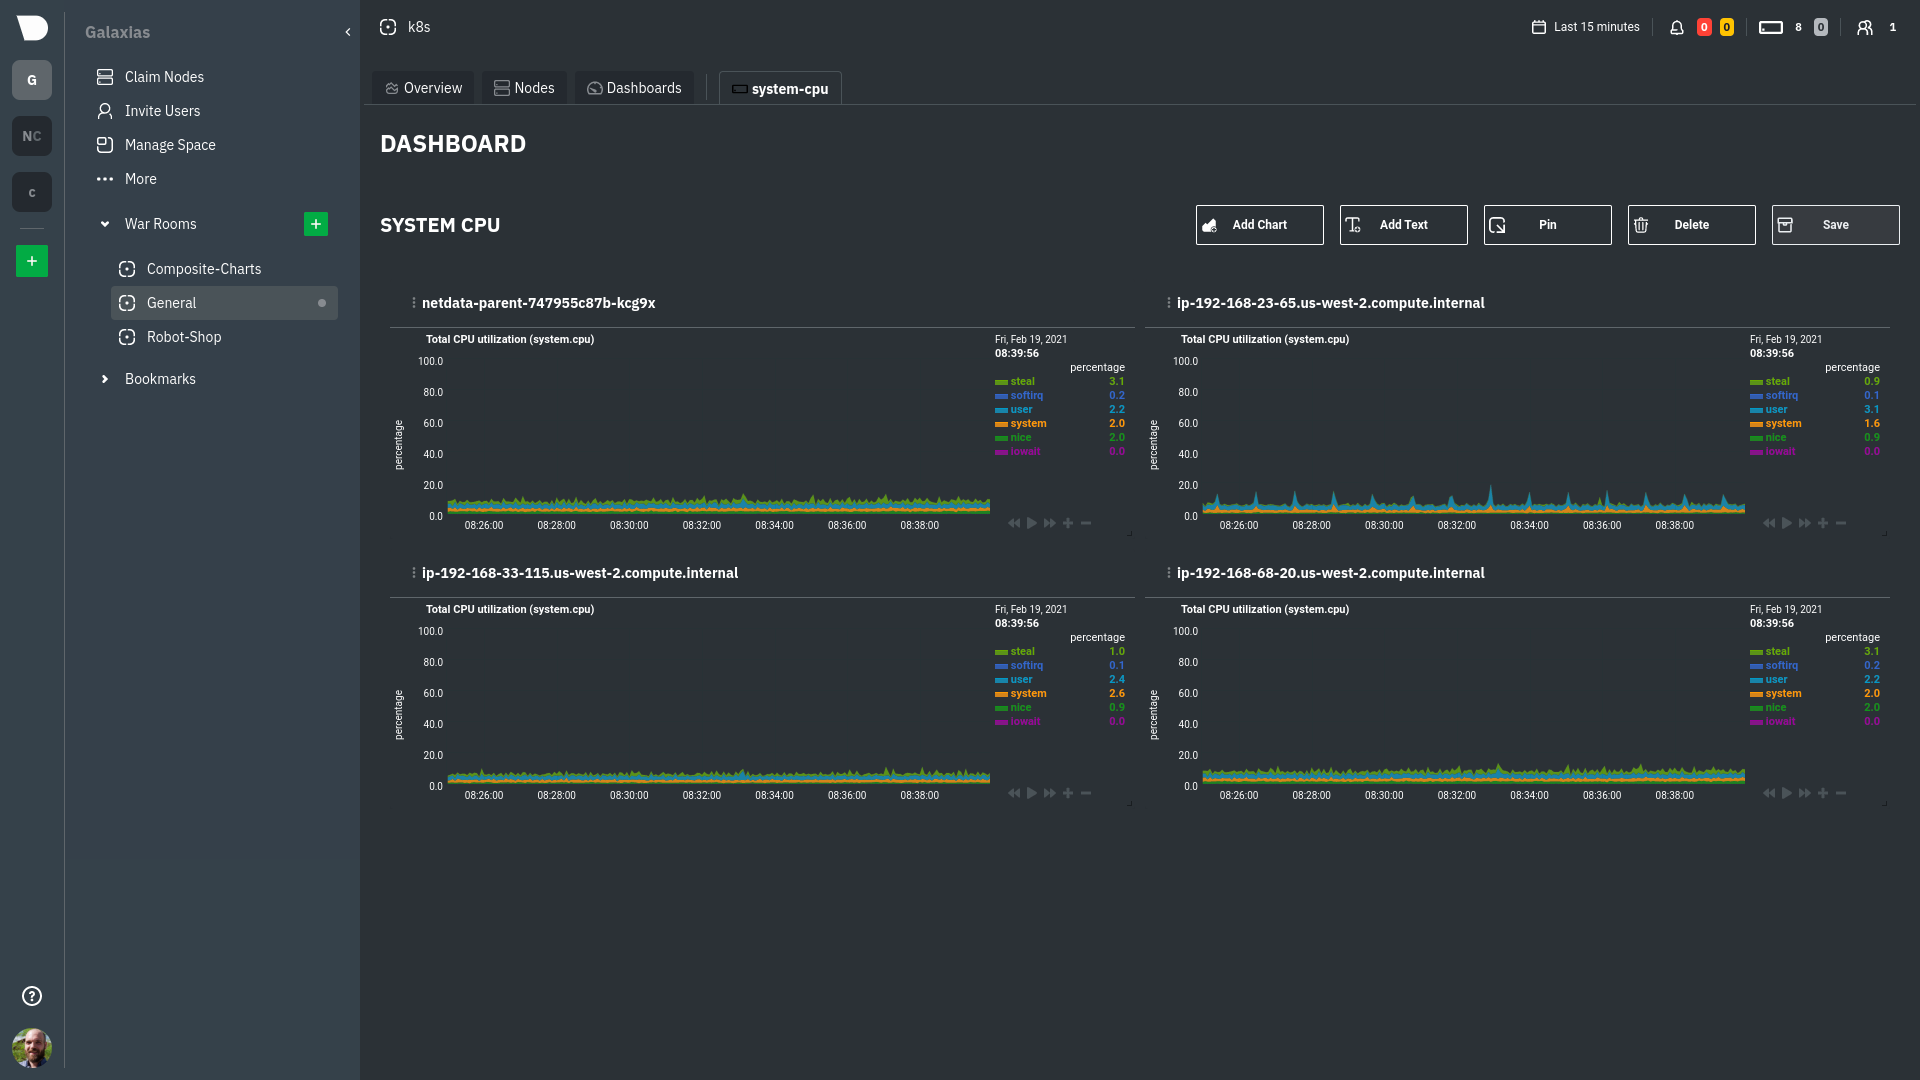 -Read more about [creating new dashboards](https://github.com/netdata/netdata/blob/master/docs/cloud/visualize/dashboards.md) for more details about the process and +Read more about [creating new dashboards](https://github.com/netdata/netdata/blob/master/docs/dashboard/dashboards-tab.md) for more details about the process and additional tips on best leveraging the feature to help you troubleshoot complex performance problems. ## Set up your nodes @@ -171,10 +171,10 @@ collect from across your infrastructure with Netdata. <Box title="Dashboards"> <BoxList> - <BoxListItemRegexLink to="[](https://github.com/netdata/netdata/blob/master/docs/cloud/visualize/overview.md)" title="Overview" /> - <BoxListItemRegexLink to="[](https://github.com/netdata/netdata/blob/master/docs/cloud/visualize/nodes.md)" title="Nodes tab" /> + <BoxListItemRegexLink to="[](https://github.com/netdata/netdata/blob/master/docs/dashboard/metrics-tab-and-single-node-tabs.md)" title="Metrics tab" /> + <BoxListItemRegexLink to="[](https://github.com/netdata/netdata/blob/master/docs/dashboard/nodes-tab.md)" title="Nodes tab" /> <BoxListItemRegexLink to="[](https://github.com/netdata/netdata/blob/master/docs/cloud/visualize/kubernetes.md)" title="Kubernetes" /> - <BoxListItemRegexLink to="[](https://github.com/netdata/netdata/blob/master/docs/cloud/visualize/dashboards.md)" title="Create new dashboards" /> + <BoxListItemRegexLink to="[](https://github.com/netdata/netdata/blob/master/docs/dashboard/dashboards-tab.md)" title="Create new dashboards" /> </BoxList> </Box> <Box @@ -206,10 +206,10 @@ collect from across your infrastructure with Netdata. - [Spaces](https://github.com/netdata/netdata/blob/master/docs/cloud/manage/organize-your-infrastrucutre-invite-your-team.md#netdata-cloud-spaces) - [War Rooms](https://github.com/netdata/netdata/blob/master/docs/cloud/manage/organize-your-infrastrucutre-invite-your-team.md#netdata-cloud-war-rooms) - Dashboards - - [Overview](https://github.com/netdata/netdata/blob/master/docs/cloud/visualize/overview.md) - - [Nodes tab](https://github.com/netdata/netdata/blob/master/docs/cloud/visualize/nodes.md) + - [Metrics tab](https://github.com/netdata/netdata/blob/master/docs/dashboard/metrics-tab-and-single-node-tabs.md) + - [Nodes tab](https://github.com/netdata/netdata/blob/master/docs/dashboard/nodes-tab.md) - [Kubernetes](https://github.com/netdata/netdata/blob/master/docs/cloud/visualize/kubernetes.md) - - [Create new dashboards](https://github.com/netdata/netdata/blob/master/docs/cloud/visualize/dashboards.md) + - [Create new dashboards](https://github.com/netdata/netdata/blob/master/docs/dashboard/dashboards-tab.md) - Alerts and notifications - [View active alerts](https://github.com/netdata/netdata/blob/master/docs/monitor/view-active-alerts.md#netdata-cloud) - [Alert notifications](https://github.com/netdata/netdata/blob/master/docs/cloud/alerts-notifications/notifications.md) |