
diff options
| author | Fotis Voutsas <fotis@netdata.cloud> | 2024-05-02 13:52:31 +0300 |
|---|---|---|
| committer | GitHub <noreply@github.com> | 2024-05-02 11:52:31 +0100 |
| commit | ea98d9a9e7875cf2dbf16af720da49321438cd86 (patch) | |
| tree | 9a34571531de1b0e313077e127b462ca68ebaf8f | |
| parent | 3a1f3e3d7e4ddeddd487bdbf6ed6ee7f550cb39b (diff) | |
Update Netdata subscription plans documentation (#17571)
* update the plans doc to reflect plans available
* update role base access model
* view plan n billing updates
* change wording
* admin wording
* update centralized cloud alerts reference doc
* remove misleading plan indication
* check links, and format files and tables
* Update plans.md
* Apply suggestions from code review
* simplify language in edited docs, make them simpler to grasp
* edits from product
* Update alerts-configuration-manager.md
* Apply suggestions from code review
Co-authored-by: Hugo Valente <82235632+hugovalente-pm@users.noreply.github.com>
---------
Co-authored-by: Ilya Mashchenko <ilya@netdata.cloud>
Co-authored-by: Shyam Sreevalsan <shyam@netdata.cloud>
Co-authored-by: Hugo Valente <82235632+hugovalente-pm@users.noreply.github.com>
| -rw-r--r-- | docs/cloud/alerts-configuration-manager.md | 86 | ||||
| -rw-r--r-- | docs/cloud/alerts-notifications/notifications.md | 132 | ||||
| -rw-r--r-- | docs/cloud/insights/events-feed.md | 79 | ||||
| -rw-r--r-- | docs/cloud/manage/plans.md | 127 | ||||
| -rw-r--r-- | docs/cloud/manage/role-based-access.md | 190 | ||||
| -rw-r--r-- | docs/cloud/manage/view-plan-billing.md | 159 | ||||
| -rw-r--r-- | docs/monitor/view-active-alerts.md | 9 | ||||
| -rw-r--r-- | integrations/cloud-authentication/metadata.yaml | 8 | ||||
| -rw-r--r-- | integrations/cloud-notifications/metadata.yaml | 48 |
9 files changed, 293 insertions, 545 deletions
diff --git a/docs/cloud/alerts-configuration-manager.md b/docs/cloud/alerts-configuration-manager.md index cedae0eb47..620764c188 100644 --- a/docs/cloud/alerts-configuration-manager.md +++ b/docs/cloud/alerts-configuration-manager.md @@ -1,71 +1,45 @@ # Creating Alerts with Netdata Alerts Configuration Manager -The Netdata Alerts Configuration Manager enables users with [Business subscriptions](https://www.netdata.cloud/pricing/) to create alerts from the Netdata Dashboard with an intuitive user interface. +The Netdata Alerts Configuration Manager enables subscribers to easily set up alerts directly from the Netdata Dashboard. More details on subscriptions can be found [here](https://www.netdata.cloud/pricing/). -## Using Alerts Configuration Manager - -1. Go to the **Metrics** tab and navigate to the chart you want to configure an alert for. - -2. Click the **Alert icon** on the top right corner of the chart. - <!--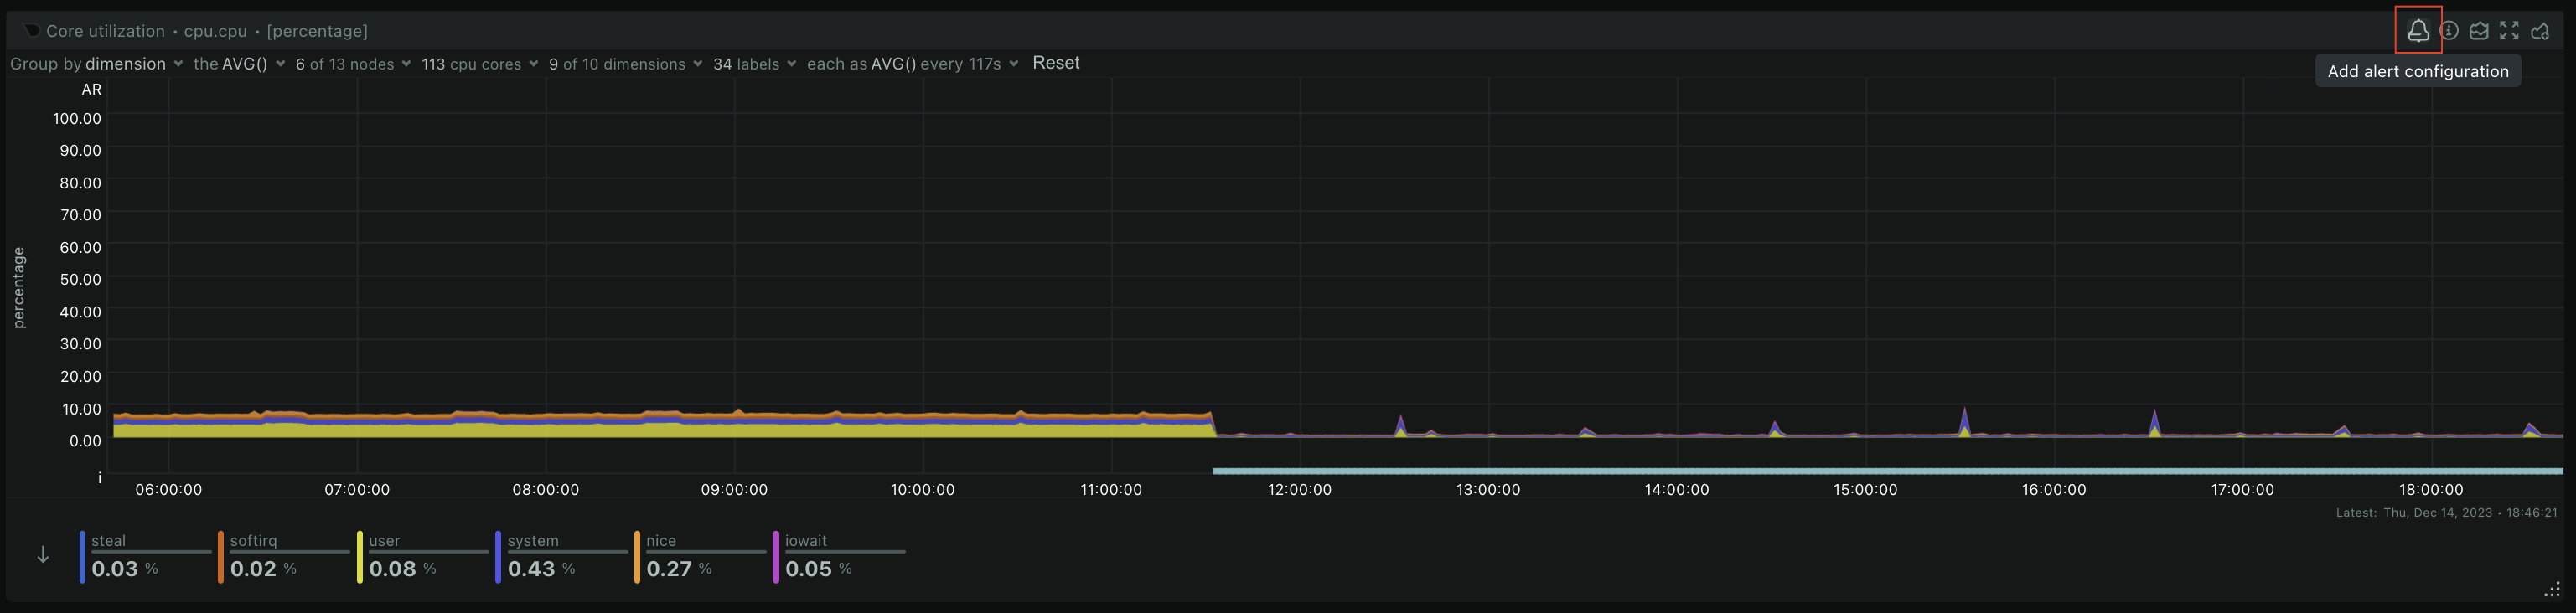--> - -3. The Alert Configuration Manager will open up with the default thresholds. You can modify the configuration as required and the alert definition on the right will be updated dynamically. - <!--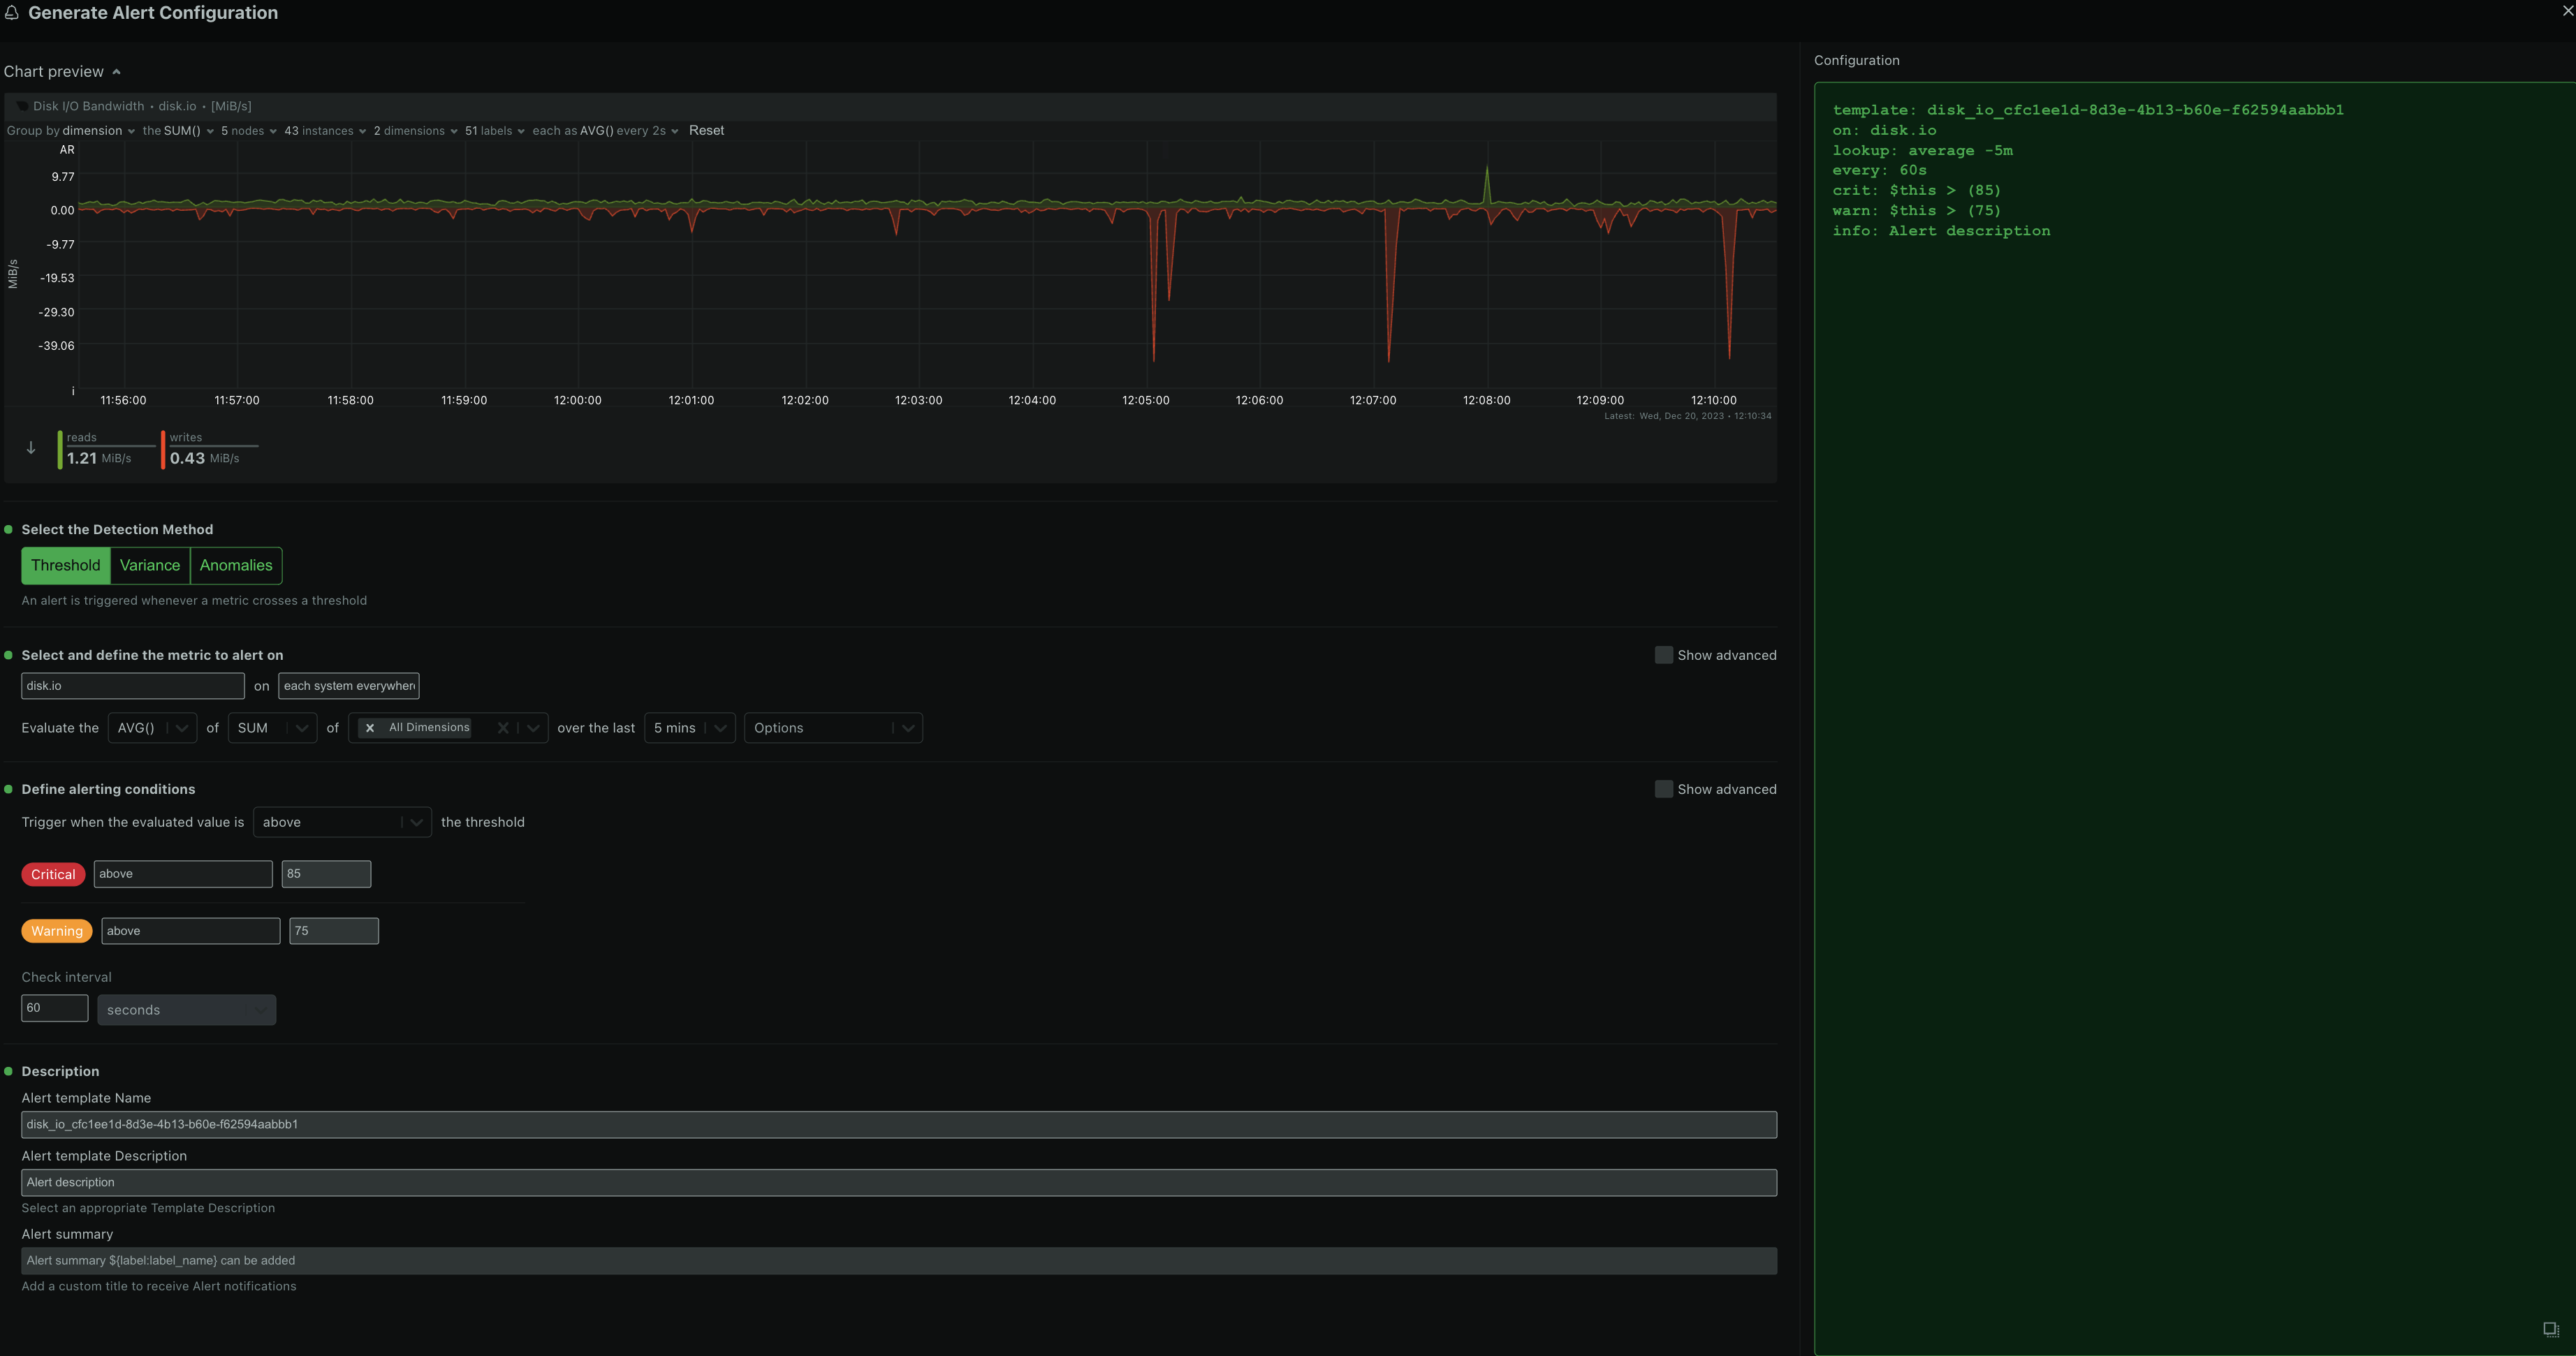--> - -4. If you want more fine-grained control or access to more advanced settings, enable **Show advanced** - <!--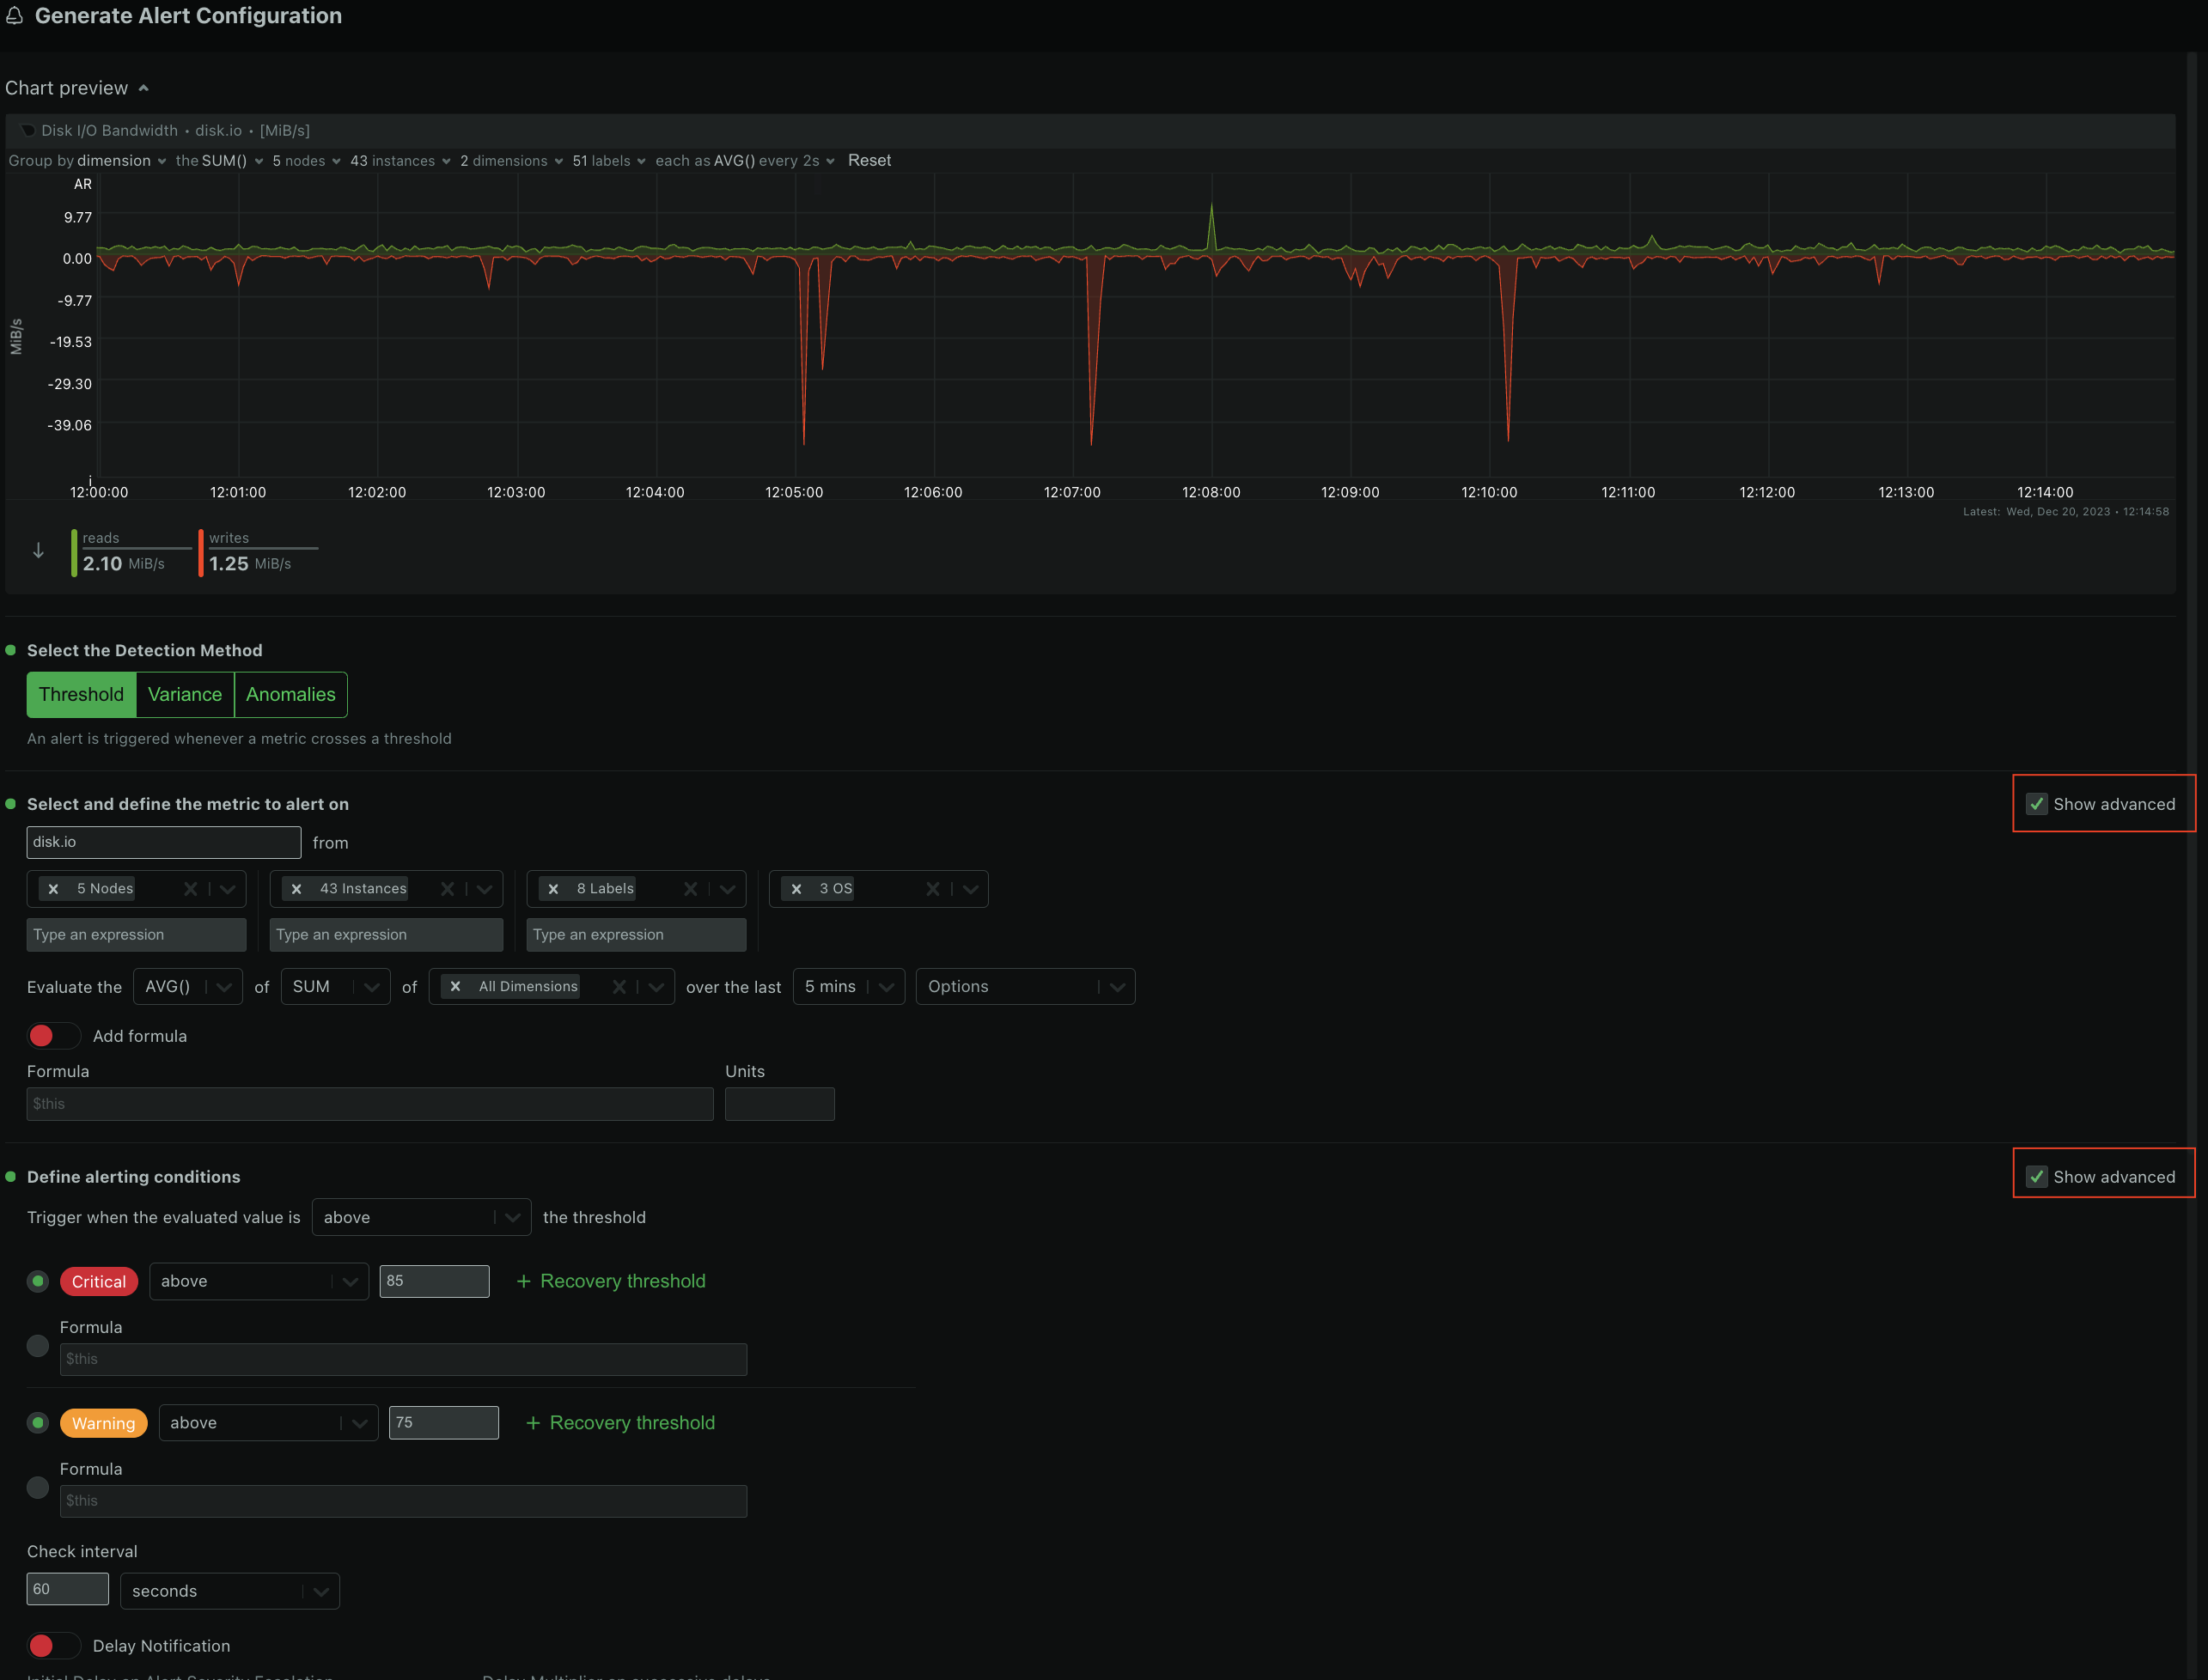--> - -5. Copy the alert definition that is generated in the code box and add it to an existing [health configuration file](https://github.com/netdata/netdata/blob/master/src/health/REFERENCE.md#edit-health-configuration-files) or a new custom file under `<path to netdata install>/etc/netdata/health.d/` on a Parent Agent or a Standalone Child Agent. - <!----> - -6. Reload Netdata Alert Health checks `<path to netdata install>/usr/sbin/netdatacli reload-health` and the new alert is now configured. +## Using the Alerts Configuration Manager +1. Navigate to the **Metrics** tab and select the chart you want to configure for alerts. +2. Click the **Alert icon** in the top right corner of the chart. +3. The Alert Configuration Manager will open, showing the default thresholds. Modify these thresholds as needed, the alert definition on the right will update automatically. +4. For additional settings, toggle **Show advanced**. +5. After configuring the alert, copy the generated alert definition from the code box. Paste this into an existing or new custom health configuration file located at `<path to netdata install>/etc/netdata/health.d/` on a Parent Agent or a Standalone Child Agent. The guide to edit health configuration files is available [here](https://github.com/netdata/netdata/blob/master/src/health/REFERENCE.md#edit-health-configuration-files). +6. To activate the new alert, run the command `<path to netdata install>/usr/sbin/netdatacli reload-health`. ## Alerts Configuration Manager Sections -- **Alert Detection Method** - <!----> - An alert is triggered whenever a metric crosses a threshold: - - Based on a standard `threshold` - - Based on metric `variance` - - Based on the `anomaly rate` of the metric - +### Alert Detection Method + +An alert is triggered whenever a metric crosses a threshold: -- **Metrics Lookup, Filtering and Formula Section** - <!----> +- **Standard Threshold**: Triggered when a metric crosses a predefined value. +- **Metric Variance**: Triggered based on the variance of the metric. +- **Anomaly Rate**: Triggered based on the anomaly rate of the metric. - - **Metrics Lookup**: This is the **Evaluate** line of fields in the modal and it defines the parameters for the database lookup that is needed to get the value that will be compared against the alert definition. It corresponds to the [`lookup`](https://github.com/netdata/netdata/blob/master/src/health/REFERENCE.md#alert-line-lookup) line of the Alert configuration file. The Alerts Configuration Manager provides a default selection for the lookup and can be modified to suit your requirements. The parameters that can be modified are: - - METHOD (`avg`, `sum`, `min`, `max`, `cv`, `stddev`) - - COMPUTATION (sum of all dimensions or individually for each dimension) - - DIMENSIONS (All dimensions, or a selection of dimensions) - - DURATION (the period in time to run the lookup) - - OPTIONS (`absolute`, `unaligned`, `percentage`, `min2max`) +### Metrics Lookup, Filtering and Formula Section - - **Alert Filtering**: This functionality can be accessed through the **Show advanced** checkbox and it allows for filtering the alert health checks to be run only for specific components of the infrastructure. It helps in achieving a fine-grained configuration for any given alert. - - `HOSTS` / `NODES` - By default all hosts are selected. You can pick nodes from the dropdown list, or enter a wildcard matching a list of hosts that you want the alert health check to run on. This field corresponds to the [`hosts`](https://github.com/netdata/netdata/blob/master/src/health/REFERENCE.md#alert-line-hosts) line of the Alert configuration file. - - `INSTANCES` - All instances are selected by default. You can pick instances from the dropdown list, or enter a wildcard matching a list of instances that you want the alert health check to run on. This field corresponds to the [`charts`](https://github.com/netdata/netdata/blob/master/src/health/REFERENCE.md#alert-line-charts) line of the Alert configuration file. - - `CHART LABELS` - All chart labels are selected by default. You can pick a chart label from the dropdown list or enter a wildcard matching a list of chart labels that you want the alert health check to run on. This field corresponds to the [`chart labels`](https://github.com/netdata/netdata/blob/master/src/health/REFERENCE.md#alert-line-chart-labels) line of the Alert configuration file. - - `OS` - All Operating Systems are selected by default. You can choose which OS(s) an alert health check should run on. This field corresponds to the [`os`](https://github.com/netdata/netdata/blob/master/src/health/REFERENCE.md#alert-line-os) line of the Alert configuration file. +You can read more about the different options in the [Alerts reference documentation](https://github.com/netdata/netdata/blob/master/src/health/REFERENCE.md) - - **Formula / Calculation**: This field is available through the **Show advanced** checkbox and it is used to define a formula to be run on top of the `lookup` value. The result of the lookup is available in the `$this` variable, and after the formula is run, the result is also stored in `$this` and can be accessed while setting the alert thresholds. This field corresponds to the [`calc`](https://github.com/netdata/netdata/blob/master/src/health/REFERENCE.md#alert-line-calc) line of the Alert configuration file. +- **Metrics Lookup**: Adjust the database lookup parameters directly in the UI, including method (`avg`, `sum`, `min`, `max`, etc.), computation style, dimensions, duration, and options like `absolute` or `percentage`. +- **Alert Filtering**: The **show advanced** checkbox allows filtering of alert health checks for specific infrastructure components. Options include selecting hosts, nodes, instances, chart labels, and operating systems. +- **Formula / Calculation**: The **show advanced** checkbox allows defining a formula for the metric value, which is then used to set alert thresholds. -- **Alerting conditions** - <!----> - - **Warning and Critical Thresholds**: These fields are used to set the thresholds for the `Warning` and `Critical` alert states, while also having the option to set the condition for the alert to be raised if it is `above` or `below` the given threshold. If the advanced settings are selected, a **formula** option can also be used, to define a custom formula instead of a threshold. These fields correspond to the [`warn` and `crit`](https://github.com/netdata/netdata/blob/master/src/health/REFERENCE.md#alert-lines-warn-and-crit) lines of the Alert configuration file. - - **Recovery Thresholds**: This field is available through the **Show advanced** checkbox, and it is used to set the threshold that the metric value needs to meet to de-escalate from a given severity status, like `Critical to Warning` and from `Warning to Clear`. The logic is appended to the `warn` and `crit` lines of the Alert configuration file and resembles a one-line `IF-THEN-ELSE` clause. - - **Check Interval**: This field is used to define the frequency of the health check for the alert and corresponds to the [`every`](https://github.com/netdata/netdata/blob/master/src/health/REFERENCE.md#alert-line-every) line of the Alert configuration file. - - **Delay Notifications**: This field is available through the **Show advanced** checkbox and it is used to set delay parameters on notifications for an alert severity `escalation` or `de-escalation`. It corresponds to the [`delay`](https://github.com/netdata/netdata/blob/master/src/health/REFERENCE.md#alert-line-delay) line of the Alert configuration file. +### Alerting Conditions - - **Agent Specific Options**: These options are only available on the `Netdata Agent` and not honored on `Netdata Cloud`. They can be accessed through the **Show advanced** checkbox. - <!----> - - **Repeat Notifications**: This field defines the repeat frequency for the alert notification when the alert is in either `warning` or `critical` status and corresponds to the [`repeat`](https://github.com/netdata/netdata/blob/master/src/health/REFERENCE.md#alert-line-repeat) line of the Alert configuration file. - - **Send to**: This field is used to define a user role to which the alert notifications will be sent. If set to `silent`, then the alert won't be sent to any role. It corresponds to the [`to`](https://github.com/netdata/netdata/blob/master/src/health/REFERENCE.md#alert-line-to) line of the Alert configuration file. - - **Custom Exec Script**: This field is used to define a custom script that will be executed when the alert is triggered (but needs to be carefully designed as it needs to call the `health_alarm_notify.sh` module) and corresponds to the [`exec`](https://github.com/netdata/netdata/blob/master/src/health/REFERENCE.md#alert-line-exec) line of the Alert configuration file. +- **Thresholds**: Set thresholds for warning and critical alert states, specifying whether the alert should trigger above or below these thresholds. Advanced settings allow for custom formulas. + - **Recovery Thresholds**: Set thresholds for downgrading the alert from critical to warning or from warning to clear. +- **Check Interval**: Define how frequently the health check should run. +- **Delay Notifications**: Manage notification delays for alert escalations or de-escalations. +- **Agent Specific Options**: Options exclusive to the Netdata Agent, like repeat notification frequencies and notification recipients. + - **Custom Exec Script**: Define custom scripts to execute when an alert triggers. -- **Alert Name, Description and Summary Section** - <!----> +### Alert Name, Description and Summary Section - - **Alert Template Name**: This field uniquely identifies an alert and corresponds to the [`template`](https://github.com/netdata/netdata/blob/master/src/health/REFERENCE.md#alert-line-alarm-or-template) field of the Alert configuration file. - The Alerts Configuration Manager provides a default name for an Alert template but we recommend you modify this to have a meaningful name for your configured alert. - - **Alert Template Description**: This field provides a brief explanation of the alert and corresponds to the [`info`](https://github.com/netdata/netdata/blob/master/src/health/REFERENCE.md#alert-line-info) line of the Alert configuration file. - - **Alert Summary**: This field enables the users to create a custom title for the alert notification (via [Notification integrations](https://learn.netdata.cloud/docs/alerting/notifications/centralized-cloud-notifications)) and corresponds to the [`summary`](https://github.com/netdata/netdata/blob/master/src/health/REFERENCE.md#alert-line-summary) line of the Alert configuration file. +- **Alert Template Name**: Provide a unique name for the alert. +- **Alert Template Description**: Offer a brief explanation of what the alert monitors. +- **Alert Summary**: Create a custom title for alert notifications, which can be integrated with centralized notification systems available [here](https://learn.netdata.cloud/docs/alerting/notifications/centralized-cloud-notifications). diff --git a/docs/cloud/alerts-notifications/notifications.md b/docs/cloud/alerts-notifications/notifications.md index 51d04e38fe..5e1257094c 100644 --- a/docs/cloud/alerts-notifications/notifications.md +++ b/docs/cloud/alerts-notifications/notifications.md @@ -1,130 +1,56 @@ -# Cloud alert notifications +# Centralized Cloud Notifications Reference -import Callout from '@site/src/components/Callout' +Netdata Cloud sends alert notifications for nodes in warning, critical, or unreachable states, ensuring alerts are managed centrally and efficiently. -Netdata Cloud can send centralized alert notifications to your team whenever a node enters a warning, critical, or -unreachable state. By enabling notifications, you ensure no alert, on any node in your infrastructure, goes unnoticed by -you or your team. +## Benefits of Centralized Notifications -Having this information centralized helps you: -* Have a clear view of the health across your infrastructure, seeing all alerts in one place. -* Easily [set up your alert notification process](https://github.com/netdata/netdata/blob/master/docs/cloud/alerts-notifications/manage-notification-methods.md): -methods to use and where to use them, filtering rules, etc. -* Quickly troubleshoot using [Metric Correlations](https://github.com/netdata/netdata/blob/master/docs/cloud/insights/metric-correlations.md) -or [Anomaly Advisor](https://github.com/netdata/netdata/blob/master/docs/dashboard/anomaly-advisor-tab.md) +- Consolidate health status views across all infrastructure in one place. +- Set up and [manage your alert notifications easily](https://github.com/netdata/netdata/blob/master/docs/cloud/alerts-notifications/manage-notification-methods.md). +- Expedite troubleshooting with tools like [Metric Correlations](https://github.com/netdata/netdata/blob/master/docs/cloud/insights/metric-correlations.md) and the [Anomaly Advisor](https://github.com/netdata/netdata/blob/master/docs/dashboard/anomaly-advisor-tab.md). -If a node is getting disconnected often or has many alerts, we protect you and your team from alert fatigue by sending -you a flood protection notification. Getting one of these notifications is a good signal of health or performance issues -on that node. +To avoid notification overload, **flood protection** is triggered when a node frequently disconnects or sends excessive alerts, highlighting potential issues. -Admins must enable alert notifications for their [Space(s)](https://github.com/netdata/netdata/blob/master/docs/cloud/alerts-notifications/manage-notification-methods.md#manage-space-notification-settings). All users in a -Space can then personalize their notifications settings from within their [account -menu](https://github.com/netdata/netdata/blob/master/docs/cloud/alerts-notifications/#manage-user-notification-settings). +Admins must [enable alert notifications](https://github.com/netdata/netdata/blob/master/docs/cloud/alerts-notifications/manage-notification-methods.md#manage-space-notification-settings) for their Space(s). All users can then customize their notification preferences through their [account menu](https://github.com/netdata/netdata/blob/master/docs/cloud/alerts-notifications/#manage-user-notification-settings). -<Callout type="notice"> +> **Note** +> +> Centralized alerts in Netdata Cloud are separate from the [Netdata Agent](https://github.com/netdata/netdata/blob/master/docs/monitor/enable-notifications.md) notifications. Alerts must be [configured individually](https://github.com/netdata/netdata/blob/master/src/health/REFERENCE.md) on each node. -Centralized alert notifications from Netdata Cloud is a independent process from [notifications from -Netdata](https://github.com/netdata/netdata/blob/master/docs/monitor/enable-notifications.md). You can enable one or the other, or both, based on your needs. However, -the alerts you see in Netdata Cloud are based on those streamed from your Netdata-monitoring nodes. If you want to tweak -or add new alert that you see in Netdata Cloud, and receive via centralized alert notifications, you must -[configure](https://github.com/netdata/netdata/blob/master/src/health/REFERENCE.md) each node's alert watchdog. +## Alert Notifications -</Callout> +Notifications can be sent via email or through third-party services like PagerDuty or Slack. Admins manage notification settings for the entire Space, while individual users can personalize settings in their profile. -## Alert notifications - -Netdata Cloud can send centralized alert notifications to your team whenever a node enters a warning, critical, or unreachable state. By enabling notifications, -you ensure no alert, on any node in your infrastructure, goes unnoticed by you or your team. - -If a node is getting disconnected often or has many alerts, we protect you and your team from alert fatigue by sending you a flood protection notification. -Getting one of these notifications is a good signal of health or performance issues on that node. - -Alert notifications can be delivered through different methods, these can go from an Email sent from Netdata to the use of a 3rd party tool like PagerDuty. - -Notification methods are classified on two main attributes: -* Service level: Personal or System -* Service classification: Community or Business - -Only administrators are able to manage the space's alert notification settings. -All users in a Space can personalize their notifications settings, for Personal service level notification methods, from within their profile menu. - -> ⚠️ Netdata Cloud supports different notification methods and their availability will depend on the plan you are at. -> For more details check [Service classification](#service-classification) or [netdata.cloud/pricing](https://www.netdata.cloud/pricing). - -### Service level +### Service Level #### Personal -The notifications methods classified as **Personal** are what we consider generic, meaning that these can't have specific rules for them set by the administrators. - -These notifications are sent to the destination of the channel which is a user-specific attribute, e.g. user's e-mail, and the users are the ones that will then be able to -manage what specific configurations they want for the Space / Room(s) and the desired Notification level, they can achieve this from their User Profile page under -**Notifications**. - -One example of such a notification method is the E-mail. +Notifications are sent to user-specific destinations, such as email, which are managed by users under their profile settings. #### System -For **System** notification methods, the destination of the channel will be a target that usually isn't specific to a single user, e.g. slack channel. - -These notification methods allow for fine-grain rule settings to be done by administrators and more than one configuration can exist for them since. You can specify -different targets depending on Rooms or Notification level settings. - -Some examples of such notification methods are: Webhook, PagerDuty, Slack. +These notifications go to general targets like a Slack channel, with admins setting rules for notification targets based on workspace or alert level. -### Service classification +### Service Classification #### Community -Notification methods classified as Community can be used by everyone independent on the plan your space is at. -These are: Email and discord - -#### Pro - -Notification methods classified as Pro are only available for **Pro** and **Business** plans -These are: webhook +Available to all plans, includes basic methods like Email and Discord. #### Business -Notification methods classified as Business are only available for **Business** plans -These are: PagerDuty, Slack, Opsgenie - -## Silencing Alert notifications - -Netdata Cloud provides you a Silencing Rule engine which allows you to mute alert notifications. This muting action is specific to alert state transition notifications, it doesn't include node unreachable state transitions. - -The Silencing Rule engine is flexible and allows you to enter silence rules for the two main entities involved on alert notifications and can be set using different attributes. The main entities you can enter are **Nodes** and **Alerts** which can be used in combination or isolation to target specific needs - see some examples [here](https://github.com/netdata/netdata/blob/master/docs/cloud/alerts-notifications/manage-alert-notification-silencing-rules.md#silencing-rules-examples). - -### Scope definition for Nodes -* **Space:** silencing the space, selecting `All Rooms`, silences all alert state transitions from any node claimed to the space. -* **War Room:** silencing a specific room will silence all alert state transitions from any node in that room. Please note if the node belongs to -another room which isn't silenced it can trigger alert notifications to the users with membership to that other room. -* **Node:** silencing a specific node can be done for the entire space, selecting `All Rooms`, or for specific war room(s). The main difference is -if the node should be silenced for the entire space or just for specific rooms (when specific rooms are selected only users with membership to that room won't receive notifications). +Exclusive to [paid plans](https://github.com/netdata/netdata/blob/master/docs/cloud/manage/plans.md), includes advanced services like PagerDuty and Slack. -### Scope definition for Alerts -* **Alert name:** silencing a specific alert name silences all alert state transitions for that specific alert. -* **Alert context:** silencing a specific alert context will silence all alert state transitions for alerts targeting that chart context, for more details check [alert configuration docs](https://github.com/netdata/netdata/blob/master/src/health/REFERENCE.md#alert-line-on). -* **Alert role:** silencing a specific alert role will silence all the alert state transitions for alerts that are configured to be specific role recipients, for more details check [alert configuration docs](https://github.com/netdata/netdata/blob/master/src/health/REFERENCE.md#alert-line-to). +## Alert Notification Silencing Rules -Beside the above two main entities there are another two important settings that you can define on a silencing rule: -* Who does the rule affect? **All user** in the space or **Myself** -* When does is to apply? **Immediately** or on a **Schedule** (when setting immediately you can set duration) +Netdata Cloud offers a silencing rule engine to mute alert notifications based on specific conditions related to nodes or alert types. Learn how to manage these settings [here](https://github.com/netdata/netdata/blob/master/docs/cloud/alerts-notifications/manage-alert-notification-silencing-rules.md). -For further help on setting alert notification silencing rules go to [Manage Alert Notification Silencing Rules](https://github.com/netdata/netdata/blob/master/docs/cloud/alerts-notifications/manage-alert-notification-silencing-rules.md). +## Flood Protection -> ⚠️ This feature is only available for [Netdata paid plans](https://github.com/netdata/netdata/edit/master/docs/cloud/manage/plans.md). +If a node repeatedly changes state or fires alerts, flood protection limits notifications to prevent overload. You can still access node details through Netdata Cloud or directly via the local Agent dashboard. -## Flood protection +## Anatomy of an Email Alert Notification -If a node has too many state changes like firing too many alerts or going from reachable to unreachable, Netdata Cloud -enables flood protection. As long as a node is in flood protection mode, Netdata Cloud does not send notifications about -this node. Even with flood protection active, it is possible to access the node directly, either via Netdata Cloud or -the local Agent dashboard at `http://NODE:19999`. - -## Anatomy of an alert notification - -Email alert notifications show the following information: +Email notifications provide comprehensive details: - The Space's name - The node's name @@ -138,10 +64,4 @@ Email alert notifications show the following information: - Threshold for triggering the given alert state - Calculation or database lookups that Netdata uses to compute the value - Source of the alert, including which file you can edit to configure this alert on an individual node - -Email notifications also feature a **Go to Node** button, which takes you directly to the offending chart for that node -within Cloud's embedded dashboards. - -Here's an example email notification for the `ram_available` chart, which is in a critical state: - -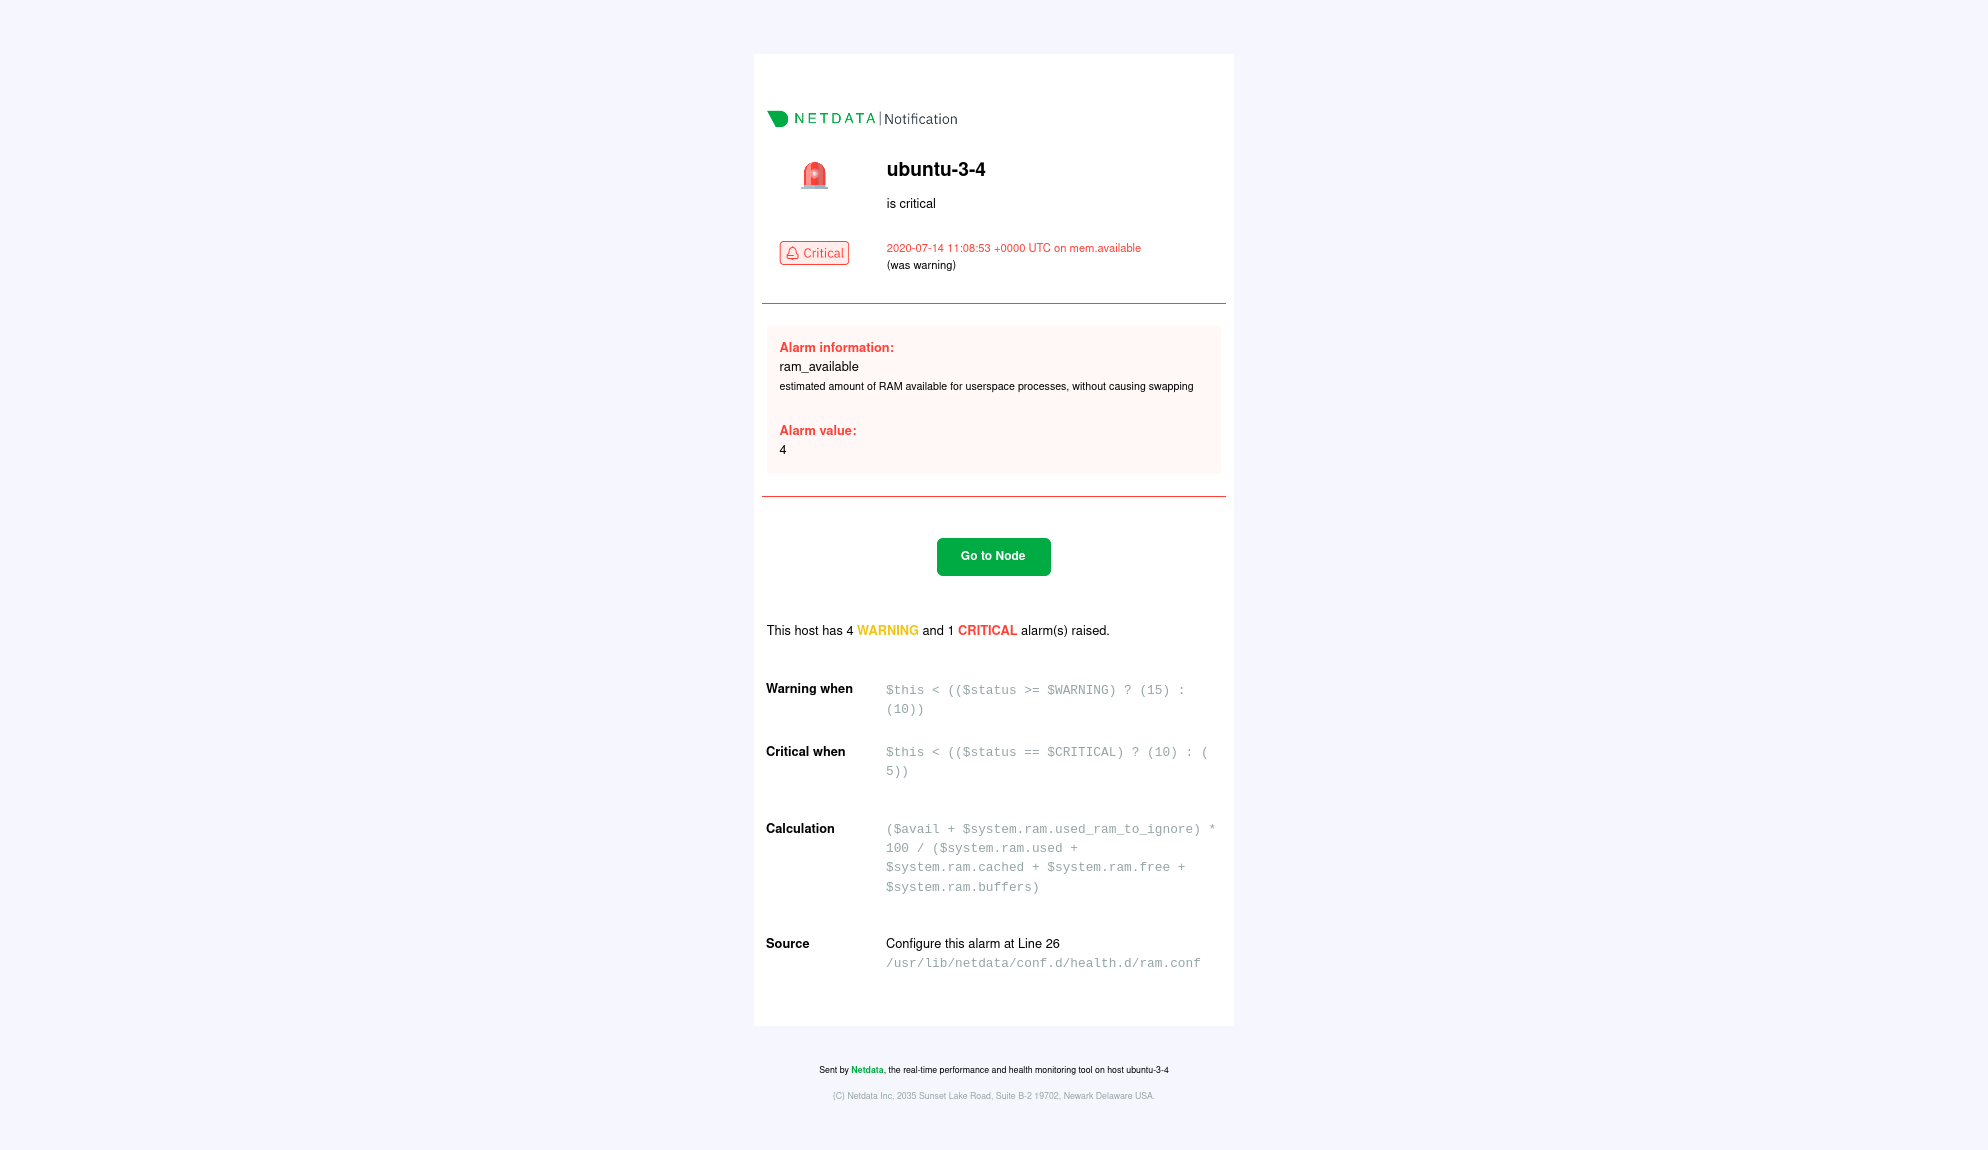 +- Direct link to the node’s chart in Cloud dashboards. diff --git a/docs/cloud/insights/events-feed.md b/docs/cloud/insights/events-feed.md index b0cfb3f7d5..1aa0b08a18 100644 --- a/docs/cloud/insights/events-feed.md +++ b/docs/cloud/insights/events-feed.md @@ -10,55 +10,54 @@ At a high-level view, these are the domains from which the Events feed will prov > > Based on your space's plan, different allowances are defined to query past data. -| **Domains of events** | **Community** | **Business** | -| :-- | :-- | :-- | -| **[Auditing events](#auditing-events)** - <br/>Events related to actions done on your Space, e.g. invite user, change user role or change plan.| 4 hours | 90 days | -| **[Topology events](#topology-events)**<br/>Node state transition events, e.g. live or offline.| 4 hours | 14 days | -| **[Alert events](#alert-events)**<br/>Alert state transition events, can be seen as an alert history log.| 4 hours | 90 days | +| **Domains of events** | **Community** | **Homelab** | **Business** | **Enterprise On-Premise** | +|:------------------------------------------------------------------------------------------------------------------------------------------------|:--------------|:------------|:-------------|:--------------------------| +| **[Auditing events](#auditing-events)** <p>Events related to actions done on your Space, e.g. invite user, change user role or change plan.</p> | 4 hours | 90 days | 90 days | User dependent | +| **[Topology events](#topology-events)** <p>Node state transition events, e.g. live or offline.</p> | 4 hours | 14 days | 14 days | User dependent | +| **[Alert events](#alert-events)** <p>Alert state transition events, can be seen as an alert history log.</p> | 4 hours | 90 days | 90 days | User dependent | ### Auditing events -| **Event name** | **Description** | **Example** | -| :-- | :-- | :-- | -| Space Created | The space was created.| Space `Acme Space` was **created** | -| Room Created | A room was created on the Space.| Room `DB Servers` was **created** by `John Doe` | -| Room Deleted | A room was deleted from the Space. | Room `DB servers` was **deleted** by `John Doe` | -| User Invited to Space | A user was invited to join the Space.| User `John Smith` was **invited** to this space by `Alan Doe` | -| User Uninvited from Space | An invitation for a user to join the space was revoked.| User `John Smith` was **uninvited** from this space | -| User Added to Space | A user was added to the Space from an invitation (user accepted the invitation).| User `John Smith` was **added** to this space by invite of `Alan Doe` | -| User Removed from Space | A user was added to the Space from an invitation. | User `John Smith` was **removed** from this space by `Alan Doe` | -| User Added to Room | A user was added to a room on the Space. | User `John Smith` was **added** to room `DB servers` | -| User Removed from Room | A user was removed from a room on the Space. | User `John Smith` was **removed** from room `DB Servers` by `Alan Doe` | -| User Space Properties Changed | The properties of a user on the Space have changed, e.g. change user role | User role for `John Smith` was **changed** to `troubleshooter` by `Alan Doe` | -| Node Added To Room | The node was added to a room on the Space. | Node `ip-xyz.ec2.internal` was **added** to room `DB Servers` by `John Doe` | -| Node Removed To Room | The node was removed from a room on the Space. | Node `ip-xyz.ec2.internal` was **removed** from room `DB Servers` by `John Doe` | -| Silencing Rule Created | A new alert notification silencing rule was created on the Space. | Silencing rule `DB Servers schedule silencing` on rooms `All nodes` and `DB Servers` was **created** by `John Smith` | -| Silencing Rule Changed | An existing alert notification silencing rule was modified on the Space. | Silencing rule `DB Servers schedule silencing` on rooms `All nodes` and `DB Servers` was **changed** by `John Doe` | -| Silencing Rule Deleted | An existing alert notifications silencing rule was removed from the Space. | Silencing rule `DB Servers schedule silencing` on rooms `All nodes` and `DB Servers` was **changed** by `Alan Smith` | -| Space Claiming Token Created | A Space Claiming Token was created. | Claiming Token was created by user `John Doe` | -| Space Claiming Token Revoked | A Space Claiming Token was revoked. | Claiming Token `_OtF2ssjrv` was revoked by user `John Doe` | +| **Event name** | **Description** | **Example** | +|:------------------------------|:---------------------------------------------------------------------------------|:---------------------------------------------------------------------------------------------------------------------| +| Space Created | The space was created. | Space `Acme Space` was **created** | +| Room Created | A room was created on the Space. | Room `DB Servers` was **created** by `John Doe` | +| Room Deleted | A room was deleted from the Space. | Room `DB servers` was **deleted** by `John Doe` | +| User Invited to Space | A user was invited to join the Space. | User `John Smith` was **invited** to this space by `Alan Doe` | +| User Uninvited from Space | An invitation for a user to join the space was revoked. | User `John Smith` was **uninvited** from this space | +| User Added to Space | A user was added to the Space from an invitation (user accepted the invitation). | User `John Smith` was **added** to this space by invite of `Alan Doe` | +| User Removed from Space | A user was added to the Space from an invitation. | User `John Smith` was **removed** from this space by `Alan Doe` | +| User Added to Room | A user was added to a room on the Space. | User `John Smith` was **added** to room `DB servers` | +| User Removed from Room | A user was removed from a room on the Space. | User `John Smith` was **removed** from room `DB Servers` by `Alan Doe` | +| User Space Properties Changed | The properties of a user on the Space have changed, e.g. change user role | User role for `John Smith` was **changed** to `troubleshooter` by `Alan Doe` | +| Node Added To Room | The node was added to a room on the Space. | Node `ip-xyz.ec2.internal` was **added** to room `DB Servers` by `John Doe` | +| Node Removed To Room | The node was removed from a room on the Space. | Node `ip-xyz.ec2.internal` was **removed** from room `DB Servers` by `John Doe` | +| Silencing Rule Created | A new alert notification silencing rule was created on the Space. | Silencing rule `DB Servers schedule silencing` on rooms `All nodes` and `DB Servers` was **created** by `John Smith` | +| Silencing Rule Changed | An existing alert notification silencing rule was modified on the Space. | Silencing rule `DB Servers schedule silencing` on rooms `All nodes` and `DB Servers` was **changed** by `John Doe` | +| Silencing Rule Deleted | An existing alert notifications silencing rule was removed from the Space. | Silencing rule `DB Servers schedule silencing` on rooms `All nodes` and `DB Servers` was **changed** by `Alan Smith` | +| Space Claiming Token Created | A Space Claiming Token was created. | Claiming Token was created by user `John Doe` | +| Space Claiming Token Revoked | A Space Claiming Token was revoked. | Claiming Token `_OtF2ssjrv` was revoked by user `John Doe` | ### Topology events -| **Event name** | **Description** | **Example** | -| :-- | :-- | :-- | -| Node Became Live | The node is collecting and streaming metrics to Cloud.| Node `netdata-k8s-state-xyz` was **live** | -| Node Became Stale | The node is offline and not streaming metrics to Cloud. It can show historical data from a parent node. | Node `ip-xyz.ec2.internal` was **stale** | -| Node Became Offline | The node is offline, not streaming metrics to Cloud and not available in any parent node.| Node `ip-xyz.ec2.internal` was **offline** | -| Node Created | The node is created but it is still `Unseen` on Cloud, didn't establish a successful connection yet.| Node `ip-xyz.ec2.internal` was **created** | -| Node Removed |The node was removed from the Space, for example by using the `Delete` action on the node. This is a soft delete in that the node gets marked as deleted, but retains the association with this space. If it becomes live again, it will be restored (see `Node Restored` below) and reappear in this space as before. | Node `ip-xyz.ec2.internal` was **deleted (soft)** | -| Node Restored | The node was restored. See `Node Removed` above. | Node `ip-xyz.ec2.internal` was **restored** | -| Node Deleted | The node was deleted from the Space. This is a hard delete and no information on the node is retained. | Node `ip-xyz.ec2.internal` was **deleted (hard)** | -| Agent Connected | The agent connected to the Cloud MQTT server (Agent-Cloud Link established).<br/>These events can only be seen on _All nodes_ War Room. | Agent with claim ID `7d87bqs9-cv42-4823-8sd4-3614548850c7` has connected to Cloud. | -| Agent Disconnected | The agent disconnected from the Cloud MQTT server (Agent-Cloud Link severed).<br/>These events can only be seen on _All nodes_ War Room. | Agent with claim ID `7d87bqs9-cv42-4823-8sd4-3614548850c7` has disconnected from Cloud: **Connection Timeout**. | -| Space Statistics | Daily snapshot of space node statistics.<br/>These events can only be seen on _All nodes_ War Room. | Space statistics. Nodes: **22 live**, **21 stale**, **18 removed**, **61 total**. | - +| **Event name** | **Description** | **Example** | +|:--------------------|:-----------------------------------------------------------------------------------------------------------------------------------------------------------------------------------------------------------------------------------------------------------------------------------------------------------------------|:----------------------------------------------------------------------------------------------------------------| +| Node Became Live | The node is collecting and streaming metrics to Cloud. | Node `netdata-k8s-state-xyz` was **live** | +| Node Became Stale | The node is offline and not streaming metrics to Cloud. It can show historical data from a parent node. | Node `ip-xyz.ec2.internal` was **stale** | +| Node Became Offline | The node is offline, not streaming metrics to Cloud and not available in any parent node. | Node `ip-xyz.ec2.internal` was **offline** | +| Node Created | The node is created but it is still `Unseen` on Cloud, didn't establish a successful connection yet. | Node `ip-xyz.ec2.internal` was **created** | +| Node Removed | The node was removed from the Space, for example by using the `Delete` action on the node. This is a soft delete in that the node gets marked as deleted, but retains the association with this space. If it becomes live again, it will be restored (see `Node Restored` below) and reappear in this space as before. | Node `ip-xyz.ec2.internal` was **deleted (soft)** | +| Node Restored | The node was restored. See `Node Removed` above. | Node `ip-xyz.ec2.internal` was **restored** | +| Node Deleted | The node was deleted from the Space. This is a hard delete and no information on the node is retained. | Node `ip-xyz.ec2.internal` was **deleted (hard)** | +| Agent Connected | The agent connected to the Cloud MQTT server (Agent-Cloud Link established).<br/>These events can only be seen on _All nodes_ War Room. | Agent with claim ID `7d87bqs9-cv42-4823-8sd4-3614548850c7` has connected to Cloud. | +| Agent Disconnected | The agent disconnected from the Cloud MQTT server (Agent-Cloud Link severed).<br/>These events can only be seen on _All nodes_ War Room. | Agent with claim ID `7d87bqs9-cv42-4823-8sd4-3614548850c7` has disconnected from Cloud: **Connection Timeout**. | +| Space Statistics | Daily snapshot of space node statistics.<br/>These events can only be seen on _All nodes_ War Room. | Space statistics. Nodes: **22 live**, **21 stale**, **18 removed**, **61 total**. | ### Alert events -| **Event name** | **Description** | **Example** | -| :-- | :-- | :-- | -| Node Alert State Changed | These are node alert state transition events and can be seen as an alert history log. You will be able to see transitions to or from any of these states: Cleared, Warning, Critical, Removed, Error or Unknown | Transition to Cleared:<br/>`httpcheck_web_service_bad_status` for `httpcheck_netdata_cloud.request_status` on `netdata-parent-xyz` recovered with value **8.33%**<br/><br/>Transition from Cleared to Warning or Critical:<br/>`httpcheck_web_service_bad_statu |