
diff options
| author | Chris Akritidis <43294513+cakrit@users.noreply.github.com> | 2023-02-25 08:57:14 -0800 |
|---|---|---|
| committer | GitHub <noreply@github.com> | 2023-02-25 08:57:14 -0800 |
| commit | 753fabbc6acddb9cf59bfbca44a55f63d35a39a8 (patch) | |
| tree | cc1397b688bb53d32c48f567e38adc68ac923d76 | |
| parent | de52f8adef9c12d10a319f85220173dd4de050a1 (diff) | |
Fix links to chart interactions (#14609)
| -rw-r--r-- | collectors/README.md | 2 | ||||
| -rw-r--r-- | docs/cloud/alerts-notifications/view-active-alerts.md | 31 | ||||
| -rw-r--r-- | docs/cloud/war-rooms.md | 2 | ||||
| -rw-r--r-- | docs/dashboard/customize.md | 22 | ||||
| -rw-r--r-- | docs/dashboard/dimensions-contexts-families.md | 34 | ||||
| -rw-r--r-- | docs/dashboard/how-dashboard-works.md | 4 | ||||
| -rw-r--r-- | docs/dashboard/import-export-print-snapshot.md | 16 | ||||
| -rw-r--r-- | docs/dashboard/visualization-date-and-time-controls.md | 4 | ||||
| -rw-r--r-- | docs/guides/monitor/lamp-stack.md | 5 | ||||
| -rw-r--r-- | docs/metrics-storage-management/how-streaming-works.md | 26 | ||||
| -rw-r--r-- | packaging/installer/README.md | 13 | ||||
| -rw-r--r-- | web/server/README.md | 2 |
12 files changed, 33 insertions, 128 deletions
diff --git a/collectors/README.md b/collectors/README.md index 5fcddba9d1..5454a3152a 100644 --- a/collectors/README.md +++ b/collectors/README.md @@ -34,7 +34,7 @@ If the collector finds compatible metrics exposed on the configured endpoint, it Netdata Agent gathers these metrics, sends them to the [database engine for storage](https://github.com/netdata/netdata/blob/master/docs/store/change-metrics-storage.md) , and immediately -[visualizes them meaningfully](https://github.com/netdata/netdata/blob/master/docs/dashboard/interact-charts.md) +[visualizes them meaningfully](https://github.com/netdata/netdata/blob/master/docs/cloud/visualize/interact-new-charts.md) on dashboards. Each collector comes with a pre-defined configuration that matches the default setup for that application. This endpoint diff --git a/docs/cloud/alerts-notifications/view-active-alerts.md b/docs/cloud/alerts-notifications/view-active-alerts.md index 7b8fdf55c0..ba318daa06 100644 --- a/docs/cloud/alerts-notifications/view-active-alerts.md +++ b/docs/cloud/alerts-notifications/view-active-alerts.md @@ -1,15 +1,4 @@ -<!-- -title: "View active alerts" -description: >- - "Track the health of your infrastructure in one place by taking advantage of the powerful health monitoring - watchdog running on every node." -type: "how-to" -custom_edit_url: "https://github.com/netdata/netdata/blob/master/docs/cloud/alerts-notifications/view-active-alerts.md" -sidebar_label: "View active alerts" -learn_status: "Published" -learn_topic_type: "Tasks" -learn_rel_path: "Integrations/Notify/Cloud alert notifications" ---> +# View active alerts Netdata Cloud receives information about active alerts on individual nodes in your infrastructure and updates the interface based on those status changes. @@ -50,7 +39,7 @@ moment your node triggered this alert. 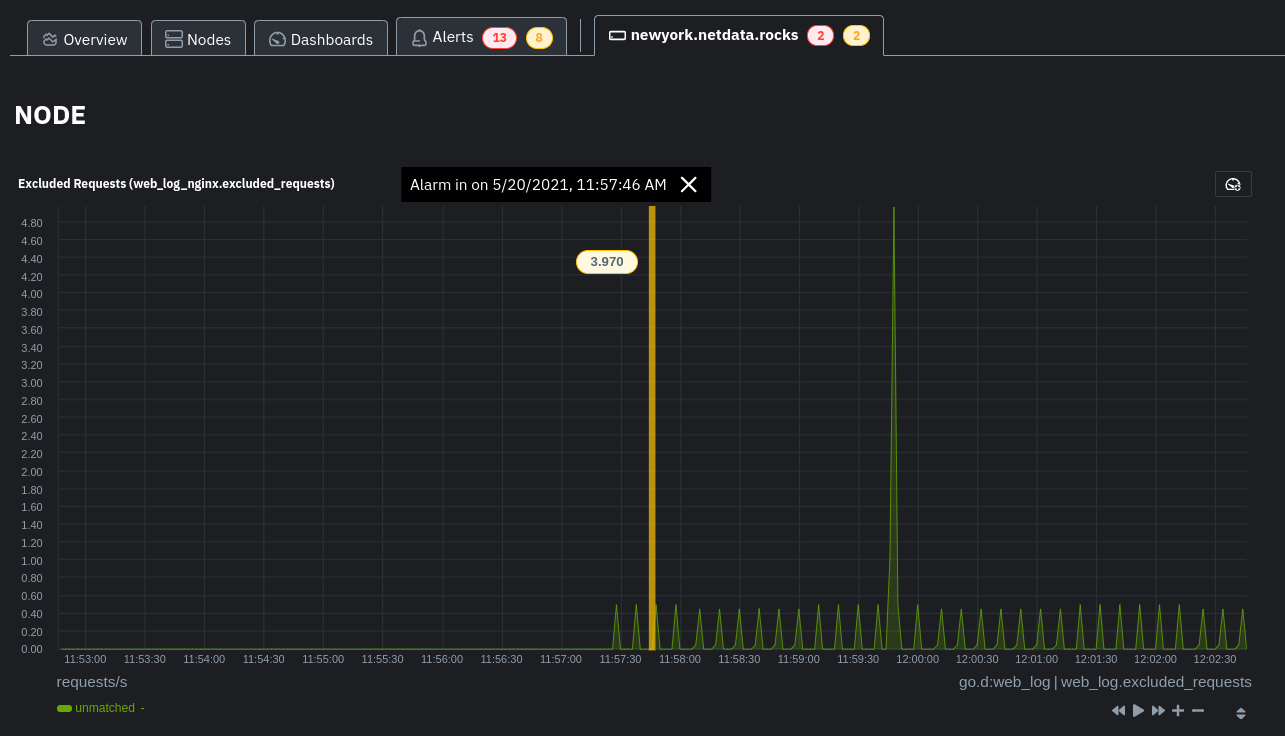 You can -then [select this area](https://github.com/netdata/netdata/blob/master/docs/dashboard/interact-charts.md#select) +then [highlight this area](https://github.com/netdata/netdata/blob/master/docs/cloud/visualize/interact-new-charts.md#highlight) with `Alt/⌘ + mouse selection` to highlight the alerted timeframe while you explore other charts for root cause analysis. @@ -58,19 +47,3 @@ Or, select the area and run [Metric Correlations](https://github.com/netdata/netdata/blob/master/docs/cloud/insights/metric-correlations.md) to filter the single-node dashboard to only those charts most likely to be connected to the alert. - -## What's next? - -Learn more about the features of the Smartboard in -its [reference](https://github.com/netdata/netdata/blob/master/docs/cloud/alerts-notifications/smartboard.md) -doc. To stay notified of active alerts, -enable [centralized alert notifications](https://github.com/netdata/netdata/blob/master/docs/cloud/alerts-notifications/notifications.md) -from Netdata Cloud. - -If you're through with setting up alerts, it might be time -to [invite your team](https://github.com/netdata/netdata/blob/master/docs/cloud/manage/invite-your-team.md). - -Check out our recommendations on organizing and -using [Spaces](https://github.com/netdata/netdata/blob/master/docs/cloud/spaces.md) and -[War Rooms](https://github.com/netdata/netdata/blob/master/docs/cloud/war-rooms.md) to streamline your processes once -you find an alert in Netdata Cloud. diff --git a/docs/cloud/war-rooms.md b/docs/cloud/war-rooms.md index bd26ddbf4c..4207df9e96 100644 --- a/docs/cloud/war-rooms.md +++ b/docs/cloud/war-rooms.md @@ -69,7 +69,7 @@ can always come right back to your preferred setup. A War Room has three different states: playing, paused, and force playing. The default playing state refreshes charts every second as long as the browser tab is in -focus. [Interacting with a chart](https://github.com/netdata/netdata/blob/master/docs/dashboard/interact-charts.md) +focus. [Interacting with a chart](https://github.com/netdata/netdata/blob/master/docs/cloud/visualize/interact-new-charts.md) pauses the War Room. Once the tab loses focus, charts pause automatically. diff --git a/docs/dashboard/customize.md b/docs/dashboard/customize.md index f353eaad77..6a3ff79d76 100644 --- a/docs/dashboard/customize.md +++ b/docs/dashboard/customize.md @@ -18,8 +18,8 @@ thousands of metrics, you may want to alter your experience based on a particula ## Dashboard settings -To change dashboard settings, click the on the **settings** icon  +To change dashboard settings, click the on the **settings** icon + in the top panel. These settings only affect how the dashboard behaves in your browser. They take effect immediately and are permanently @@ -30,7 +30,8 @@ Here are a few popular settings: ### Change chart legend position -Find this setting under the **Visual** tab. By default, Netdata places the [legend of dimensions](https://github.com/netdata/netdata/blob/master/docs/dashboard/dimensions-contexts-families.md#dimension) _below_ charts. +Find this setting under the **Visual** tab. By default, Netdata places the +[legend of dimensions](https://github.com/netdata/netdata/blob/master/docs/dashboard/dimensions-contexts-families.md#dimension) _below_ charts. Click this toggle to move the legend to the _right_ of charts. @@ -82,18 +83,3 @@ the following line to the `[web]` section to tell Netdata where to find your cus ``` Reload your browser tab to see your custom configuration. - -## What's next? - -If you're keen on continuing to customize your Netdata experience, check out our docs on [building new custom -dashboards](https://github.com/netdata/netdata/blob/master/web/gui/custom/README.md) with HTML, CSS, and JavaScript. - -### Further reading & related information - -- Dashboard - - [How the dashboard works](https://github.com/netdata/netdata/blob/master/docs/dashboard/how-dashboard-works.md) - - [Interact with charts](https://github.com/netdata/netdata/blob/master/docs/dashboard/interact-charts.md) - - [Chart dimensions, contexts, and families](https://github.com/netdata/netdata/blob/master/docs/dashboard/dimensions-contexts-families.md) - - [Select timeframes to visualize](https://github.com/netdata/netdata/blob/master/docs/dashboard/visualization-date-and-time-controls.md) - - [Import, export, and print a snapshot](https://github.com/netdata/netdata/blob/master/docs/dashboard/import-export-print-snapshot.md) - - **[Customize the standard dashboard](https://github.com/netdata/netdata/blob/master/docs/dashboard/customize.md)** diff --git a/docs/dashboard/dimensions-contexts-families.md b/docs/dashboard/dimensions-contexts-families.md index bc5c307824..8266db9e28 100644 --- a/docs/dashboard/dimensions-contexts-families.md +++ b/docs/dashboard/dimensions-contexts-families.md @@ -1,26 +1,12 @@ -<!-- -title: "Chart dimensions, contexts, and families" -description: >- - "Netdata organizes charts into dimensions, contexts, and families to automatically - and meaningfully organize thousands of metrics into interactive charts." -type: "explanation" -custom_edit_url: "https://github.com/netdata/netdata/blob/master/docs/dashboard/dimensions-contexts-families.md" -sidebar_label: "Chart dimensions, contexts, and families" -learn_status: "Published" -learn_topic_type: "Concepts" -learn_rel_path: "Concepts" ---> - # Chart dimensions, contexts, and families -While Netdata's charts require no configuration and are [easy to interact with](https://github.com/netdata/netdata/blob/master/docs/dashboard/interact-charts.md), +While Netdata's charts require no configuration and are [easy to interact with](https://github.com/netdata/netdata/blob/master/docs/cloud/visualize/interact-new-charts.md), they have a lot of underlying complexity. To meaningfully organize charts out of the box based on what's happening in your nodes, Netdata uses the concepts of **dimensions**, **contexts**, and **families**. -Understanding how these work will help you more easily navigate the dashboard, [write new -alarms](https://github.com/netdata/netdata/blob/master/health/REFERENCE.md), or play around with the [API](https://github.com/netdata/netdata/blob/master/web/api/README.md). - -For a refresher on the anatomy of a chart, see [dashboards and charts](https://github.com/netdata/netdata/blob/master/docs/dashboard/how-dashboard-works.md). +Understanding how these work will help you more easily navigate the dashboard, +[write new alarms](https://github.com/netdata/netdata/blob/master/health/REFERENCE.md), or play around +with the [API](https://github.com/netdata/netdata/blob/master/web/api/README.md). ## Dimension @@ -42,7 +28,7 @@ dimensions](https://user-images.githubusercontent.com/1153921/114207816-a5cb7400 The chart shows 13 unique dimensions, such as `httpd` for the CPU utilization for web servers, `kernel` for anything related to the Linux kernel, and so on. In your dashboard, these specific dimensions will almost certainly be different. -Dimensions can be [hidden](https://github.com/netdata/netdata/blob/master/docs/dashboard/interact-charts.md#show-and-hide-dimensions) to help you focus your +Dimensions can be [hidden](https://github.com/netdata/netdata/blob/master/docs/cloud/visualize/interact-new-charts.md#show-and-hide-dimensions) to help you focus your attention. ## Context @@ -90,13 +76,3 @@ dashboard. We recommend looking into [using the timeframe selector](https://gith If you feel comfortable with the [dashboard](https://github.com/netdata/netdata/blob/master/docs/dashboard/how-dashboard-works.md) and interacting with charts, we recommend learning about [configuration](https://github.com/netdata/netdata/blob/master/docs/configure/nodes.md). While Netdata doesn't _require_ a complicated setup process or a query language to create charts, there are a lot of ways to tweak the experience to match your needs. - -### Further reading & related information - -- Dashboard - - [How the dashboard works](https://github.com/netdata/netdata/blob/master/docs/dashboard/how-dashboard-works.md) - - [Interact with charts](https://github.com/netdata/netdata/blob/master/docs/dashboard/interact-charts.md) - - **[Chart dimensions, contexts, and families](https://github.com/netdata/netdata/blob/master/docs/dashboard/dimensions-contexts-families.md)** - - [Select timeframes to visualize](https://github.com/netdata/netdata/blob/master/docs/dashboard/visualization-date-and-time-controls.md) - - [Import, export, and print a snapshot](https://github.com/netdata/netdata/blob/master/docs/dashboard/import-export-print-snapshot.md) - - [Customize the standard dashboard](https://github.com/netdata/netdata/blob/master/docs/dashboard/customize.md) diff --git a/docs/dashboard/how-dashboard-works.md b/docs/dashboard/how-dashboard-works.md index a7f7fd4349..d036130ede 100644 --- a/docs/dashboard/how-dashboard-works.md +++ b/docs/dashboard/how-dashboard-works.md @@ -54,7 +54,7 @@ submenus](https://user-images.githubusercontent.com/1153921/80832425-7c528600-8b ## Charts -Every **chart** in the Netdata dashboard is [fully interactive](https://github.com/netdata/netdata/blob/master/docs/dashboard/interact-charts.md). Netdata +Every **chart** in the Netdata dashboard is fully interactive. Netdata synchronizes your interactions to help you understand exactly how a node behaved in any timeframe, whether that's seconds or days. @@ -76,7 +76,7 @@ like pushing the current timeframe off the screen to see what came before or aft To zoom, press and hold `Shift`, then use your mouse's scroll wheel, or a two-finger pinch if you're using a touchpad. -See [interact with charts](https://github.com/netdata/netdata/blob/master/docs/dashboard/interact-charts.md) for all the possible ways to interact with the charts on +See [interact with charts](https://github.com/netdata/netdata/blob/master/docs/cloud/visualize/interact-new-charts.md) for all the possible ways to interact with the charts on your dashboard. ## Alarms diff --git a/docs/dashboard/import-export-print-snapshot.md b/docs/dashboard/import-export-print-snapshot.md index a643b5d47e..23d8d7ed74 100644 --- a/docs/dashboard/import-export-print-snapshot.md +++ b/docs/dashboard/import-export-print-snapshot.md @@ -72,19 +72,3 @@ in the top panel. When you click **Print**, Netdata opens a new window to render every chart. This might take some time. When finished, Netdata opens a browser print dialog for you to save to PDF or print. - -## What's next? - -Now that you understand snapshots, now is a good time to delve deeper into some of the dashboard's lesser-known -features, such as [customization](https://github.com/netdata/netdata/blob/master/docs/dashboard/customize.md) or [building new, custom -dashboards](https://github.com/netdata/netdata/blob/master/web/gui/custom/README.md). - -### Further reading & related information - -- Dashboard - - [How the dashboard works](https://github.com/netdata/netdata/blob/master/docs/dashboard/how-dashboard-works.md) - - [Interact with charts](https://github.com/netdata/netdata/blob/master/docs/dashboard/interact-charts.md) - - [Chart dimensions, contexts, and families](https://github.com/netdata/netdata/blob/master/docs/dashboard/dimensions-contexts-families.md) - - [Select timeframes to visualize](https://github.com/netdata/netdata/blob/master/docs/dashboard/visualization-date-and-time-controls.md) - - **[Import, export, and print a snapshot](https://github.com/netdata/netdata/blob/master/docs/dashboard/import-export-print-snapshot.md)** - - [Customize the standard dashboard](https://github.com/netdata/netdata/blob/master/docs/dashboard/customize.md)
\ No newline at end of file diff --git a/docs/dashboard/visualization-date-and-time-controls.md b/docs/dashboard/visualization-date-and-time-controls.md index e9cbca1430..3006009a4e 100644 --- a/docs/dashboard/visualization-date-and-time-controls.md +++ b/docs/dashboard/visualization-date-and-time-controls.md @@ -15,7 +15,7 @@ learn_rel_path: "Concepts" ### Pick timeframes to visualize -While [panning through time and zooming in/out](https://github.com/netdata/netdata/blob/master/docs/dashboard/interact-charts.md) from charts it is helpful when +While [panning through time and zooming in/out](https://github.com/netdata/netdata/blob/master/docs/cloud/visualize/interact-new-charts.md) from charts it is helpful when you're looking a recent history, or want to do granular troubleshooting, what if you want to see metrics from 6 hours ago? Or 6 days? @@ -119,7 +119,7 @@ the theme to editing the text that accompanies every section of charts. - Dashboard - [How the dashboard works](https://github.com/netdata/netdata/blob/master/docs/dashboard/how-dashboard-works.md) - - [Interact with charts](https://github.com/netdata/netdata/blob/master/docs/dashboard/interact-charts.md) + - [Interact with charts](https://github.com/netdata/netdata/blob/master/docs/cloud/visualize/interact-new-charts.md) - [Chart dimensions, contexts, and families](https://github.com/netdata/netdata/blob/master/docs/dashboard/dimensions-contexts-families.md) - [Import, export, and print a snapshot](https://github.com/netdata/netdata/blob/master/docs/dashboard/import-export-print-snapshot.md) - [Customize the standard dashboard](https://github.com/netdata/netdata/blob/master/docs/dashboard/customize.md) diff --git a/docs/guides/monitor/lamp-stack.md b/docs/guides/monitor/lamp-stack.md index 42b4ee6321..73ab4dfd83 100644 --- a/docs/guides/monitor/lamp-stack.md +++ b/docs/guides/monitor/lamp-stack.md @@ -171,10 +171,9 @@ If the Netdata Agent isn't already open in your browser, open a new tab and navi Netdata automatically organizes all metrics and charts onto a single page for easy navigation. Peek at gauges to see overall system performance, then scroll down to see more. Click-and-drag with your mouse to pan _all_ charts back and forth through different time intervals, or hold `SHIFT` and use the scrollwheel (or two-finger scroll) to zoom in and -out. Check out our doc on [interacting with charts](https://github.com/netdata/netdata/blob/master/docs/dashboard/interact-charts.md) for all the details. +out. Check out our doc on [interacting with charts](https://github.com/netdata/netdata/blob/master/docs/cloud/visualize/interact-new-charts.md) for all the details. - + The **System Overview** section, which you can also see in the right-hand menu, contains key hardware monitoring charts, including CPU utilization, memory page faults, network monitoring, and much more. The **Applications** section shows you diff --git a/docs/metrics-storage-management/how-streaming-works.md b/docs/metrics-storage-management/how-streaming-works.md index 1934a3362e..7d5c7fa183 100644 --- a/docs/metrics-storage-management/how-streaming-works.md +++ b/docs/metrics-storage-management/how-streaming-works.md @@ -1,32 +1,18 @@ -<!-- -title: "How metrics streaming works" -description: >- - "Netdata's real-time streaming allows you to replicate metrics data - across multiple nodes, or centralize all your metrics data into a single - time-series database (TSDB)." -type: "explanation" -custom_edit_url: "https://github.com/netdata/netdata/blob/master/docs/metrics-storage-management/how-streaming-works.md" -sidebar_label: "How metrics streaming works" -learn_status: "Published" -learn_topic_type: "Concepts" -learn_rel_path: "Concepts" ---> - # How metrics streaming works Each node running Netdata can stream the metrics it collects, in real time, to another node. Streaming allows you to replicate metrics data across multiple nodes, or centralize all your metrics data into a single time-series database (TSDB). -When one node streams metrics to another, the node receiving metrics can visualize them on the -[dashboard](https://github.com/netdata/netdata/blob/master/docs/dashboard/interact-charts.md), run health checks to [trigger -alarms](https://github.com/netdata/netdata/blob/master/docs/monitor/view-active-alarms.md) and [send notifications](https://github.com/netdata/netdata/blob/master/docs/monitor/enable-notifications.md), and +When one node streams metrics to another, the node receiving metrics can visualize them on the dashboard, run health checks to +[trigger alarms](https://github.com/netdata/netdata/blob/master/docs/monitor/view-active-alarms.md) and +[send notifications](https://github.com/netdata/netdata/blob/master/docs/monitor/enable-notifications.md), and [export](https://github.com/netdata/netdata/blob/master/docs/export/external-databases.md) all metrics to an external TSDB. When Netdata streams metrics to another Netdata, the receiving one is able to perform everything a Netdata instance is capable of. Streaming lets you decide exactly how you want to store and maintain metrics data. While we believe Netdata's -[distributed architecture](https://github.com/netdata/netdata/blob/master/docs/store/distributed-data-architecture.md) is ideal for speed and scale, streaming -provides centralization options for those who want to maintain only a single TSDB instance. +[distributed architecture](https://github.com/netdata/netdata/blob/master/docs/store/distributed-data-architecture.md) is +ideal for speed and scale, streaming provides centralization options and high data availability. ## Streaming basics @@ -96,4 +82,4 @@ Take your streaming setup even further by [exporting metrics](https://github.com - Streaming - **[How Netdata streams metrics](https://github.com/netdata/netdata/blob/master/docs/metrics-storage-management/how-streaming-works.md)** - [Enable streaming between nodes](https://github.com/netdata/netdata/blob/master/docs/metrics-storage-management/enable-streaming.md) - - [Streaming reference](https://github.com/netdata/netdata/blob/master/docs/metrics-storage-management/reference-streaming.md)
\ No newline at end of file + - [Streaming reference](https://github.com/netdata/netdata/blob/master/docs/metrics-storage-management/reference-streaming.md) diff --git a/packaging/installer/README.md b/packaging/installer/README.md index af720a1bfb..eaa8dc7b05 100644 --- a/packaging/installer/README.md +++ b/packaging/installer/README.md @@ -23,20 +23,21 @@ To install Netdata in minutes on your platform: 2. You will be presented with an empty space, and a prompt to "Connect Nodes" with the install command for each platform 3. Select the platform you want to install Netdata to, copy and paste the script into your node's terminal, and run it -Upon installation completing successfully, you should be able to see the node live in your Netdata Space and live charts in the Overview tab. [Read more about the cloud features](https://github.com/netdata/netdata/blob/master/docs/quickstart/infrastructure.md). +Upon installation completing successfully, you should be able to see the node live in your Netdata Space and live charts +in the Overview tab. [Read more about the cloud features](https://github.com/netdata/netdata/blob/master/docs/quickstart/infrastructure.md). Where you go from here is based on your use case, immediate needs, and experience with monitoring and troubleshooting, but we have some hints on what you might want to do next. ### What's next? -Explore our [general advanced installation options and troubleshooting](#advanced-installation-options-and-troubleshooting), specific options for the [single line installer](#install-on-linux-with-one-line-installer), or [other installation methods](#other-installation-methods). +Explore our [general advanced installation options and troubleshooting](#advanced-installation-options-and-troubleshooting), specific options +for the [single line installer](#install-on-linux-with-one-line-installer), or [other installation methods](#other-installation-methods). #### Agent user interface To access the UI provided by the locally installed agent, open a browser and navigate to `http://NODE:19999`, replacing `NODE` with either `localhost` or -the hostname/IP address of the remote node. You can also read more about [how the agent dashboard works](https://github.com/netdata/netdata/blob/master/docs/dashboard/how-dashboard-works.md), or dive directly into the many ways -to [interact with charts](https://github.com/netdata/netdata/blob/master/docs/dashboard/interact-charts.md). +the hostname/IP address of the remote node. You can also read more about [how the agent dashboard works](https://github.com/netdata/netdata/blob/master/docs/dashboard/how-dashboard-works.md). #### Configuration @@ -59,8 +60,8 @@ community, but you may want to [edit alarms](https://github.com/netdata/netdata/ #### Make your deployment production ready -Both [securing Netdata](https://github.com/netdata/netdata/blob/master/docs/netdata-security.md) and [setting up replication](https://github.com/netdata/netdata/blob/master/streaming/README.md) are strongly recommended. - +Go through our [deployment strategies](https://github.com/netdata/netdata/edit/master/docs/category-overview-pages/deployment-strategies.md), +for suggested configuration changes for production deployments. ## Install on Linux with one-line installer diff --git a/web/server/README.md b/web/server/README.md index 4ce21efe62..37577b6ddd 100644 --- a/web/server/README.md +++ b/web/server/README.md @@ -48,7 +48,7 @@ Scroll down to the `[web]` section to find the following settings. | `accept a streaming request every seconds` | `0` | Can be used to set a limit on how often a parent node will accept streaming requests from child nodes in a [streaming and replication setup](https://github.com/netdata/netdata/blob/master/streaming/README.md). | | `respect do not track policy` | `no` | If set to `yes`, Netdata will respect the user's browser preferences for [Do Not Track](https://www.eff.org/issues/do-not-track) (DNT) and storing cookies. If DNT is _enabled_ in the browser, and this option is set to `yes`, users will not be able to sign in to Netdata Cloud via their local Agent dashboard, and their node will not connect to any [registry](https://github.com/netdata/netdata/blob/master/registry/README.md). For certain browsers, users must disable DNT and change this option to `yes` for full functionality. | | `x-frame-options response header` | ` ` | Avoid [clickjacking attacks](https://developer.mozilla.org/en-US/docs/Web/HTTP/Headers/X-Frame-Options), by ensuring that the content is not embedded into other sites. | -| `allow connections from` | `localhost *` | Declare which IP addresses or full-qualified domain names (FQDNs) are allowed to connect to the web server, including the [dashboard](https://github.com/netdata/netdata/blob/master/docs/dashboard/interact-charts.md) or [HTTP API](https://github.com/netdata/netdata/blob/master/web/api/README.md). This is a global setting with higher priority to any of the ones below. | +| `allow connections from` | `localhost *` | Declare which IP addresses or full-qualified domain names (FQDNs) are allowed to connect to the web server, including the [dashboard](https://github.com/netdata/netdata/blob/master/web/gui/README.md) or [HTTP API](https://github.com/netdata/netdata/blob/master/web/api/README.md). This is a global setting with higher priority to any of the ones below. | | `allow connections by dns` | `heuristic` | See the [access list examples](#access-lists) for details on using `allow` settings. | | `allow dashboard from` | `localhost *` | | | `allow dashboard by dns` | `heuristic` | | |