
diff options
| author | Fotis Voutsas <fotis@netdata.cloud> | 2024-04-24 13:55:45 +0300 |
|---|---|---|
| committer | GitHub <noreply@github.com> | 2024-04-24 13:55:45 +0300 |
| commit | 2290b61e418b27a174612729e030f959da62aae7 (patch) | |
| tree | 816fb6585742f75ec66d8c465011344054a769b4 | |
| parent | ee5e83e01ebb21214ec66776d746d18f47ef9f89 (diff) | |
Documentation edits (#17509)
* Delete docs/category-overview-pages/netdata-dashboards-and-visualizations.md
* Delete src/web/gui/confluence/README.md
* Delete docs/category-overview-pages/monitor-your-infrastructure.md
* Update view-active-alerts.md
* Apply suggestions from code review
* Update docs/monitor/view-active-alerts.md
Co-authored-by: Hugo Valente <82235632+hugovalente-pm@users.noreply.github.com>
---------
Co-authored-by: Ilya Mashchenko <ilya@netdata.cloud>
Co-authored-by: Hugo Valente <82235632+hugovalente-pm@users.noreply.github.com>
| -rw-r--r-- | docs/category-overview-pages/monitor-your-infrastructure.md | 3 | ||||
| -rw-r--r-- | docs/category-overview-pages/netdata-dashboards-and-visualizations.md | 3 | ||||
| -rw-r--r-- | docs/monitor/view-active-alerts.md | 61 | ||||
| -rw-r--r-- | src/web/gui/confluence/README.md | 1023 |
4 files changed, 29 insertions, 1061 deletions
diff --git a/docs/category-overview-pages/monitor-your-infrastructure.md b/docs/category-overview-pages/monitor-your-infrastructure.md deleted file mode 100644 index 3582e88a68..0000000000 --- a/docs/category-overview-pages/monitor-your-infrastructure.md +++ /dev/null @@ -1,3 +0,0 @@ -# Monitor your Infrastructure Overview - -This section contains documentation on how you can use Netdata Cloud and it's features to monitor your entire infrastructure.
\ No newline at end of file diff --git a/docs/category-overview-pages/netdata-dashboards-and-visualizations.md b/docs/category-overview-pages/netdata-dashboards-and-visualizations.md deleted file mode 100644 index cc9304365f..0000000000 --- a/docs/category-overview-pages/netdata-dashboards-and-visualizations.md +++ /dev/null @@ -1,3 +0,0 @@ -# Netdata Dashboards and Visualizations Overview - -This section provides documentation about all the visualization operations, features and insights that Netdata provides.
\ No newline at end of file diff --git a/docs/monitor/view-active-alerts.md b/docs/monitor/view-active-alerts.md index 02eed0a84a..1a4c410fd5 100644 --- a/docs/monitor/view-active-alerts.md +++ b/docs/monitor/view-active-alerts.md @@ -1,13 +1,14 @@ -# View active alerts +# Alerts tab Netdata comes with hundreds of pre-configured health alerts designed to notify you when an anomaly or performance issue affects your node or its applications. -From the Alerts tab you can see all the active alerts in your War Room. You will be presented with a table having information about each alert that is in warning and critical state. -You can always sort the table by a certain column by clicking on the name of that column, and use the gear icon on the top right to control which columns are visible at any given time. +## Active tab -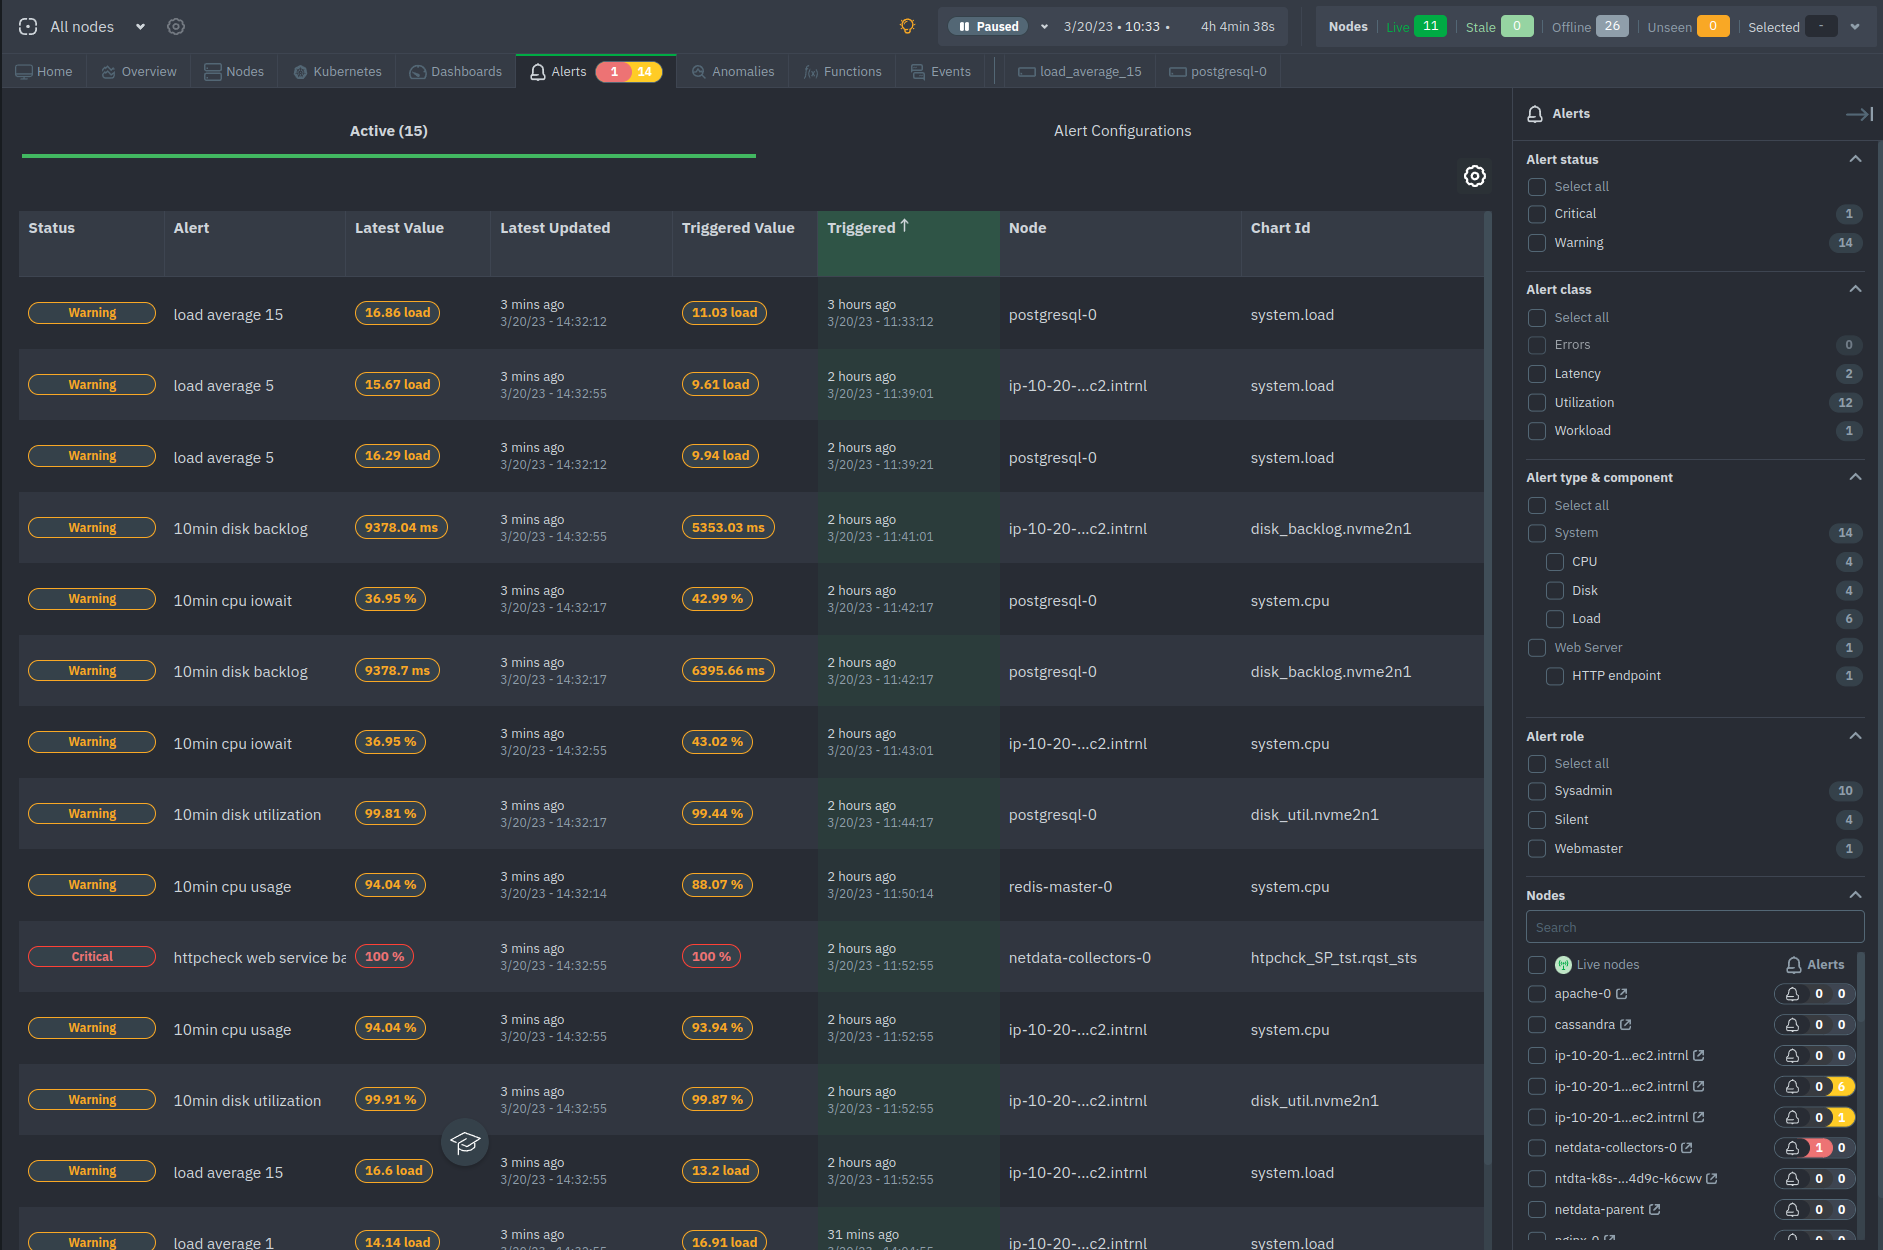 +From the Active tab you can see all the active alerts in your War Room. You will be presented with a table having information about each alert that is in warning or critical state. -## Filter alerts +You can always sort the table by a certain column by clicking on the name of that column, and using the gear icon on the top right to control which columns are visible at any given time. + +### Filter alerts From this tab, you can also filter alerts with the right hand bar. More specifically you can filter: @@ -19,52 +20,48 @@ From this tab, you can also filter alerts with the right hand bar. More specific - Filter based on the alert's type (e.g. System, Web Server) and component (e.g. CPU, Disk, Load) - Alert role - Filter by the role that the alert is set to notify (e.g. Sysadmin, Webmaster etc.) +- Host labels + - Filter based on the host labels that are configured for the nodes across the War Room (e.g. `_cloud_instance_region` to match `us-east-1`) +- Node status + - Filter by node availability status (e.g. Live or Offline) +- Netdata version + - Filter by Netdata version (e.g. `v1.45.3`) - Nodes - - Filter the alerts based on the nodes that are online, next to each node's name you can see how many alerts the node has, "critical" colored in red and "warning" colored in yellow + - Filter the alerts based on the nodes of your War Room. -## View alert details +### View alert details By clicking on the name of an entry of the table you can access that alert's details page, providing you with: - Latest and Triggered time values - The alert's description -- A link to the Community forum's alert page +- A link to the Netdata Advisor's page about this alert - The chart at the time frame that the alert was triggered -- The alert's information: Node name, chart ID, type, component and class +- The alert's information: Node name, chart instance, type, component and class - Configuration section - Instance values - Node Instances -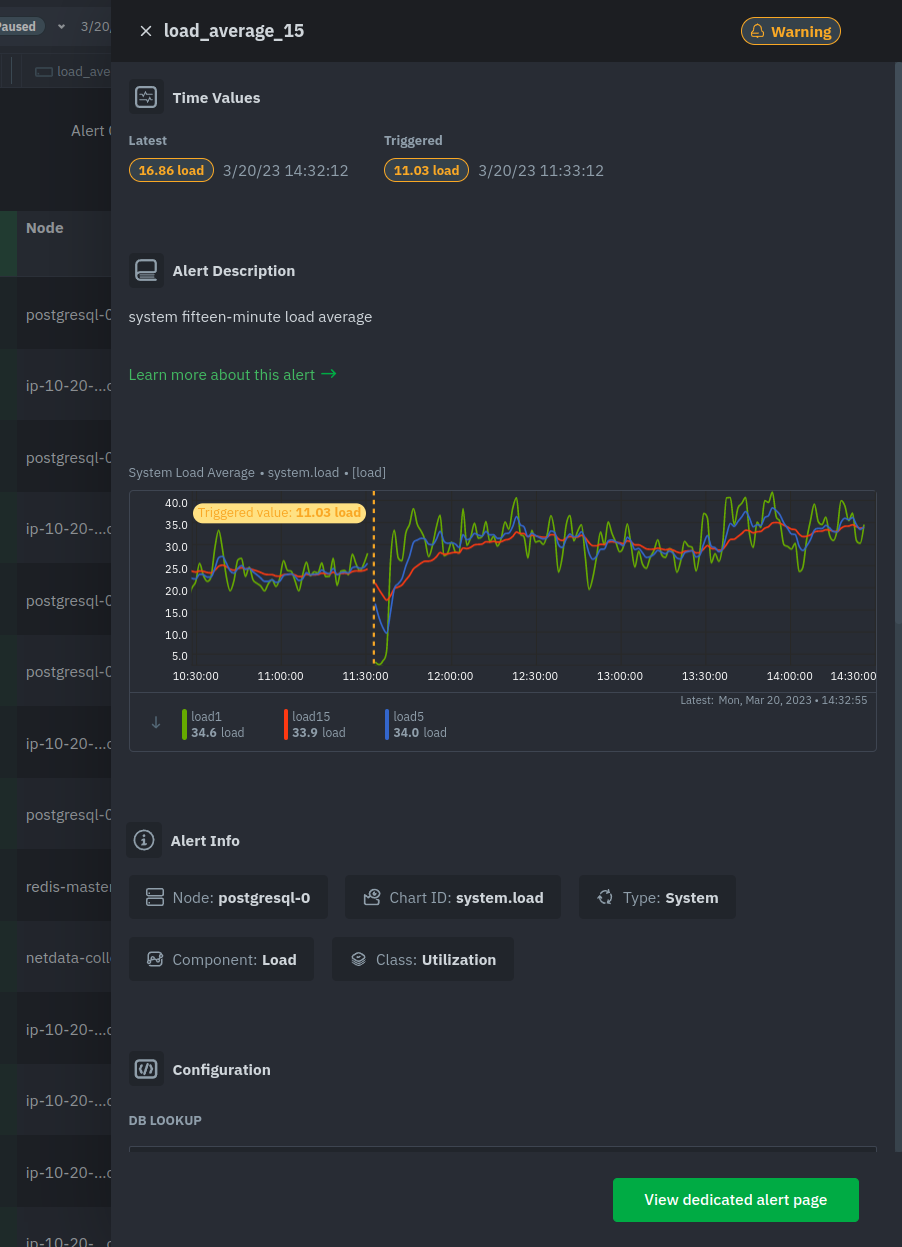 +At the bottom of the panel you can click the green button "View alert page" to open a [dynamic tab](https://github.com/netdata/netdata/blob/master/docs/quickstart/infrastructure.md#dynamic-tabs) containing all the info for this alert in a tab format, where you can also run correlations and go to the node's chart that raised the particular alert. + +### Silence an alert -At the bottom of the panel you can click the green button "View dedicated alert page" to open a [dynamic tab](https://github.com/netdata/netdata/blob/master/docs/quickstart/infrastructure.md#dynamic-tabs) containing all the info for this alert in a tab format, where you can also run correlations and go to the node's chart that raised the particular alert. +From this tab, the "Silencing" column shows if there is any rule present for each alert, and from the "Actions" column you can create a new [silencing rule](https://github.com/netdata/netdata/blob/master/docs/cloud/alerts-notifications/notifications.md#silencing-alert-notifications) for this alert, or get help and information about this alert from the [Netdata Assistant](https://github.com/netdata/netdata/blob/master/docs/cloud/netdata-assistant.md). -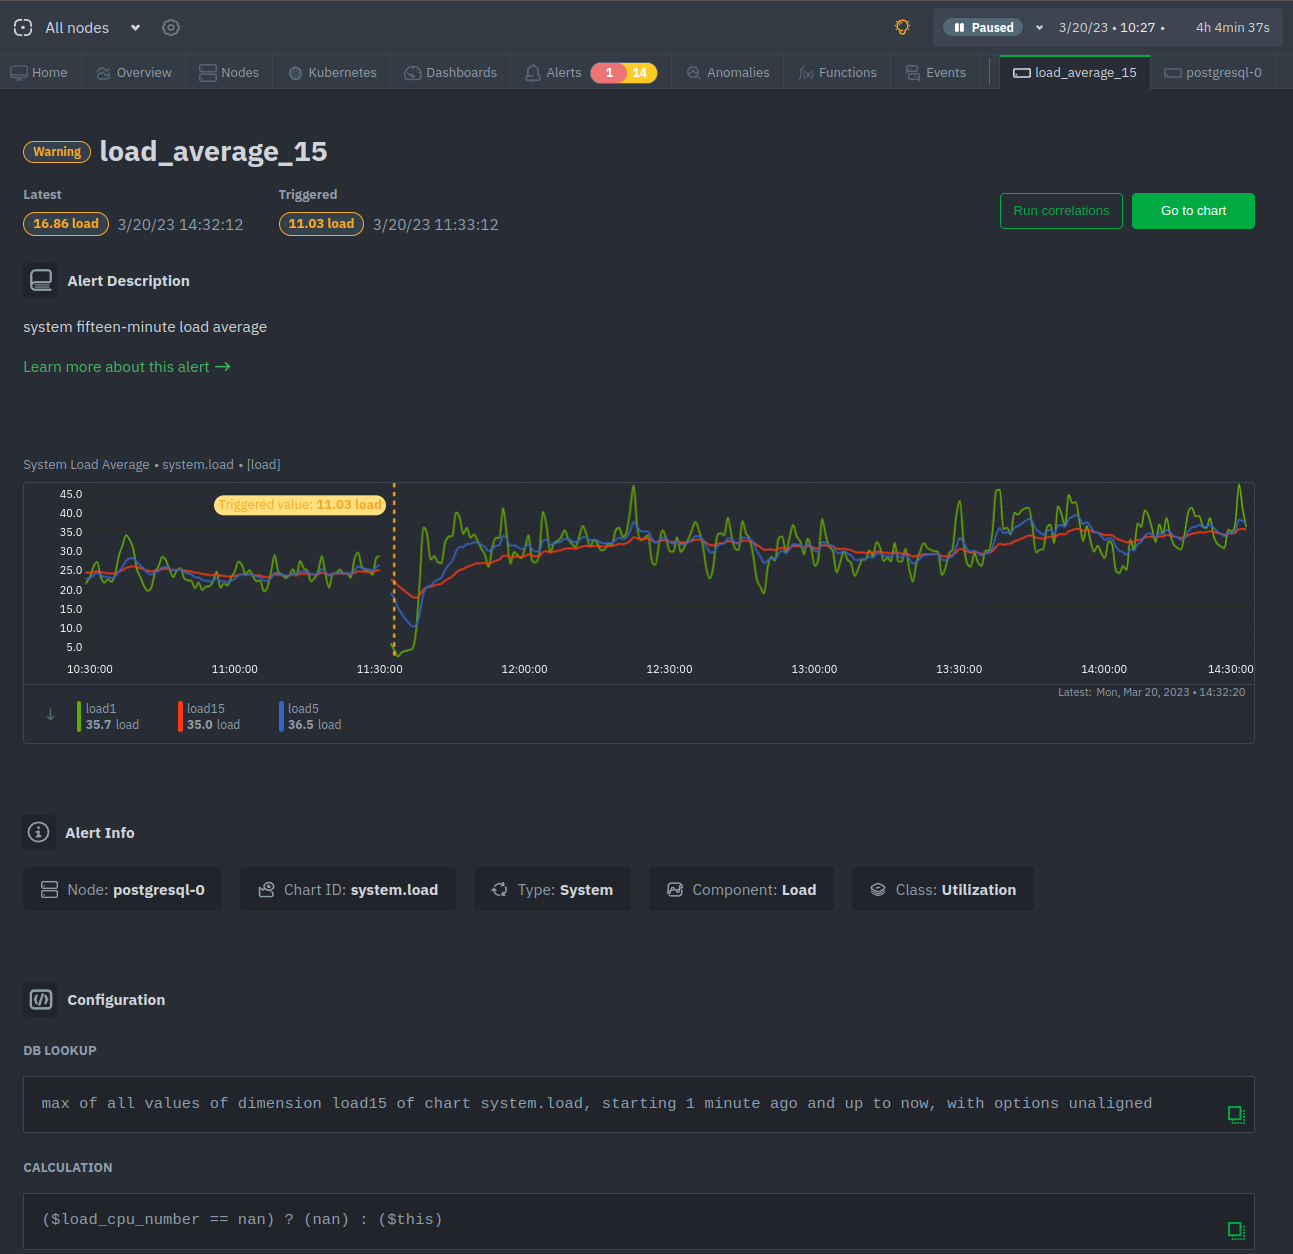 +## Alert Configurations tab -<!-- -## Local Netdata Agent dashboard +From this tab you can view all the configurations for all running alerts in your War Room. Each row concerns one alert, and it provides information about it in the rest of the table columns. -Find the alerts icon  -in the top navigation to bring up a modal that shows currently raised alerts, all running alerts, and the alerts log. -Here is an example of a raised `system.cpu` alert, followed by the full list and alert log: +By running alerts we mean alerts that are related to some metric that is or was collected. Netdata may have more alerts pre-configured that aren't applicable to your monitoring use-cases. - -And a static screenshot of the raised CPU alert: +You can control which columns are visible by using the gear icon on the right-hand side. - +Similarly to the previous tab, you can see the silencing status of an alert, while also being able to dig deeper and show the configuration for the alert and ask the [Netdata Assistant](https://github.com/netdata/netdata/blob/master/docs/cloud/netdata-assistant.md) for help. -The alert itself is named **system - cpu**, and its context is `system.cpu`. Beneath that is an auto-updating badge that -shows the latest value of the chart that triggered the alert. +### See the configuration for an alert -With the three icons beneath that and the **role** designation, you can: +From the actions column you can explore the alert's configuration, split by the different nodes that have this alert configured. -1. Scroll to the chart associated with this raised alert. -2. Copy a link to the badge to your clipboard. -3. Copy the code to embed the badge onto another web page using an `<embed>` element. +From there you can click on any of the rows to get to the individual alert configurations for that node. -The table on the right-hand side displays information about the health entity that triggered the alert, which you can -use as a reference to [configure alerts](https://github.com/netdata/netdata/blob/master/src/health/REFERENCE.md). - --> +Click on an alert row to see the alert's page, with all the information about when it was last triggered and what it's configuration is. diff --git a/src/web/gui/confluence/README.md b/src/web/gui/confluence/README.md deleted file mode 100644 index 674942ec9c..0000000000 --- a/src/web/gui/confluence/README.md +++ /dev/null @@ -1,1023 +0,0 @@ -<!-- -title: "Atlassian Confluence dashboards" -custom_edit_url: https://github.com/netdata/netdata/edit/master/src/web/gui/confluence/README.md -sidebar_label: "Atlassian Confluence dashboards" -learn_status: "Published" -learn_topic_type: "Tasks" -learn_rel_path: "Developers/Web" ---> - -# Atlassian Confluence dashboards - -With Netdata you can build **live, interactive, monitoring dashboards** directly on Atlassian's **Confluence** pages. - -I see you already asking "why should I do this?" - -Well... think a bit of it.... confluence is the perfect place for something like that: - -1. All the employees of your company already have access to it. - -2. Most probably you have already several spaces on confluence, one for each project or service. Adding live monitoring information there is ideal: everything in one place. Your users will just click on the page and instantly the monitoring page they need will appear with only the information they need to know. - -3. You can create monitoring pages for very specific purposes, hiding all the information that is too detailed for most users, or explaining in detail things that are difficult for them to understand. - -So, what can we expect? What can Netdata do on confluence? - -You will be surprised! **Everything a Netdata dashboard does!**. Example: - - - -Let me show you how. - -> Let's assume we have 2 web servers we want to monitor. We will create a simple dashboard with key information about them, directly on confluence. - -### Before you begin - -Most likely your confluence is accessible via HTTPS. So, you need to proxy your Netdata servers via an apache or nginx to make them HTTPS too. If your Confluence is HTTPS but your Netdata are not, you will not be able to fetch the Netdata content from the confluence page. The Netdata wiki has many examples for proxying Netdata through another web server. - -> So, make sure Netdata and Confluence can be accessed with the same protocol (**http**, or **https**). - -For our example, I will use these 2 servers: - -| server | url | -|------|---| -| Server 1 | <https://london.my-netdata.io> | -| Server 2 | <https://frankfurt.my-netdata.io> | - -I will use the first server for the static dashboard javascript files. - ---- - -Then, you need to enable the `html` plugin of confluence. We will add some plain html content on that page, and this plugin is required. - -### Create a new page - -Create a new confluence page and paste this into an `html` box: - -```html -<script> -// don't load bootstrap - confluence does not need this -var netdataNoBootstrap = true; - -// select the web notifications to show on this dashboard -// var netdataShowAlarms = true; -// var netdataAlarmsRecipients = [ 'sysadmin', 'webmaster' ]; -</script> - -<script src="https://london.my-netdata.io/dashboard.js"></script> -``` - -like this (type `{html` for the html box to appear - you need the confluence html plugin enabled): - - - -### Add a few badges - -Then, go to your Netdata and copy an alert badge (the `<embed>` version of it): - - - -Then add another HTML box on the page, and paste it, like this: - - - -Hit **update** and you will get this: - - - -This badge is now auto-refreshing. It will update itself based on the update frequency of the alert. - -> Keep in mind you can add badges with custom Netdata queries too. Netdata automatically creates badges for all the -> alerts, but every chart, every dimension on every chart, can be used for a badge. And Netdata badges are quite -> powerful! Check [Creating Badges](https://github.com/netdata/netdata/blob/master/src/web/api/badges/README.md) for more information on badges. - -So, let's create a table and add this badge for both our web servers: - - - -Now we get this: - -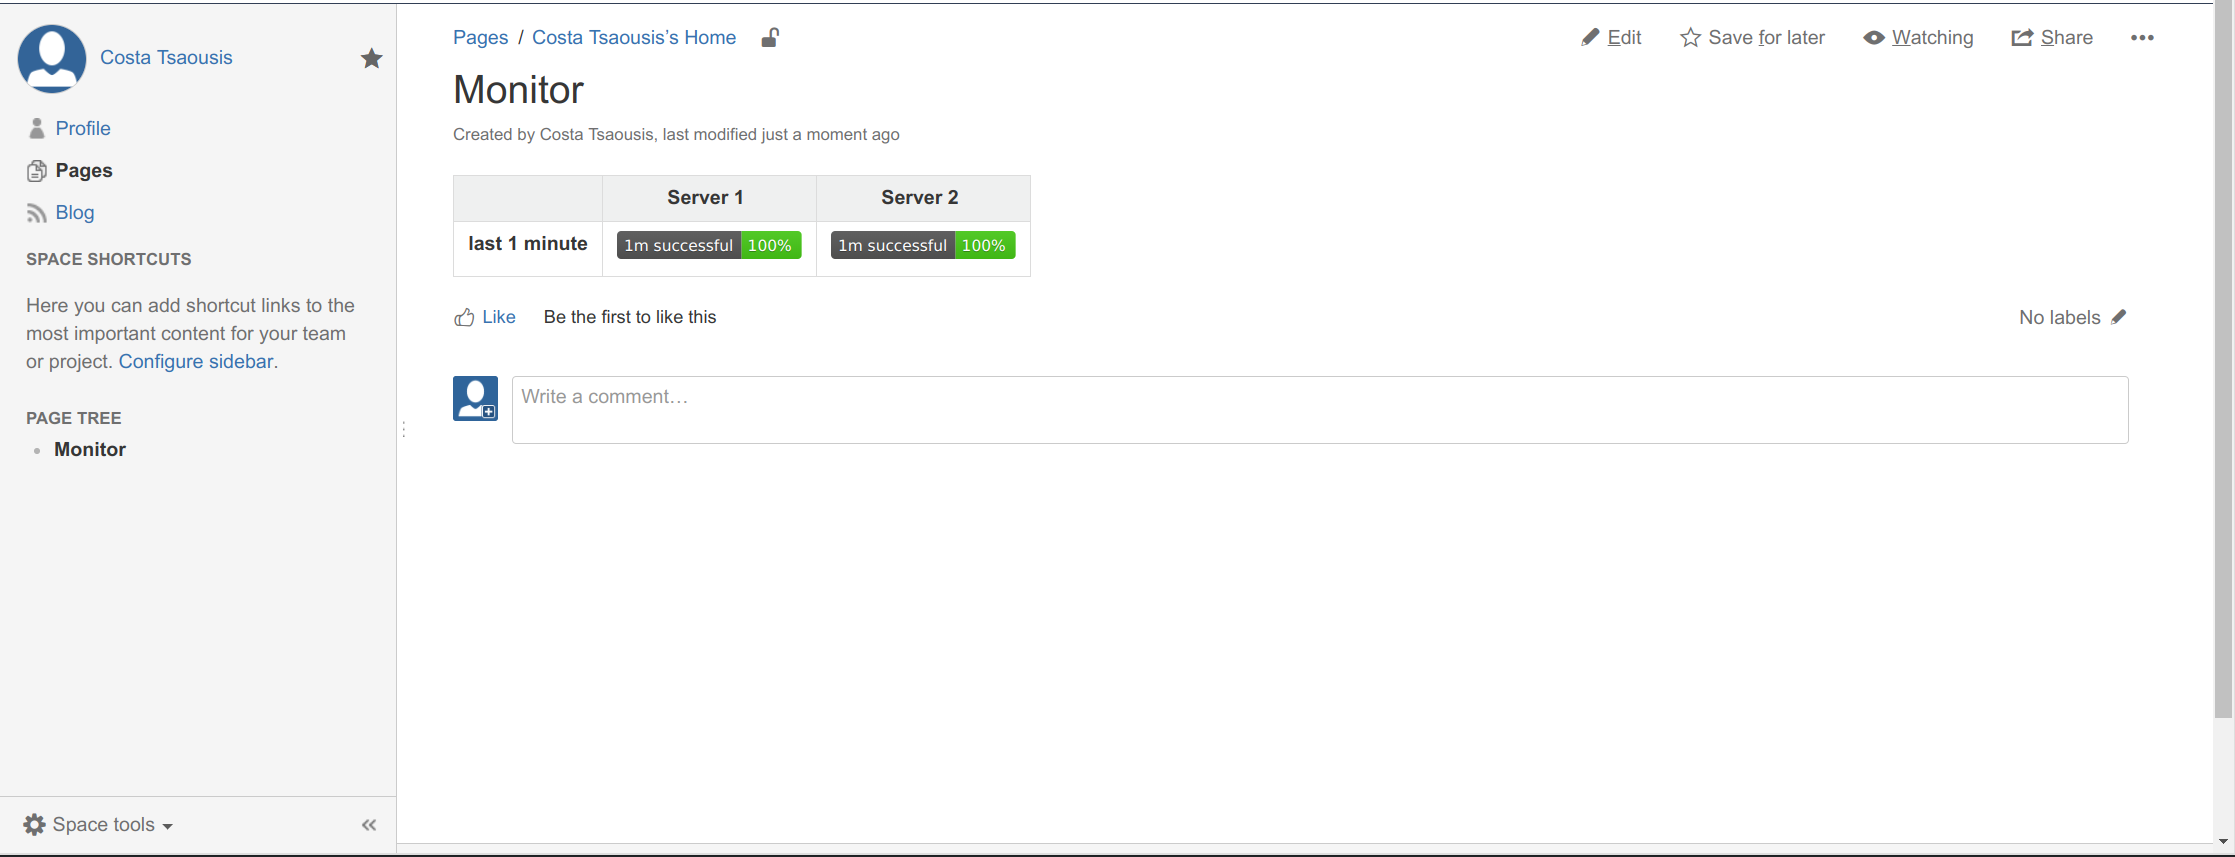 - -### Add a Netdata chart - -The simplest form of a chart is this (it adds the chart `web_log_nginx_netdata.response_statuses`, using 100% of the width, 150px height, and the last 10 minutes of data): - -```html -<div - data-netdata="web_log_nginx_netdata.response_statuses" - data-width="100%" - data-height="150px" - data-before="0" - data-after="-600" -></div> -``` - -Add this to `html` block on confluence: - - - -And you will get this: - -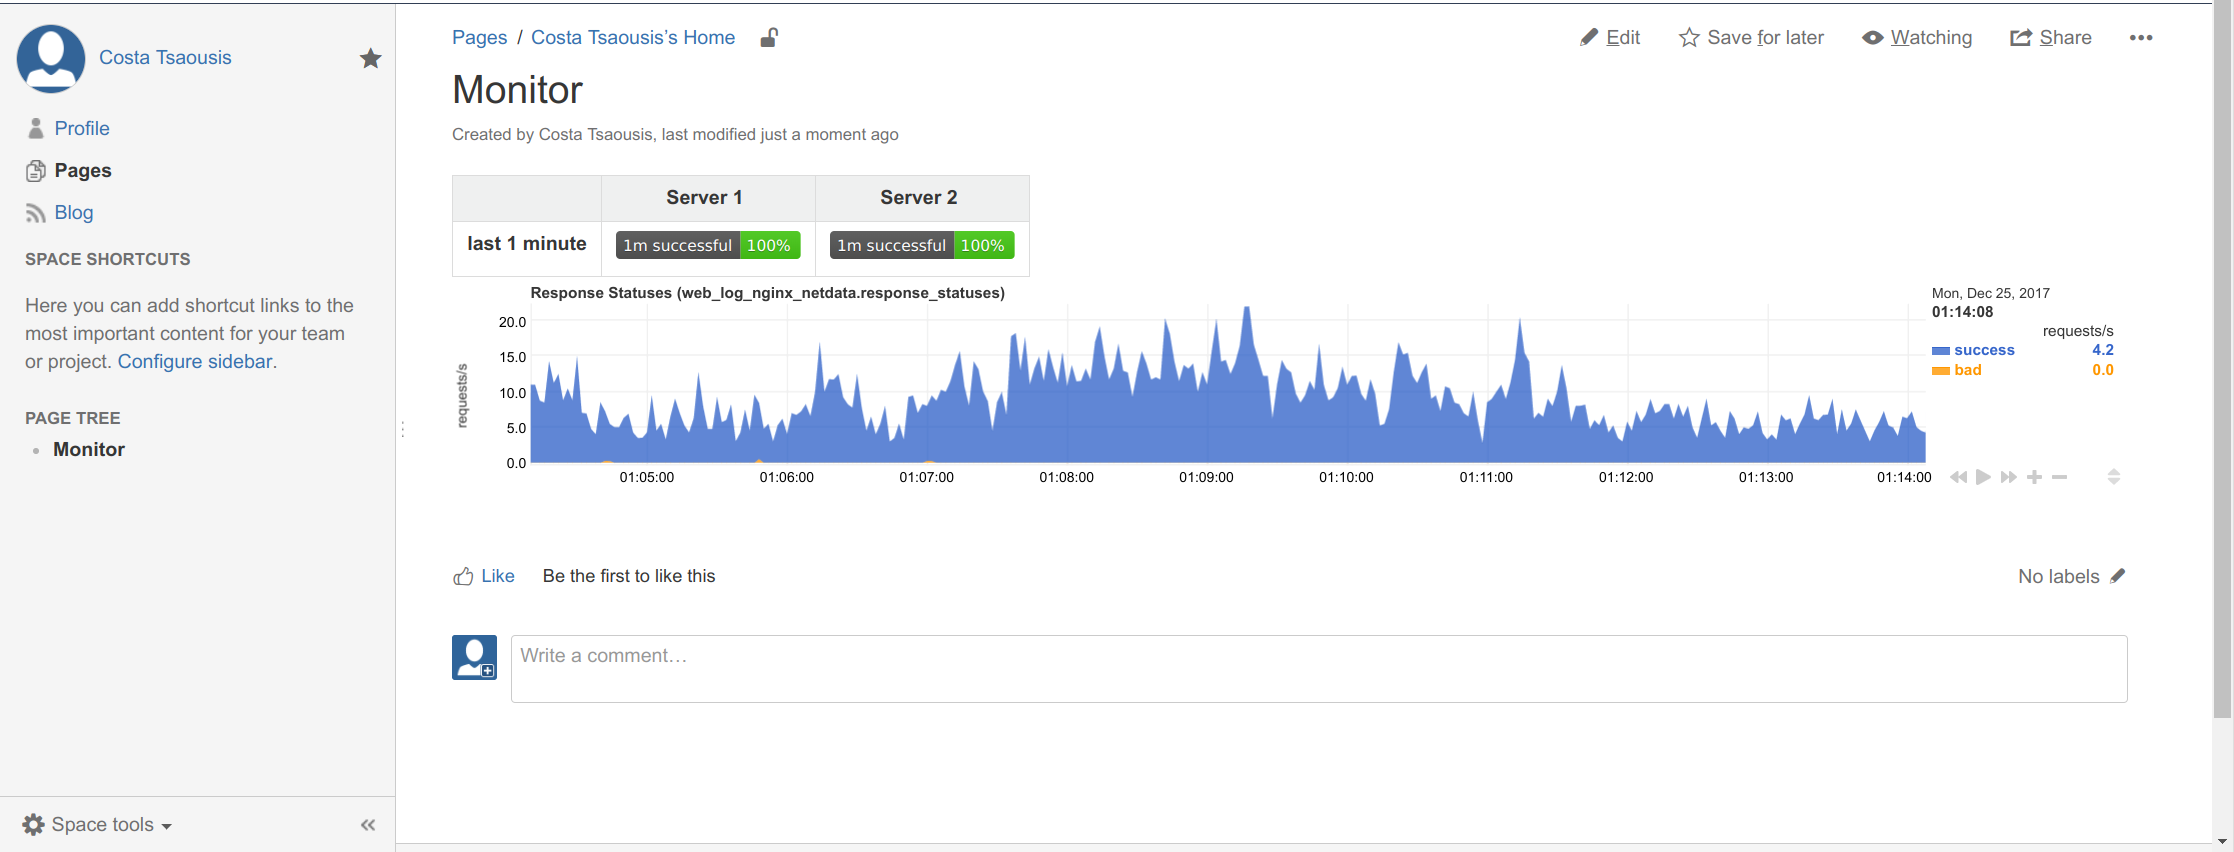 - -> This chart is **alive**, fully interactive. You can drag it, pan it, zoom it, etc like you do on Netdata dashboards! - -Of course this too big. We need something smaller to add inside the table. Let's try this: - -```html -<div - data-netdata="web_log_nginx_netdata.response_statuses" - data-legend="false" - data-dygraph-yaxislabelwidth="35" - data-dygraph-ypixelsperlabel="8" - data-after="-600" - data-before="0" - data-title="" - data-height="100px" - data-width="300px" -></div> -``` - -The chart name is shown on all Netdata charts, so just copy it from a Netdata dashboard. - -We will fetch the same chart from both servers. To define the server we also added `data-host=` with the URL of each server, like this (we also added `<br/>` for a newline between the badge and the chart): - - - -Which gives us this: - -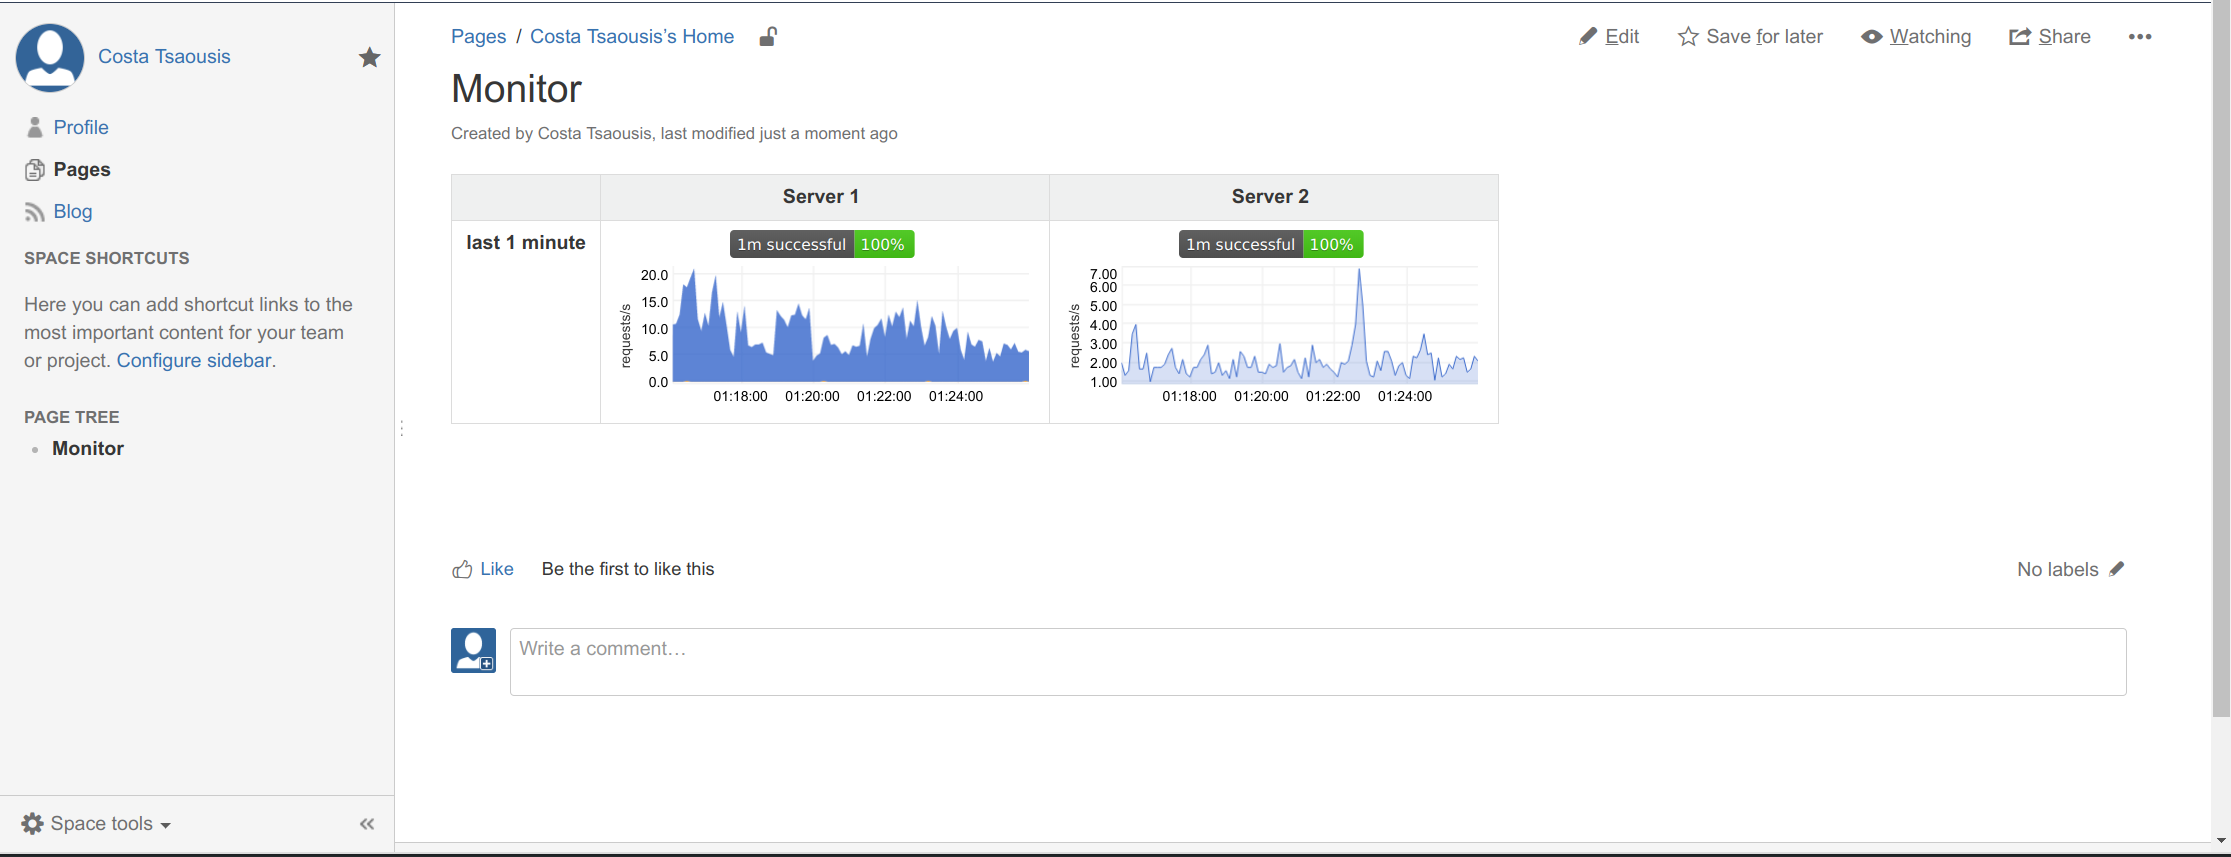 - -Note the color difference. This is because Netdata automatically hides dimensions that are just zero (the frankfurt server has only successful requests). To instruct Netdata to disable this feature, we need to add another html fragment at the bottom of the page (make sure this is added after loading `dashboard.js`). So we edit the first block we added, and append a new `<script>` section to it: - -```html -<script> -// don't load bootstrap - confluence does not need this -var netdataNoBootstrap = true; - -// select the web notifications to show on this dashboard -// var netdataShowAlarms = true; -// var netdataAlarmsRecipients = [ 'sysadmin', 'webmaster' ]; -</script> - -<script src="https://london.my-netdata.io/dashboard.js"></script> - -<script> -// do not hide dimensions with just zeros -NETDATA.options.current.eliminate_zero_dimensions = false; -</script> -``` - -Now they match: - - - -#### more options - -If you want to change the colors append `data-colors="#001122 #334455 #667788"`. The colors will be used for the dimensions top to bottom, as shown on a Netdata dashboard. Keep in mind the default Netdata dashboards hide by default all dimensions that are just zero, so enable them at the dashboard settings to see them all. - -You can get a percentage chart, by adding these on these charts: - -```html - data-append-options="percentage" - data-decimal-digits="0" - data-dygraph-valuerange="[0, 100]" - data-dygraph-includezero="true" - data-units="%" -``` - -The first line instructs Netdata to calculate the percentage of each dimension, the second strips any fractional digits, the third instructs the charting library to size the chart from 0 to 100, the next one instructs it to include 0 in the chart and the last changes the units of the chart to `%`. This is how it will look: - - - -You can make any number of charts have common min and max on the y-range by adding `common-min="NAME"` and `common-max="NAME"`, where `NAME` is anything you like. Keep in mind for best results all the charts with the same `NAME` should be visible at once, otherwise a not-visible chart will influence the range and until it is updated the range will not adapt. - -### Add gauges - -Let's now add a few gauges. The chart we added has several dimensions: `success`, `error`, `redirect`, `bad` and `other`. - -Let's say we want to add 2 gauges: - -1. `success` and `redirect` together, in blue -2. `error`, `bad` and `other` together, in orange - -We will add the following for each server. We have enclosed them in another a `<div>` because Confluence will wrap them if the page width is not enough to fit them. With that additional `<div>` they will always be next to each other. - -```html -<div style="width: 300px; text-align: center;"> -<div - data-netdata="web_log_nginx_netdata.response_statuses" - data-host="https://london.my-netdata.io" - data-dimensions="success,redirect" - data-chart-library="gauge" - data-title="Good" - data-units="requests/s" - data-gauge-adjust="width" - data-width="120" - data-before="0" - data-after="-600" - data-points="600" - data-common-max="response_statuses" - data-colors="#007ec6" - data-decimal-digits="0" - ></div><div - data-netdata="web_log_nginx_netdata.response_statuses" - data-host="https://london.my-netdata.io" - data-dimensions="error,bad,other" - data-chart-library="gauge" - data-title="Bad" - data-units="requests/s" - data-gauge-adjust="width" - data-width="120" - data-before="0" - data-after="-600" - data-points="600" - data-common-max="response_statuses" - data-colors="#97CA00" - data-decimal-digits="0" - ></div> -</div> -``` - -Adding the above will give you this: - - - -### Final source - for the confluence source editor - -If you enable the source editor of Confluence, you can paste the whole example (implementing the first image on this post and demonstrating everything discussed on this page): - -```html -<p class="auto-cursor-target">Monitoring the health of the web servers, by analyzing the response codes they send.</p> -<table> - <colgroup> - <col/> - <col/> - <col/> - <col/> - <col/> - </colgroup> - <tbody> - <tr> - <th style="text-align: center;"> - <br/> - </th> - <th style="text-align: center;">London</th> - <th style="text-align: center;">Frankfurt</th> - <th colspan="1" style="text-align: center;">San Francisco</th> - <th colspan="1" style="text-align: center;">Toronto</th> - </tr> - <tr> - <td colspan="1" style="text-align: right;"> - <strong>last hour</strong> - <br/> - <strong>requests</strong> - </td> - <td colspan="1" style="text-align: center;"> - <div class="content-wrapper"> - <p class="auto-cursor-target"> - <br/> - </p> - <ac:structured-macro ac:macro-id="5771a1db-b461-478f-a820-edcb67809eb1" ac:name="html" ac:schema-version="1"> - <ac:plain-text-body><![CDATA[<div - data-netdata="web_log_nginx_netdata.response_statuses" - data-host="https://london.my-netdata.io" - data-chart-library="easypiechart" - data-after="-14400" - data-before="0" - data-points="4" - data-title="london" - data-method="sum" - data-append-options="unaligned" - data-update-every="60" - data-width="120px" - data-common-max="1h_requests_pie" - data-decimal-digits="0" -></div>]]></ac:plain-text-body> - </ac:structured-macro> - <p class="auto-cursor-target"> - <br/> - </p> - </div> - </td> - <td colspan="1" style="text-align: center;"> - <div class="content-wrapper"> - <p class="auto-cursor-target"> - <br/> - </p> - <ac:structured-macro ac:macro-id="aff4446a-1432-407b-beb0-488c33eced18" ac:name="html" ac:schema-version="1"> - <ac:plain-text-body><![CDATA[<div - data-netdata="web_log_nginx_netdata.response_statuses" - data-host="https://frankfurt.my-netdata.io" - data-chart-library="easypiechart" - data-after="-14400" - data-before="0" - data-points="4" - data-title="frankfurt" - data-method="sum" - data-append-options="unaligned" - data-update-every="60" - data-width="120px" - data-common-max="1h_requests_pie" - data-decimal-digits="0" -></div>]]></ac:plain-text-body> - </ac:structured-macro> - <p class="auto-cursor-target"> - <br/> - </p> - </div> - </td> - <td colspan="1" style="text-align: center;"> - <div class="content-wrapper"> - <p class="auto-cursor-target"> - <br/> - </p> - <ac:structured-macro ac:macro-id="fd310534-627c-47bd-a184-361eb3f00489" ac:name="html" ac:schema-version="1"> - <ac:plain-text-body><![CDATA[<div - data-netdata="web_log_nginx_netdata.response_statuses" - data-host="https://sanfrancisco.my-netdata.io" - data-chart-library="easypiechart" - data-after="-14400" - data-before="0" - data-points="4" - data-title="sanfrancisco" - data-method="sum" - data-append-options="unaligned" - data-update-every="60" - data-width="120px" - data-common-max="1h_requests_pie" - data-decimal-digits="0" -></div>]]></ac:plain-text-body> - </ac:structured-macro> - <p class="auto-cursor-target"> - <br/> - </p> - </div> - </td> - <td colspan="1" style="text-align: center;"> - <div class="content-wrapper"> - <p class="auto-cursor-target"> - <br/> - </p> - <ac:structured-macro ac:macro-id="eb1261d5-8ff2-4a5c-8945-701bf04fb75b" ac:name="html" ac:schema-version="1"> - <ac:plain-text-body><![CDATA[<div - data-netdata="web_log_nginx_netdata.response_statuses" - data-host="https://toronto.my-netdata.io" - data-chart-library="easypiechart" - data-after="-14400" - data-before="0" - data-points="4" - data-title="toronto" - data-method="sum" - data-append-options="unaligned" - data-update-every="60" - data-width="120px" - data-common-max="1h_requests_pie" - data-decimal-digits="0" -></div>]]></ac:plain-text-body> - </ac:structured-macro> - <p class="auto-cursor-target"> - <br/> - </p> - </div> - </td> - </tr> - <tr> - <td colspan="1" style="text-align: right;"> - <strong>last<br/>1 hour</strong> - </td> - <td colspan="1" style="text-align: center;"> - <div class="content-wrapper"> - <p class="auto-cursor-target"> - <br/> - </p> - <ac:structured-macro ac:macro-id="d2ee8425-2c6c-4e26-8c5a-17f6153fdce1" ac:name="html" ac:schema-version="1"> - <ac:plain-text-body><![CDATA[<div - data-netdata="web_log_nginx_netdata.response_statuses" -data-host="https://london.my-netdata.io" - data-legend="false" - data-dygraph-yaxislabelwidth="35" - data-dygraph-ypixelsperlabel="8" -data-dygraph-xpixelsperlabel="30" -data-dygraph-xaxislabelwidth="26" - data-after="-3600" - data-before="0" - data-title="" - data-height="100px" - data-width="300px" -data-common-max="1h_requests" -data-decimal-digits="0" -></div>]]></ac:plain-text-body> - </ac:structured-macro> - <p class="auto-cursor-target"> - <br/> - </p> - </div> - </td> - <td colspan="1" style="text-align: center;"> - <div class="content-wrapper"> - <p class="auto-cursor-target"> - <br/> - </p> - <ac:structured-macro ac:macro-id="b3fb482a-4e9e-4b69-bb0b-9885d1687334" ac:name="html" ac:schema-version="1"> - <ac:plain-text-body><![CDATA[<div - data-netdata="web_log_nginx_netdata.response_statuses" -data-host="https://frankfurt.my-netdata.io" - data-legend="false" - data-dygraph-yaxislabelwidth="35" - data-dygraph-ypixelsperlabel="8" -data-dygraph-xpixelsperlabel="30" -data-dygraph-xaxislabelwidth="26" - data-after="-3600" - data-before="0" - data-title="" - data-height="100px" - data-width="300px" -data-common-max="1h_requests" -data-decimal-digits="0" -></div>]]></ac:plain-text-body> - </ac:structured-macro> - <p class="auto-cursor-target"> - <br/> - </p> - </div> - </td> - <td colspan="1" style="text-align: center;"> - <div class="content-wrapper"> - <p class="auto-cursor-target"> - <br/> - </p> - <ac:structured-macro ac:macro-id="199b1618-64be-4614-9662-f84cd01c6d8d" ac:name="html" ac:schema-version="1"> - <ac:plain-text-body><![CDATA[<div - data-netdata="web_log_nginx_netdata.response_statuses" -data-host="https://sanfrancisco.my-netdata.io" - data-legend="false" - data-dygraph-yaxislabelwidth="35" - data-dygraph-ypixelsperlabel="8" -data-dygraph-xpixelsperlabel="30" -data-dygraph-xaxislabelwidth="26" - data-after="-3600" - data-before="0" - data-title="" - data-height="100px" - data-width="300px" -data-common-max="1h_requests" -data-decimal-digits="0" -></div>]]></ac:plain-text-body> - </ac:structured-macro> - <p class="auto-cursor-target"> - <br/> - </p> - </div> - </td> - <td colspan="1" style="text-align: center;"> - <div class="content-wrapper"> - <p class="auto-cursor-target"> - <br/> - </p> - <ac:structured-macro ac:macro-id="61b2d444-fb2b-42e0-b4eb-611fb37dcb66" ac:name="html" ac:schema-version="1"> - <ac:plain-text-body><![CDATA[<div - data-netdata="web_log_nginx_netdata.response_statuses" -data-host="https://toronto.my-netdata.io" - data-legend="false" - data-dygraph-yaxislabelwidth="35" - data-dygraph-ypixelsperlabel="8" -data-dygraph-xpixelsperlabel="30" -data-dygraph-xaxislabelwidth="26" - data-after="-3600" - data-before="0" - data-title="" - data-height="100px" - data-width="300px" -data-common-max="1h_requests" -data-decimal-digits="0" -></div>]]></ac:plain-text-body> - </ac:structured-macro> - <p class="auto-cursor-target"> - <br/> - </p> - </div> - </td> - </tr> - <tr> - <td colspan="1" style="text-align: right;"> - <strong>last 10<br/>minutes</strong> - </td> - <td colspan="1" style="text-align: center;"> - <div class="content-wrapper"> - <p class="auto-cursor-target"> - <br/> - </p> - <ac:structured-macro ac:macro-id="f29e7663-f2e6-4e1d-a090-38704e0f2bd3" ac:name="html" ac:schema-version="1"> - <ac:plain-text-body><![CDATA[<div - data-netdata="web_log_nginx_netdata.response_statuses" -data-host="https://london.my-netdata.io" - data-legend="false" - data-dygraph-yaxislabelwidth="35" - data-dygraph-ypixelsperlabel="8" - data-after="-600" - data-before="0" - data-title="" - data-height="100px" - data-width="300px" -data-common-max="10m_requests" -data-decimal-digits="0" -></div>]]></ac:plain-text-body> - </ac:structured-macro> - <p class="auto-cursor-target"> - <br/> - </p> - </div> - </td> - <td colspan="1" style="text-align: center;"> - <div class="content-wrapper"> - <p class="auto-cursor-target"> - <br/> - </p> - <ac:structured-macro ac:macro-id="245ccc90-1505-430b-ba13-15e6a9793c11" ac:name="html" ac:schema-version="1"> - <ac:plain-text-body><![CDATA[<div - data-netdata="web_log_nginx_netdata.response_statuses" -data-host="https://frankfurt.my-netdata.io" - data-legend="false" - data-dygraph-yaxislabelwidth="35" - data-dygraph-ypixelsperlabel="8" - data-after="-600" - data-before="0" - data-title="" - data-height="100px" - data-width="300px" -data-common-max="10m_requests" -data-decimal-digits="0" -></div>]]></ac:plain-text-body> - </ac:structured-macro> - <p class="auto-cursor-target"> - <br/> - </p> - </div> - </td> - <td colspan="1" style="text-align: center;"> - <div class="content-wrapper"> - <p class="auto-cursor-target"> - <br/> - </p> - <ac:structured-macro ac:macro-id="864ff17f-f372-47e4-9d57-54e44b142240" ac:name="html" ac:schema-version="1"> - <ac:plain-text-body><![CDATA[<div - data-netdata="web_log_nginx_netdata.response_statuses" -data-host="https://sanfrancisco.my-netdata.io" - data-legend="false" - data-dygraph-yaxislabelwidth="35" - data-dygraph-ypixelsperlabel="8" - data-after="-600" - data-before="0" - data-title="" - data-height="100px" - data-width="300px" -data-common-max="10m_requests" -data-decimal-digits="0" -></div>]]></ac:plain-text-body> - </ac:structured-macro> - <p class="auto-cursor-target"> - <br/> - </p> - </div> - </td> - <td colspan="1" style="text-align: center;"> - <div class="content-wrapper"> - <p class="auto-cursor-target"> - <br/> - </p> - <ac:structured-macro ac:macro-id="e0072f2b-0169-4ecf-8ddf-724270d185b8" ac:name="html" ac:schema-version="1"> - <ac:plain-text-body><![CDATA[<div - data-netdata="web_log_nginx_netdata.response_statuses" -data-host="https://toronto.my-netdata.io" - data-legend="false" - data-dygraph-yaxislabelwidth="35" - data-dygraph-ypixelsperlabel="8" - data-after="-600" - data-before="0" - data-title="" - data-height="100px" - data-width="300px" -data-common-max="10m_requests" -data-decimal-digits="0" -></div>]]></ac:plain-text-body> - </ac:structured-macro> - <p class="auto-cursor-target"> - <br/> - </p> - </div> - </td> - </tr> - <tr> - <td style="text-align: right;"> - <strong>last 1<br/>minute</strong> - </td> - <td style="text-align: center;"> - <div class="content-wrapper"> - <p class="auto-cursor-target"> - <br/> - </p> - <ac:structured-macro ac:macro-id="8c041cfb-a5a0-425c-afe6-207f4986cb26" ac:name="html" ac:schema-version="1"> - <ac:plain-text-body><![CDATA[<embed src="https://london.my-netdata.io/api/v1/badge.svg?chart=web_log_nginx_netdata.response_statuses&alarm=1m_successful&refresh=auto&label=1m%20london%20successful%20requests" type="image/svg+xml" height="20"/> -<br/> -<div - data-netdata="web_log_nginx_netdata.response_statuses" -data-host="https://london.my-netdata.io" - data-legend="false" - data-dygraph-yaxislabelwidth="35" - data-dygraph-ypixelsperlabel="8" - data-after="-60" - data-before="0" - data-title="" - data-height="100px" - data-width="300px" - data-append-options="percentage" - data-decimal-digits="0" - data-dygraph-valuerange="[0, 100]" - data-dygraph-includezero="true" - data-units="%" -data-dimensions="success" -data-colors="#009900" -></div>]]></ac:plain-text-body> - </ac:structured-macro> - <p class="auto-cursor-target"> - <br/> - </p> - </div> - </td> - <td style="text-align: center;"> - <div class="content-wrapper"> - <p class="auto-cursor-target"> - <br/> - </p> - <ac:structured-macro ac:macro-id="a3777583-9919-4997-891c-94a8cec60604" ac:name="html" ac:schema-version="1"> - <ac:plain-text-body><![CDATA[<embed src="https://frankfurt.my-netdata.io/api/v1/badge.svg?chart=web_log_nginx_netdata.response_statuses&alarm=1m_successful&refresh=auto&label=1m%20frankfurt%20successful%20requests" type="image/svg+xml" height="20"/> -<br/> -<div - data-netdata="web_log_nginx_netdata.response_statuses" -data-host="https://frankfurt.my-netdata.io" - data-legend="false" - data-dygraph-yaxislabelwidth="35" - data-dygraph-ypixelsperlabel="8" - data-after="-60" - data-before="0" - data-title="" - data-height="100px" - data-width="300px" - data-append-options="percentage" - data-decimal-digits="0" - data-dygraph-valuerange="[0, 100]" - data-dygraph-includezero="true" - data-units="%" -data-dimensions="success" -data-colors="#009900" -></div>]]></ac:plain-text-body> - </ac:structured-macro> - <p class="auto-cursor-target"> - <br/> - </p> - </div> - </td> - <td colspan="1" style="text-align: center;"> - <div class="content-wrapper"> - <p class="auto-cursor-target"> - <br/> - </p> - <ac:structured-macro ac:macro-id="e003deba-82fa-4aec-8264-6cb7d814a299" ac:name="html" ac:schema-version="1"> - <ac:plain-text-body><![CDATA[<embed src="https://sanfrancisco.my-netdata.io/api/v1/badge.svg?chart=web_log_nginx_netdata.response_statuses&alarm=1m_successful&refresh=auto&label=1m%20sanfrancisco%20successful%20requests" type="image/svg+xml" height="20"/> -<br/> -<div - data-netdata="web_log_nginx_netdata.response_statuses" -data-host="https://sanfrancisco.my-netdata.io" - data-legend="false" - data-dygraph-yaxislabelwidth="35" - data-dygraph-ypixelsperlabel="8" - data-after="-60" - data-before="0" - data-title="" - data-height="100px" - data-width="300px" - data-append-options="percentage" - data-decimal-digits="0" - data-dygraph-valuerange="[0, 100]" - data-dygraph-includezero="true" - data-units="%" -data-dimensions="success" -data-colors="#009900" -></div>]]></ac:plain-text-body> - </ac:structured-macro> - <p class="auto-cursor-target"> - <br/> - </p&g |