1
2
3
4
5
6
7
8
9
10
11
12
13
14
15
16
17
18
19
20
21
22
23
24
25
26
27
28
29
30
31
32
33
34
35
36
37
38
39
40
41
42
43
44
45
46
47
48
49
50
51
52
53
54
55
56
57
58
59
60
61
62
63
64
65
66
67
68
69
70
71
72
73
74
75
76
77
78
79
80
81
82
83
84
85
86
87
88
89
90
91
92
93
94
95
96
97
98
99
100
101
102
103
104
105
106
107
108
109
110
111
112
113
114
115
116
117
118
119
120
121
122
123
124
125
126
127
128
129
130
131
132
133
134
135
136
137
138
139
140
141
142
143
144
145
146
147
148
149
150
151
152
153
154
155
156
157
158
159
160
161
162
163
164
165
166
167
168
169
170
171
172
173
174
175
176
177
178
179
180
181
182
183
184
185
186
187
188
189
190
191
192
193
194
195
196
197
198
199
200
201
202
203
204
205
206
207
208
209
210
211
212
213
214
215
216
217
218
219
220
221
222
223
224
225
226
227
228
229
230
231
232
233
234
235
236
237
238
239
240
241
242
243
244
245
246
247
248
249
250
251
252
253
254
255
256
257
258
259
260
261
262
263
264
265
266
267
268
269
270
271
272
273
274
275
276
277
278
279
280
281
282
283
284
285
286
287
288
289
290
291
292
293
294
295
296
297
298
299
300
301
302
303
304
305
306
307
308
309
310
311
312
313
314
315
316
317
318
319
320
321
322
323
324
325
326
327
328
329
330
331
332
333
334
335
336
337
338
339
340
341
342
343
344
345
346
347
348
349
350
351
352
353
354
355
356
357
358
359
360
361
362
363
364
365
366
367
368
369
370
371
372
373
374
375
376
377
378
379
380
381
382
383
384
385
386
387
388
389
390
391
|
# `systemd` journal plugin
[KEY FEATURES](#key-features) | [JOURNAL SOURCES](#journal-sources) | [JOURNAL FIELDS](#journal-fields) |
[PLAY MODE](#play-mode) | [FULL TEXT SEARCH](#full-text-search) | [PERFORMANCE](#query-performance) |
[CONFIGURATION](#configuration-and-maintenance) | [FAQ](#faq)
The `systemd` journal plugin by Netdata makes viewing, exploring and analyzing `systemd` journal logs simple and
efficient.
It automatically discovers available journal sources, allows advanced filtering, offers interactive visual
representations and supports exploring the logs of both individual servers and the logs on infrastructure wide
journal centralization servers.
## Key features
- Works on both **individual servers** and **journal centralization servers**.
- Supports `persistent` and `volatile` journals.
- Supports `system`, `user`, `namespaces` and `remote` journals.
- Allows filtering on **any journal field** or **field value**, for any time-frame.
- Allows **full text search** (`grep`) on all journal fields, for any time-frame.
- Provides a **histogram** for log entries over time, with a break down per field-value, for any field and any
time-frame.
- Works directly on journal files, without any other third-party components.
- Supports coloring log entries, the same way `journalctl` does.
- In PLAY mode provides the same experience as `journalctl -f`, showing new log entries immediately after they are
received.
### Prerequisites
`systemd-journal.plugin` is a Netdata Function Plugin.
To protect your privacy, as with all Netdata Functions, a free Netdata Cloud user account is required to access it.
For more information check [this discussion](https://github.com/netdata/netdata/discussions/16136).
### Limitations
#### Plugin availability
The following are limitations related to the availability of the plugin:
- This plugin is not available when Netdata is installed in a container. The problem is that `libsystemd` is not
available in Alpine Linux (there is a `libsystemd`, but it is a dummy that returns failure on all calls). We plan to
change this, by shipping Netdata containers based on Debian.
- For the same reason (lack of `systemd` support for Alpine Linux), the plugin is not available on `static` builds of
Netdata (which are based on `muslc`, not `glibc`).
- On old systemd systems (like Centos 7), the plugin runs always in "full data query" mode, which makes it slower. The
reason, is that systemd API is missing some important calls we need to use the field indexes of `systemd` journal.
However, when running in this mode, the plugin offers also negative matches on the data (like filtering for all logs
that do not have set some field), and this is the reason "full data query" mode is also offered as an option even on
newer versions of `systemd`.
To use the plugin, install one of our native distribution packages, or install it from source.
#### `systemd` journal features
The following are limitations related to the features of `systemd` journal:
- This plugin does not support binary field values. `systemd` journal has the ability to assign fields with binary data.
This plugin assumes all fields contain text values (text in this context includes numbers).
- This plugin does not support multiple values per field for any given log entry. `systemd` journal has the ability to
accept the same field key, multiple times, with multiple values on a single log entry. This plugin will present the
last value and ignore the others for this log entry.
- This plugin will only read journal files located in `/var/log/journal` or `/run/log/journal`. `systemd-journal-remote` has the
ability to store journal files anywhere (user configured). If journal files are not located in `/var/log/journal`
or `/run/log/journal` (and any of their subdirectories), the plugin will not find them.
Other than the above, this plugin supports all features of `systemd` journals.
## Journal Sources
The plugin automatically detects the available journal sources, based on the journal files available in
`/var/log/journal` (persistent logs) and `/run/log/journal` (volatile logs).
The plugin, by default, merges all journal sources together, to provide a unified view of all log messages available.
> To improve query performance, we recommend selecting the relevant journal source, before doing more analysis on the
> logs.
### `system` journals
`system` journals are the default journals available on all `systemd` based systems.
`system` journals contain:
- kernel log messages (via `kmsg`),
- audit records, originating from the kernel audit subsystem,
- messages received by `systemd-journald` via `syslog`,
- messages received via the standard output and error of service units,
- structured messages received via the native journal API.
### `user` journals
Unlike `journalctl`, the Netdata plugin allows viewing, exploring and querying the journal files of **all users**.
By default, each user, with a UID outside the range of system users (0 - 999), dynamic service users,
and the nobody user (65534), will get their own set of `user` journal files. For more information about
this policy check [Users, Groups, UIDs and GIDs on systemd Systems](https://systemd.io/UIDS-GIDS/).
Keep in mind that `user` journals are merged with the `system` journals when they are propagated to a journal
centralization server. So, at the centralization server, the `remote` journals contain both the `system` and `user`
journals of the sender.
### `namespaces` journals
The plugin auto-detects the namespaces available and provides a list of all namespaces at the "sources" list on the UI.
Journal namespaces are both a mechanism for logically isolating the log stream of projects consisting
of one or more services from the rest of the system and a mechanism for improving performance.
`systemd` service units may be assigned to a specific journal namespace through the `LogNamespace=` unit file setting.
Keep in mind that namespaces require special configuration to be propagated to a journal centralization server.
This makes them a little more difficult to handle, from the administration perspective.
### `remote` journals
Remote journals are created by `systemd-journal-remote`. This `systemd` feature allows creating logs centralization
points within your infrastructure, based exclusively on `systemd`.
Usually `remote` journals are named by the IP of the server sending these logs. The Netdata plugin automatically
extracts these IPs and performs a reverse DNS lookup to find their hostnames. When this is successful,
`remote` journals are named by the hostnames of the origin servers.
For information about configuring a journal centralization server,
check [this FAQ item](#how-do-i-configure-a-journal-centralization-server).
## Journal Fields
`systemd` journals are designed to support multiple fields per log entry. The power of `systemd` journals is that,
unlike other log management systems, it supports dynamic and variable fields for each log message,
while all fields and their values are indexed for fast querying.
This means that each application can log messages annotated with its own unique fields and values, and `systemd`
journals will automatically index all of them, without any configuration or manual action.
For a description of the most frequent fields found in `systemd` journals, check `man systemd.journal-fields`.
Fields found in the journal files are automatically added to the UI in multiple places to help you explore
and filter the data.
The plugin automatically enriches certain fields to make them more user-friendly:
- `_BOOT_ID`: the hex value is annotated with the timestamp of the first message encountered for this boot id.
- `PRIORITY`: the numeric value is replaced with the human-readable name of each priority.
- `SYSLOG_FACILITY`: the encoded value is replaced with the human-readable name of each facility.
- `ERRNO`: the numeric value is annotated with the short name of each value.
- `_UID` `_AUDIT_LOGINUID`, `_SYSTEMD_OWNER_UID`, `OBJECT_UID`, `OBJECT_SYSTEMD_OWNER_UID`, `OBJECT_AUDIT_LOGINUID`:
the local user database is consulted to annotate them with usernames.
- `_GID`, `OBJECT_GID`: the local group database is consulted to annotate them with group names.
- `_CAP_EFFECTIVE`: the encoded value is annotated with a human-readable list of the linux capabilities.
- `_SOURCE_REALTIME_TIMESTAMP`: the numeric value is annotated with human-readable datetime in UTC.
The values of all other fields are presented as found in the journals.
> IMPORTANT:
> The UID and GID annotations are added during presentation and are taken from the server running the plugin.
> For `remote` sources, the names presented may not reflect the actual user and group names on the origin server.
> The numeric value will still be visible though, as-is on the origin server.
The annotations are not searchable with full-text search. They are only added for the presentation of the fields.
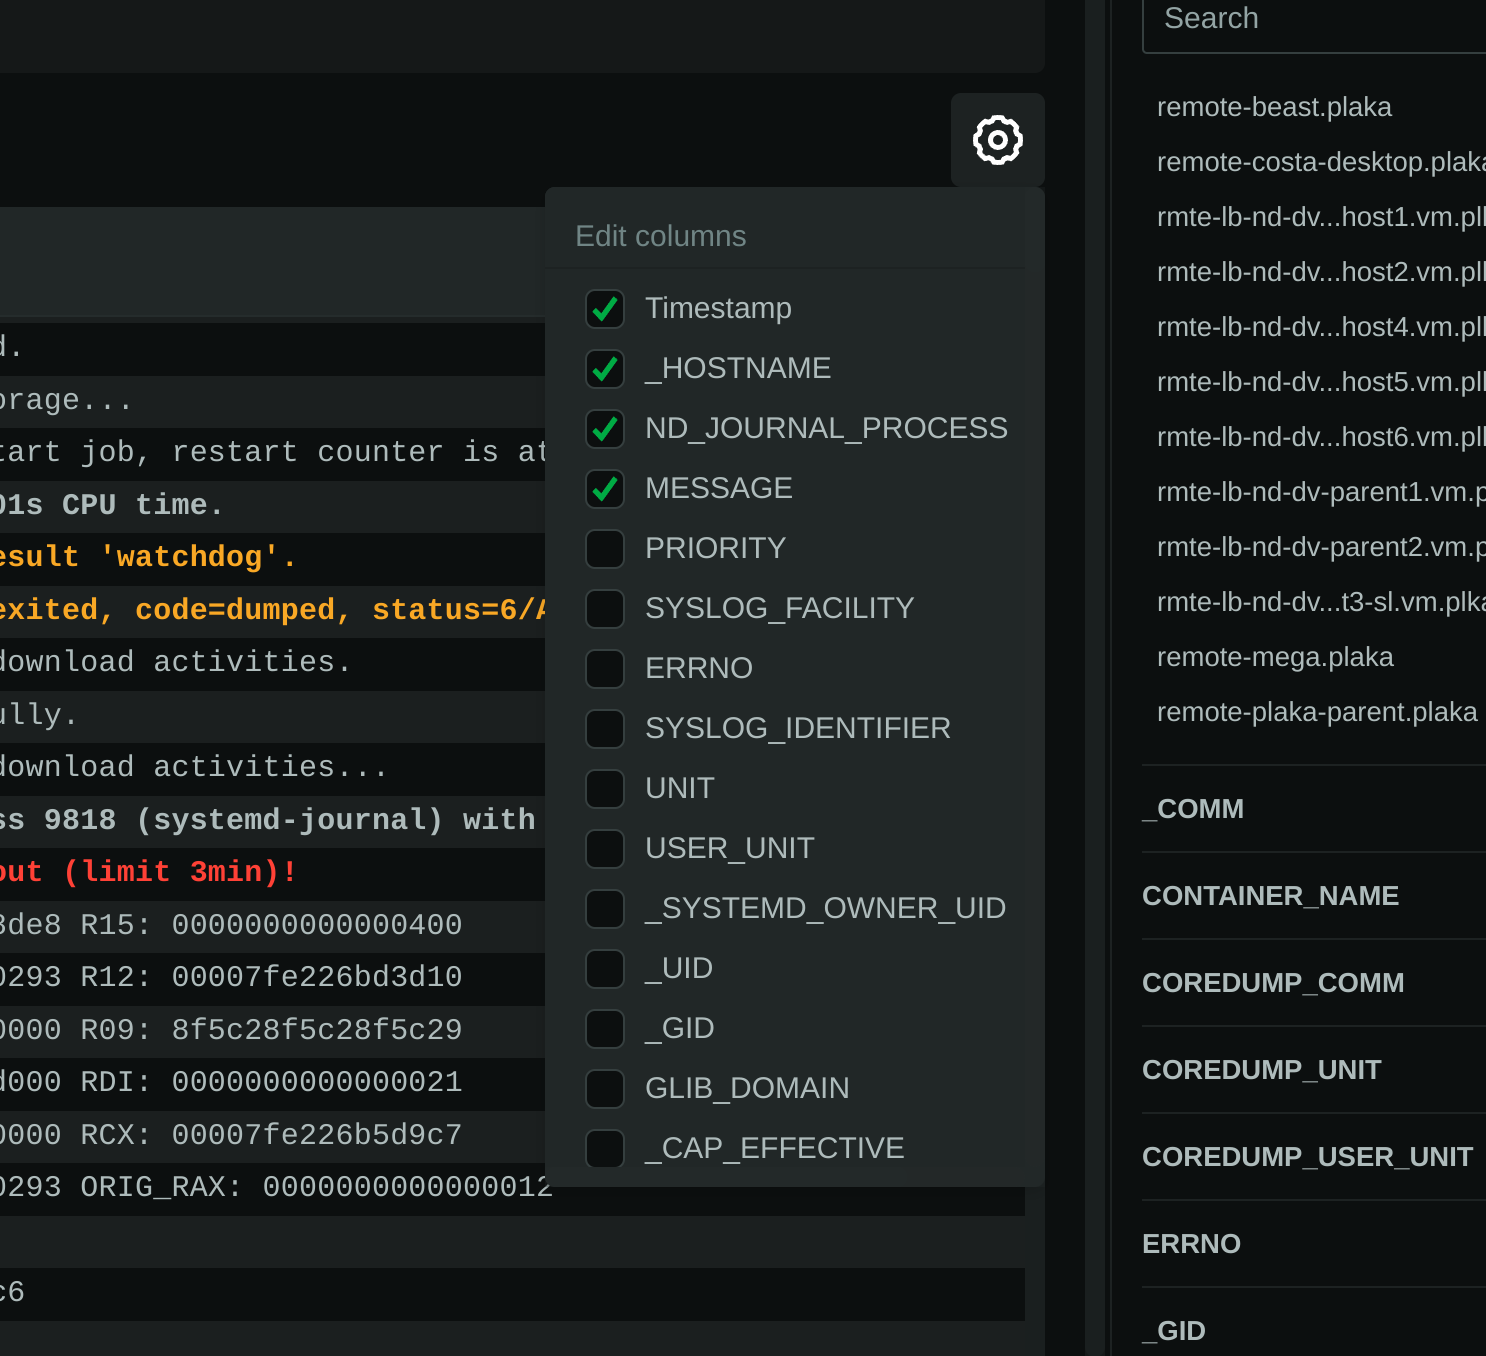
### Journal fields as columns in the table
All journal fields available in the journal files are offered as columns on the UI. Use the gear button above the table:
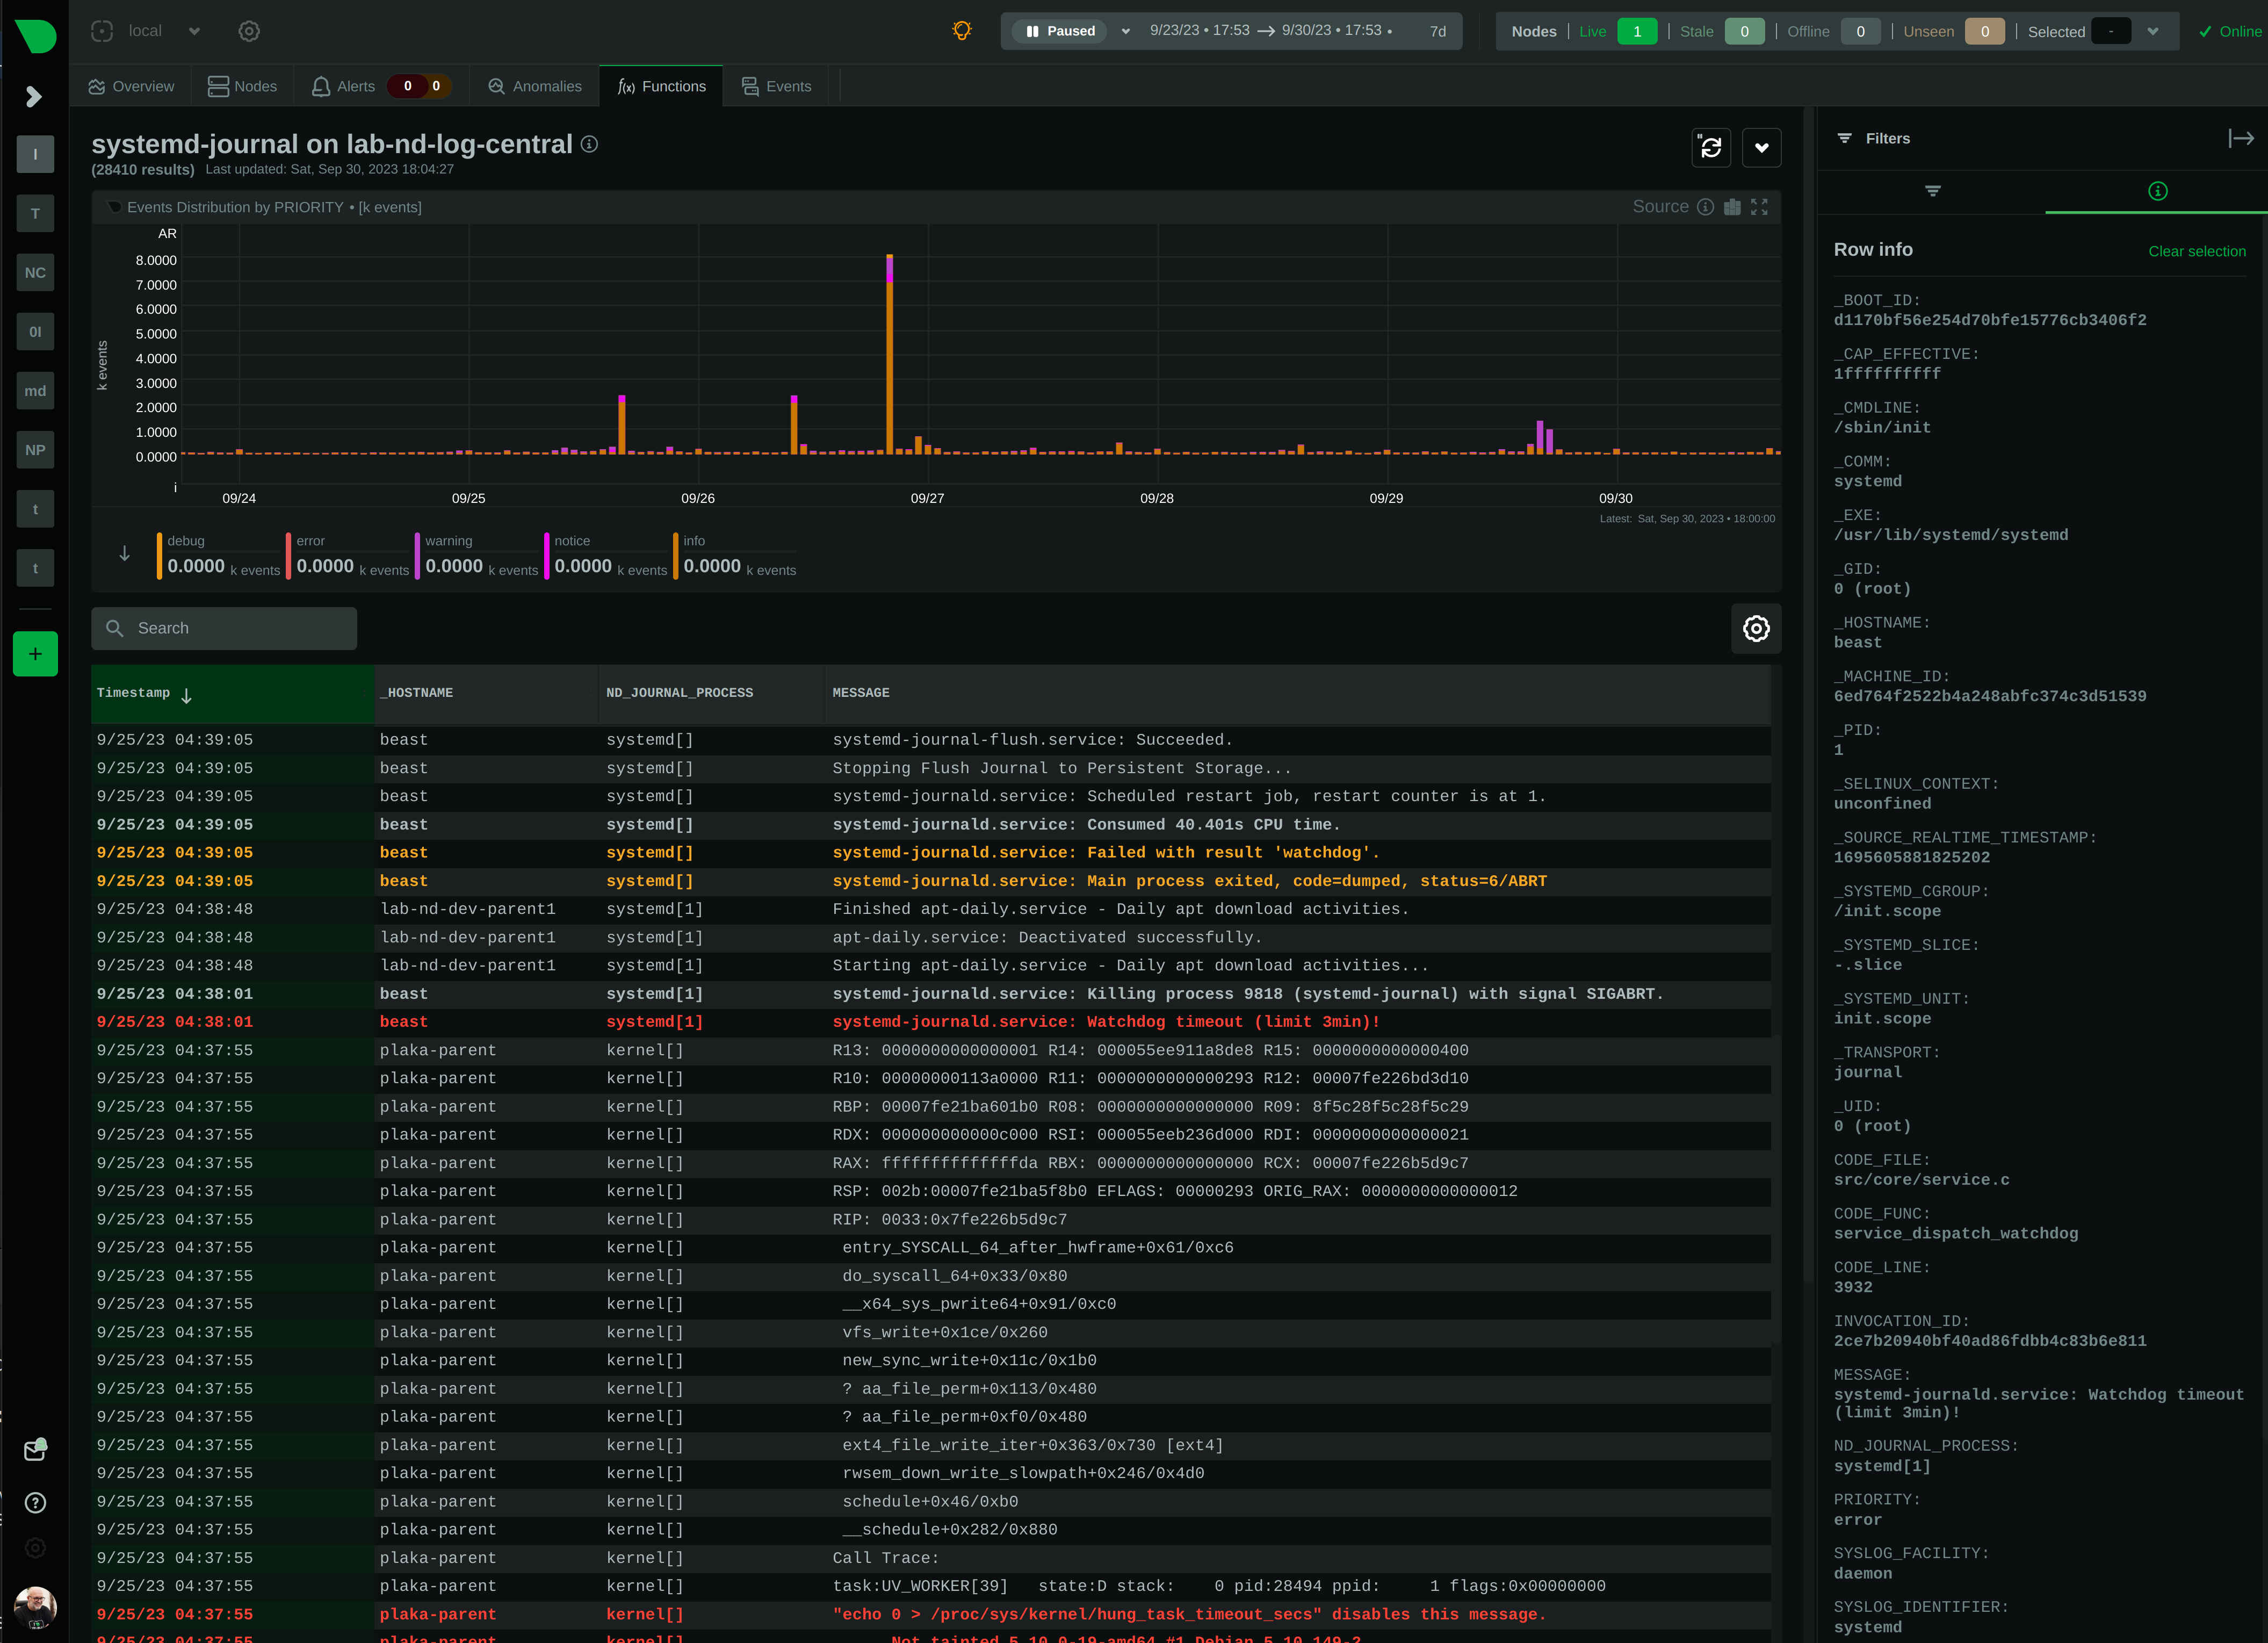
### Journal fields as additional info to each log entry
When you click a log line, the `info` sidebar will open on the right of the screen, to provide the full list of fields
related to this log line. You can close this `info` sidebar, by selecting the filter icon at its top.
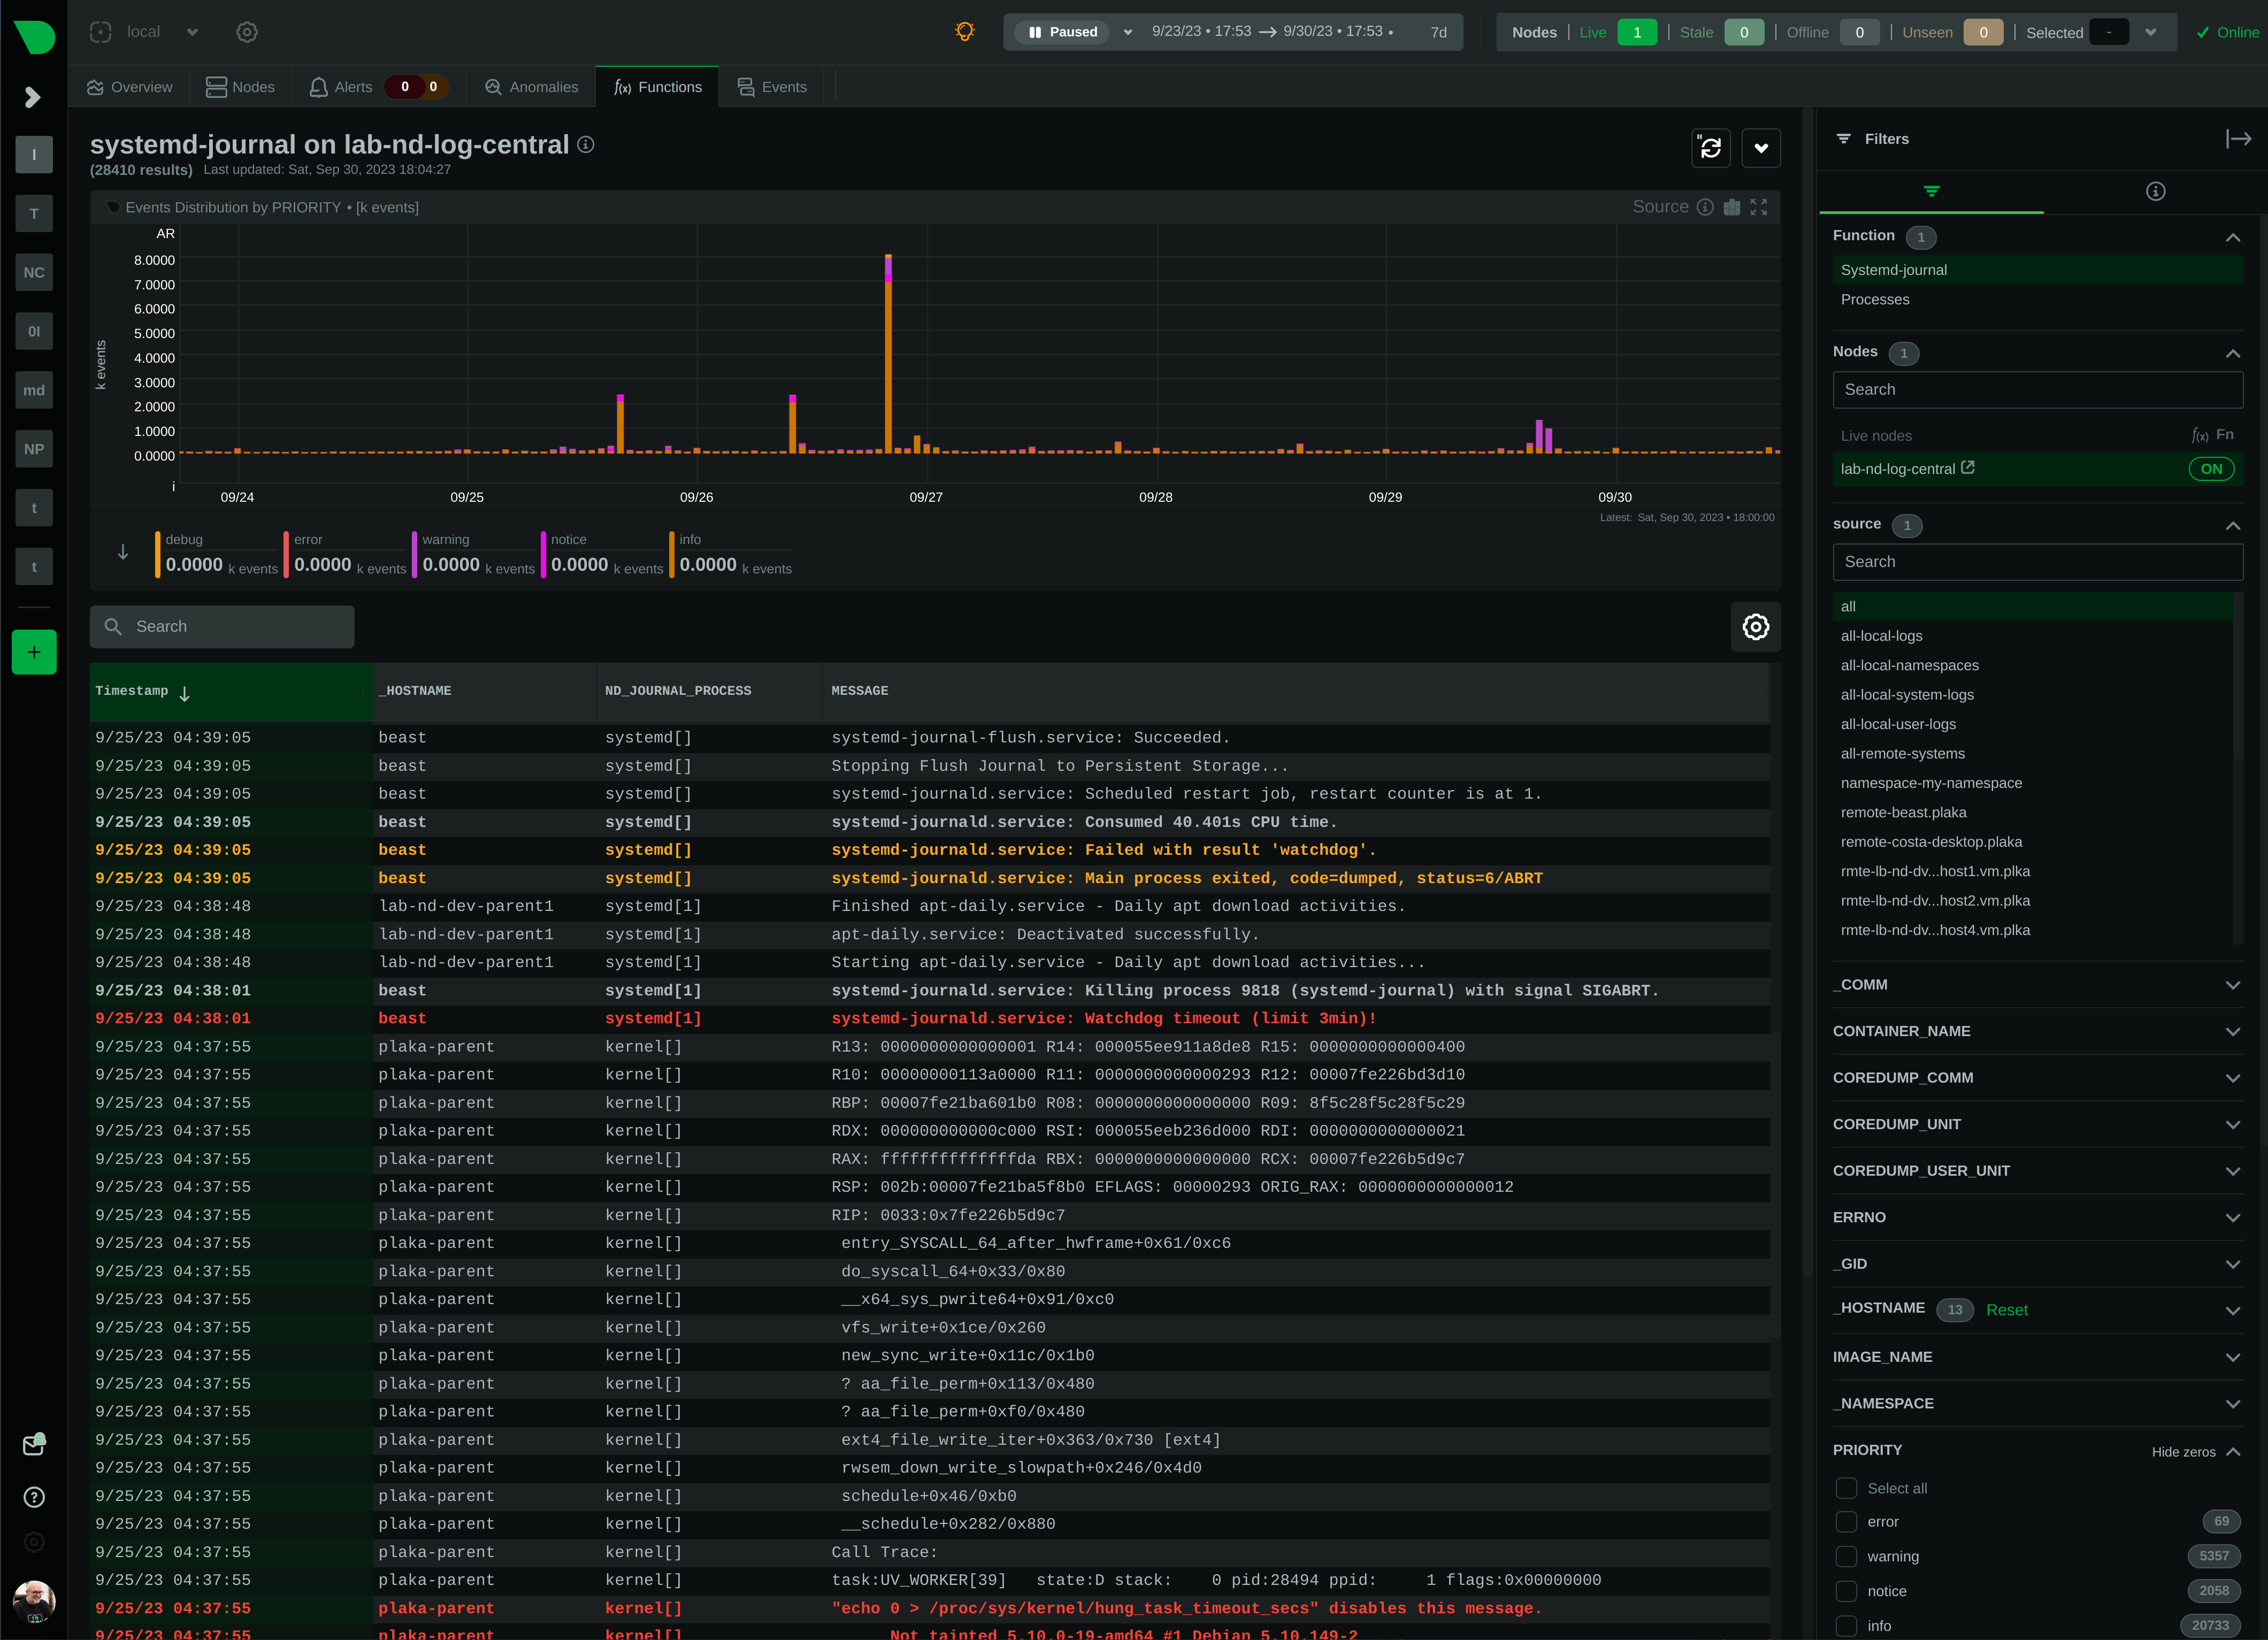
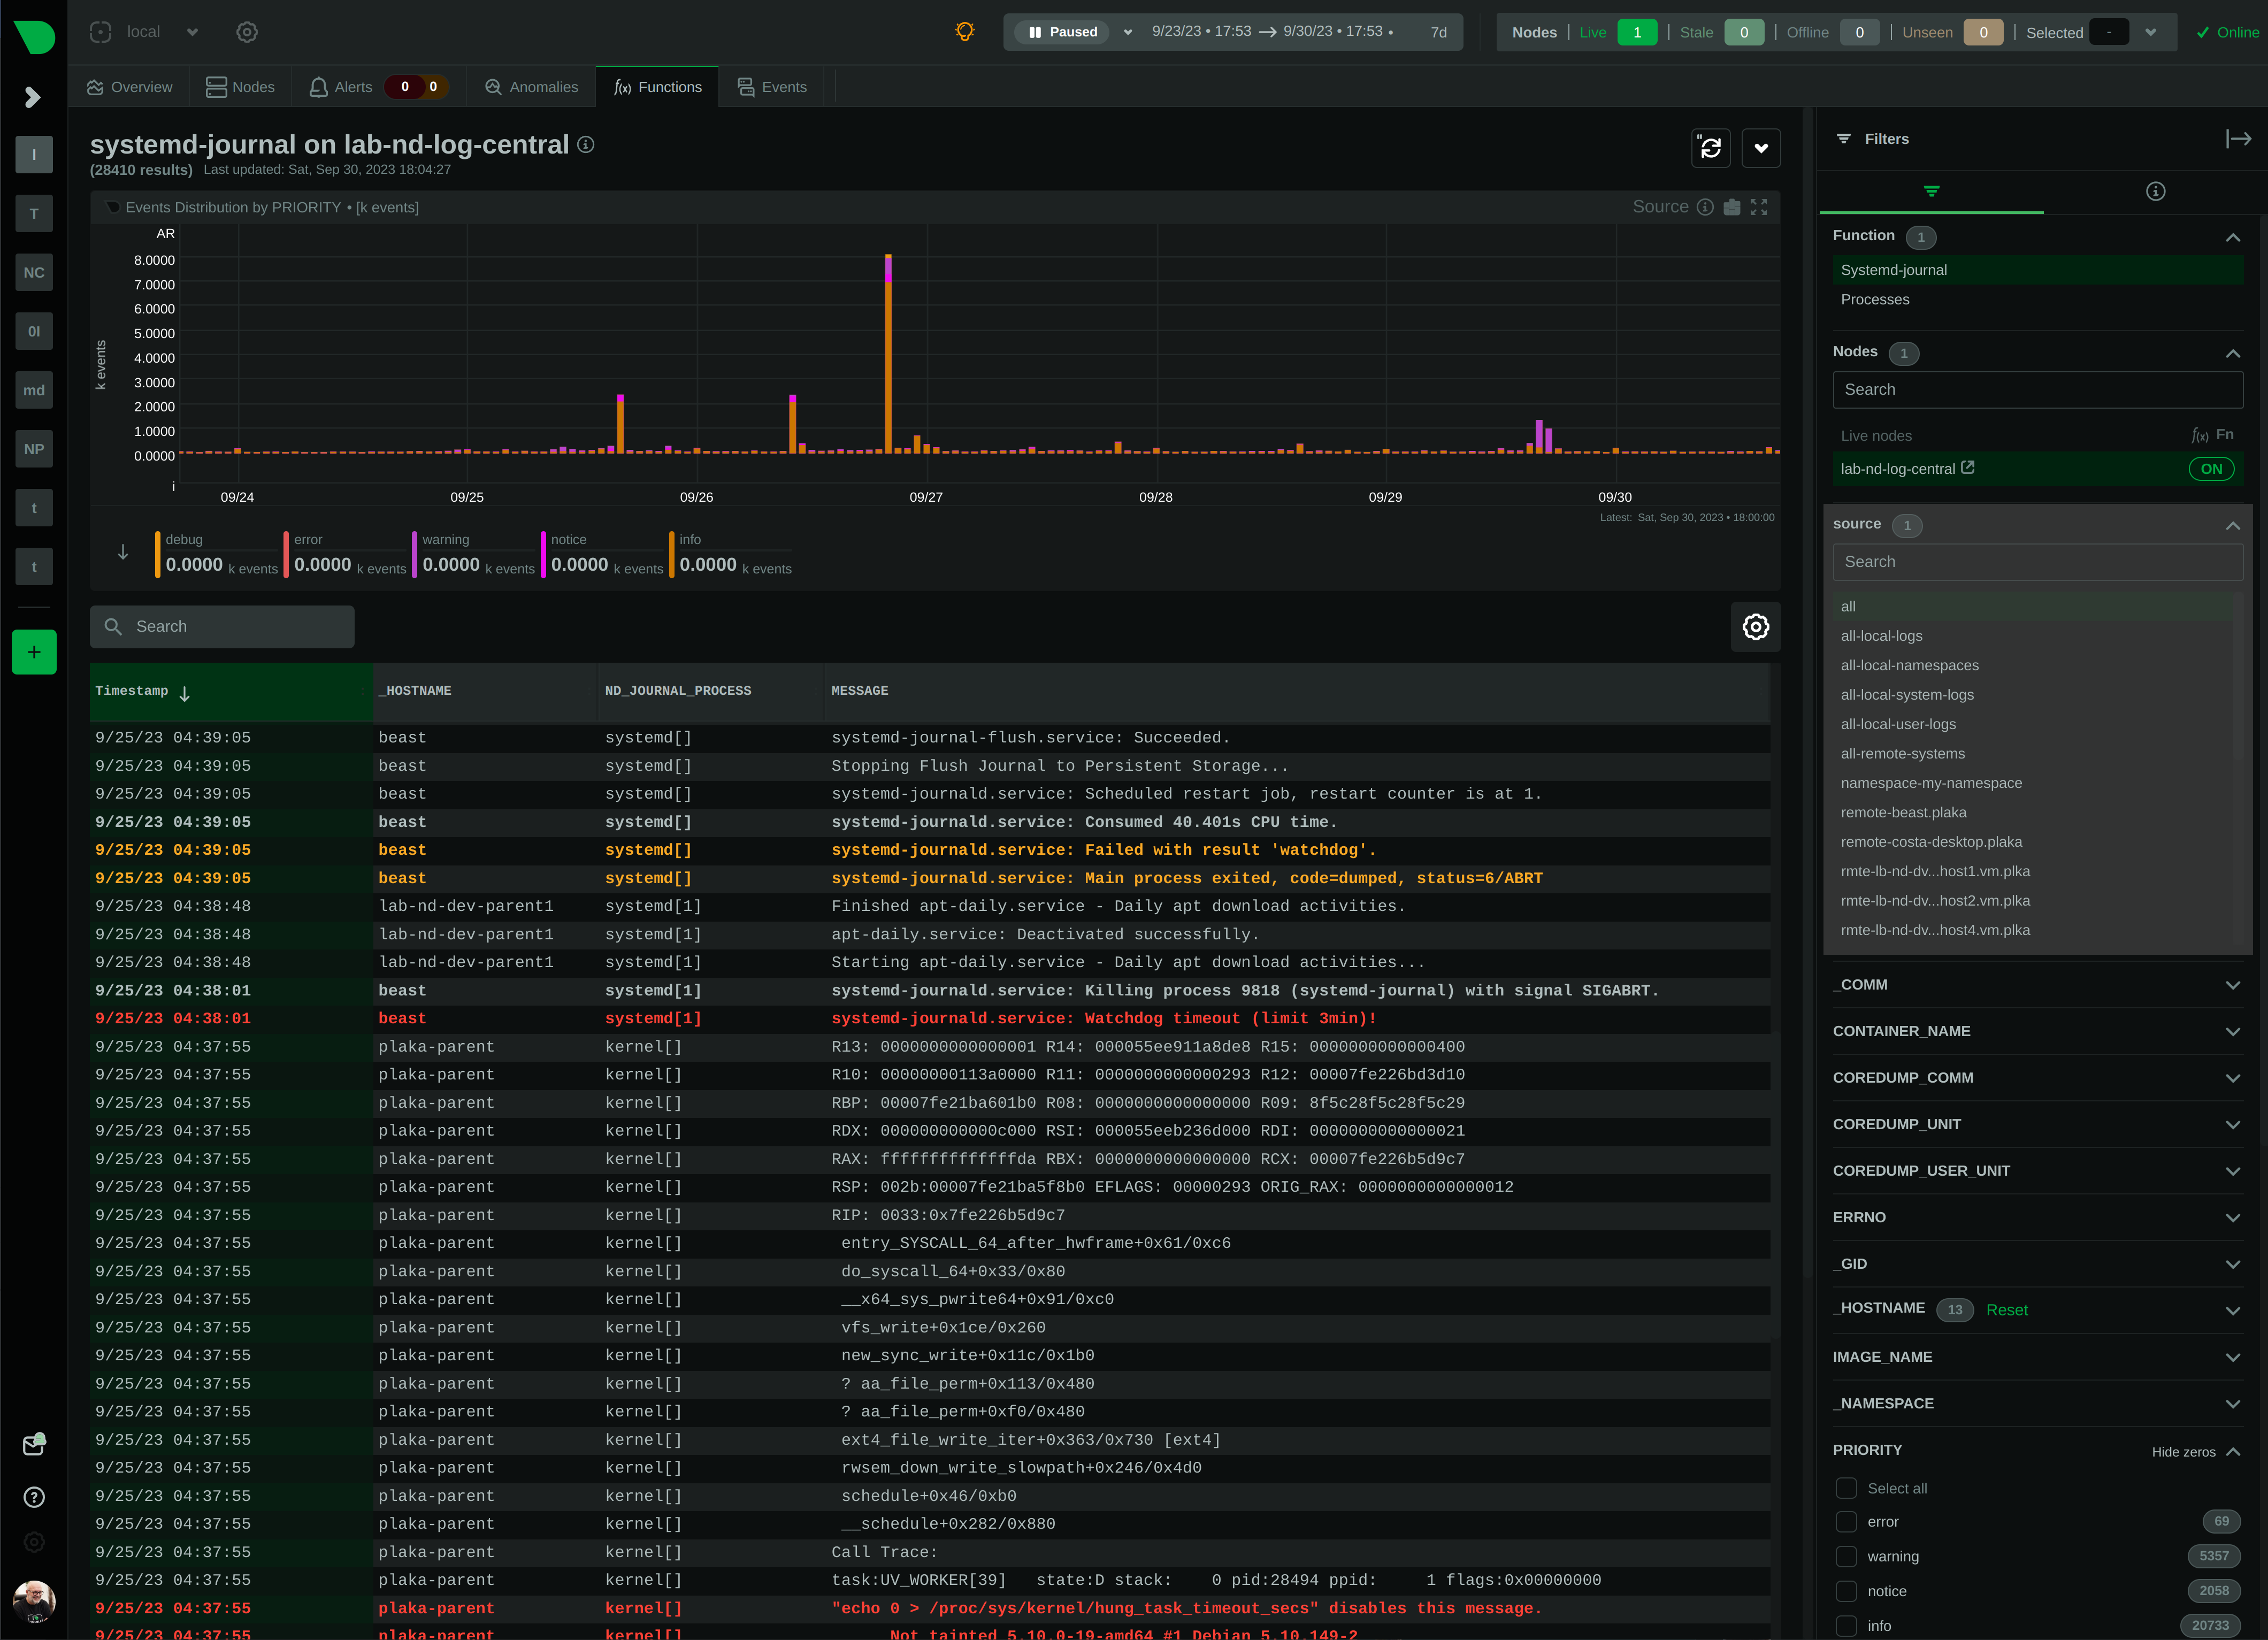
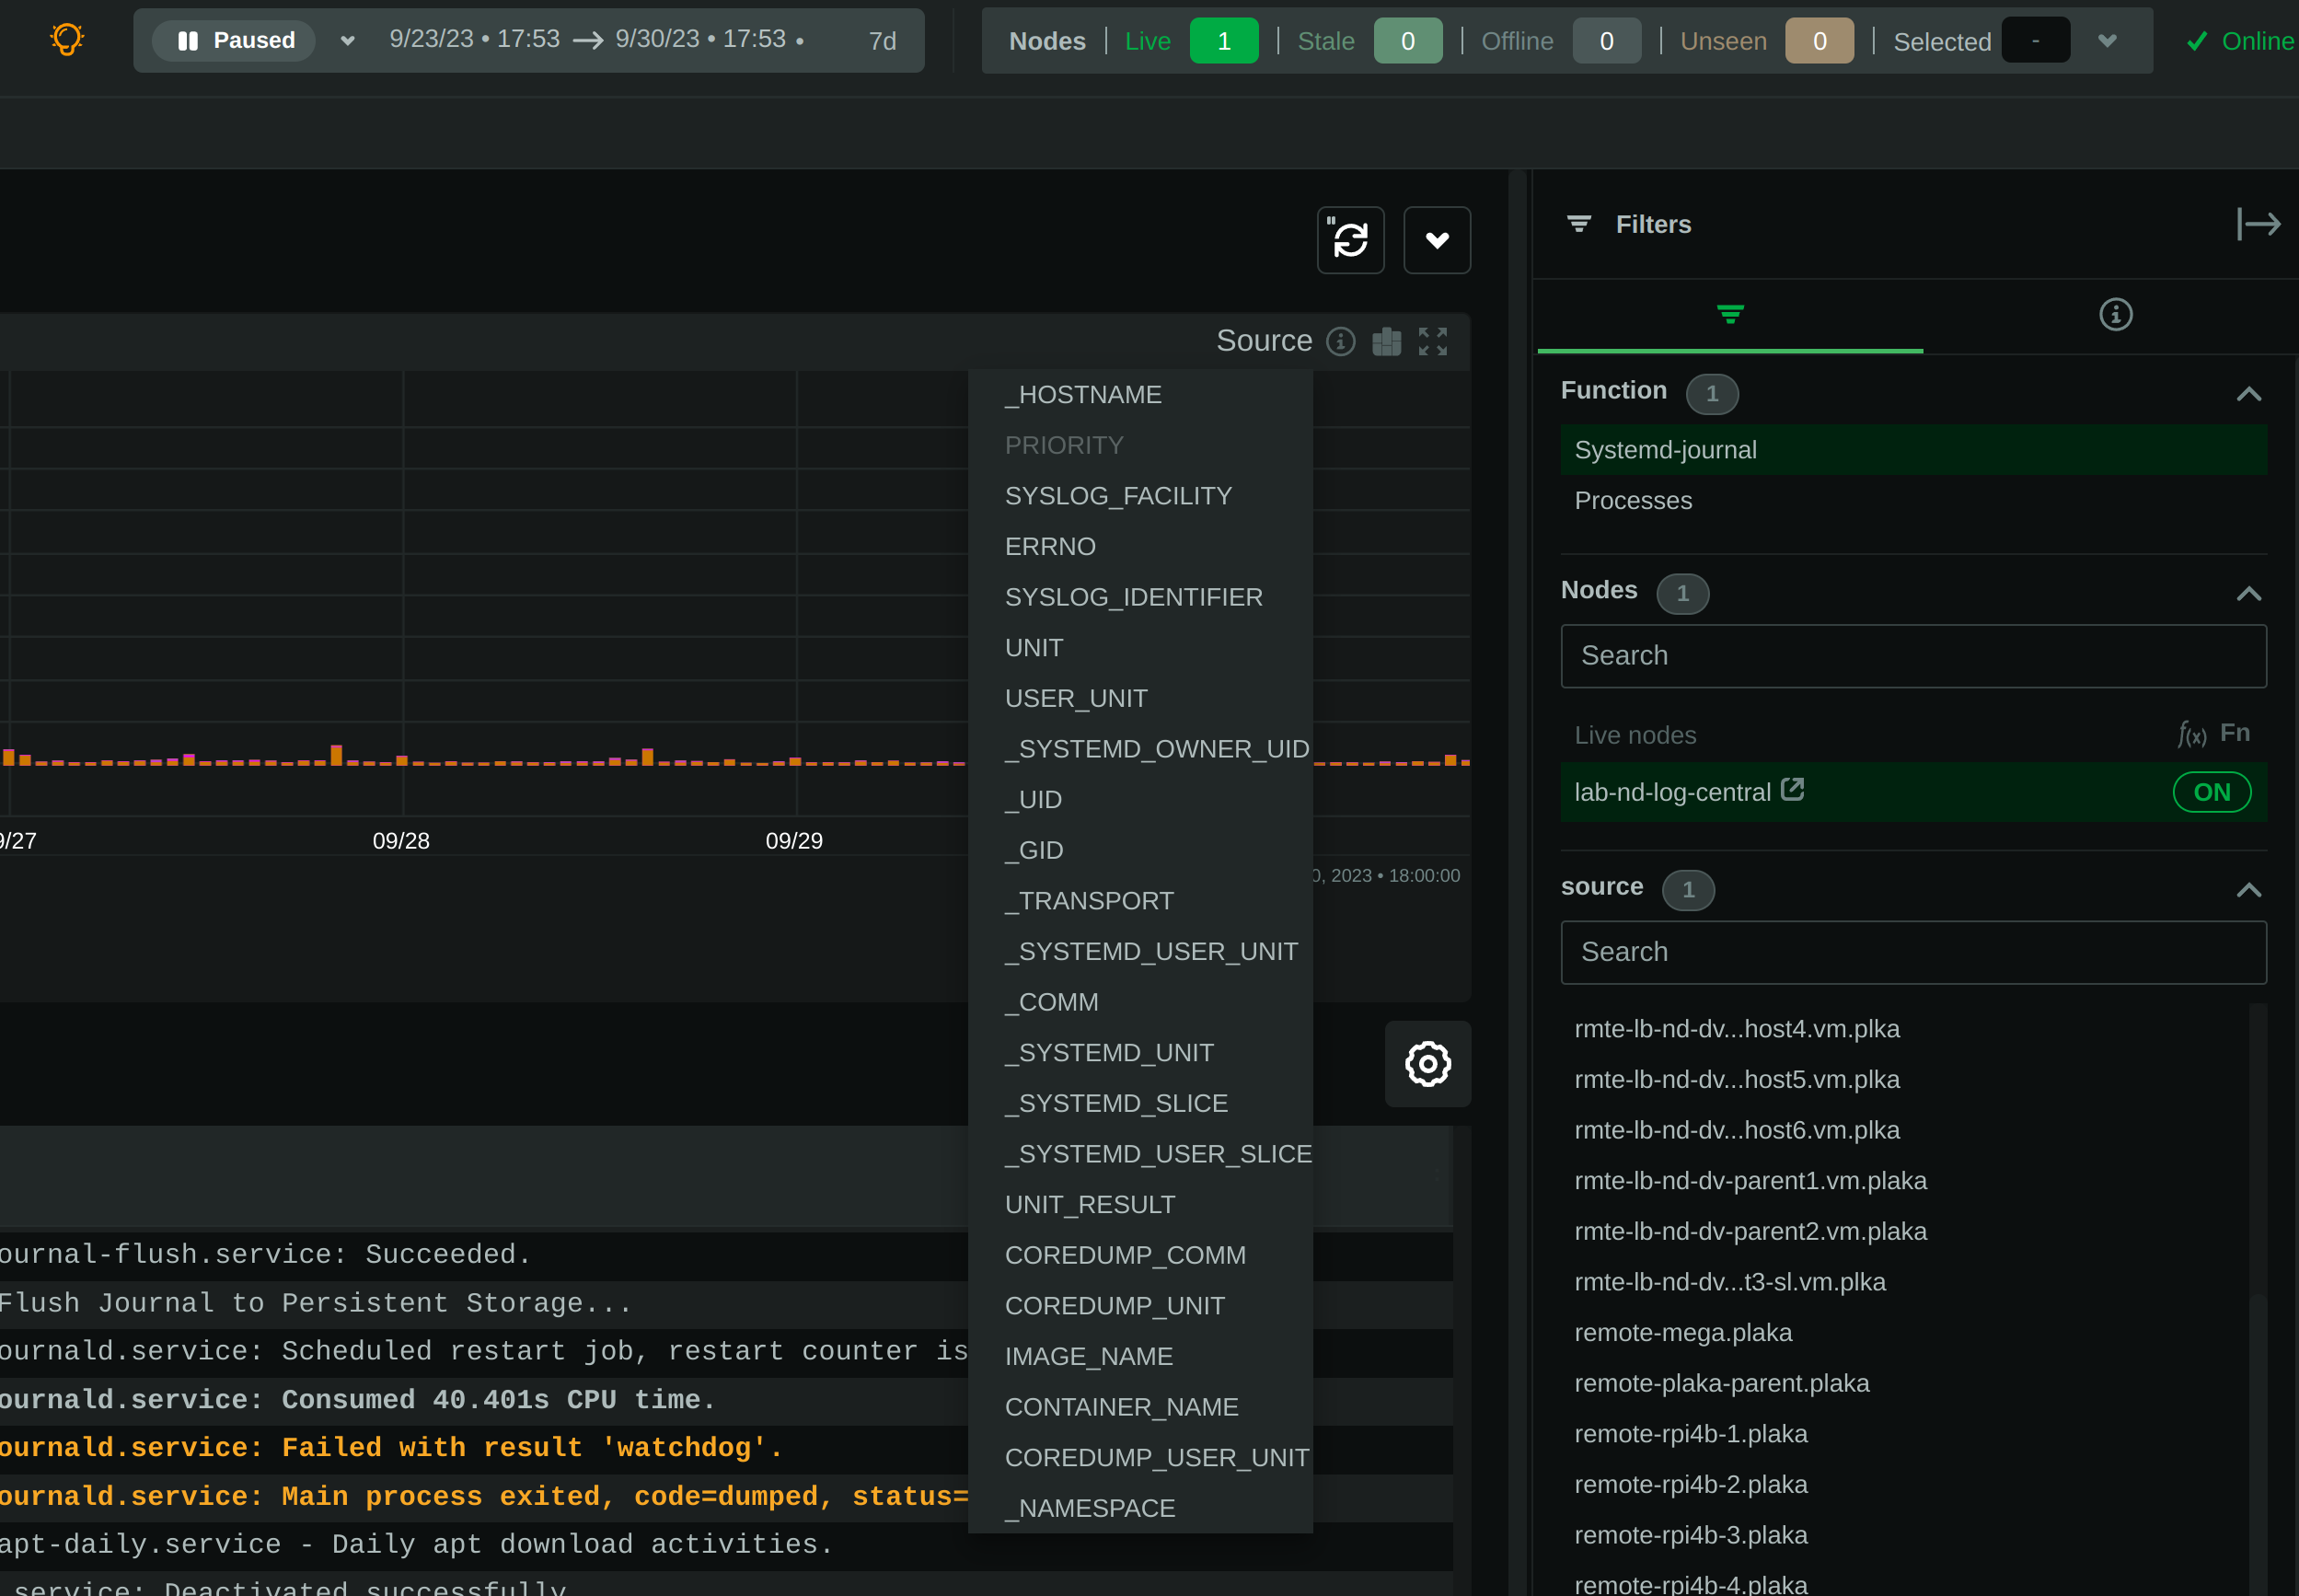
### Journal fields as filters
The plugin presents a select list of fields as filters to the query, with counters for each of the possible values
for the field. This list can used to quickly check which fields and values are available for the entire time-frame
of the query.
Internally the plugin has:
1. A white-list of fields, to be presented as filters.
2. A black-list of fields, to prevent them from becoming filters. This list includes fields with a very high
cardinality, like timestamps, unique message ids, etc. This is mainly for protecting the server's performance,
to avoid building in memory indexes for the fields that almost each of their values is unique.
Keep in mind that the values presented in the filters, and their sorting is affected by the "full data queries"
setting:
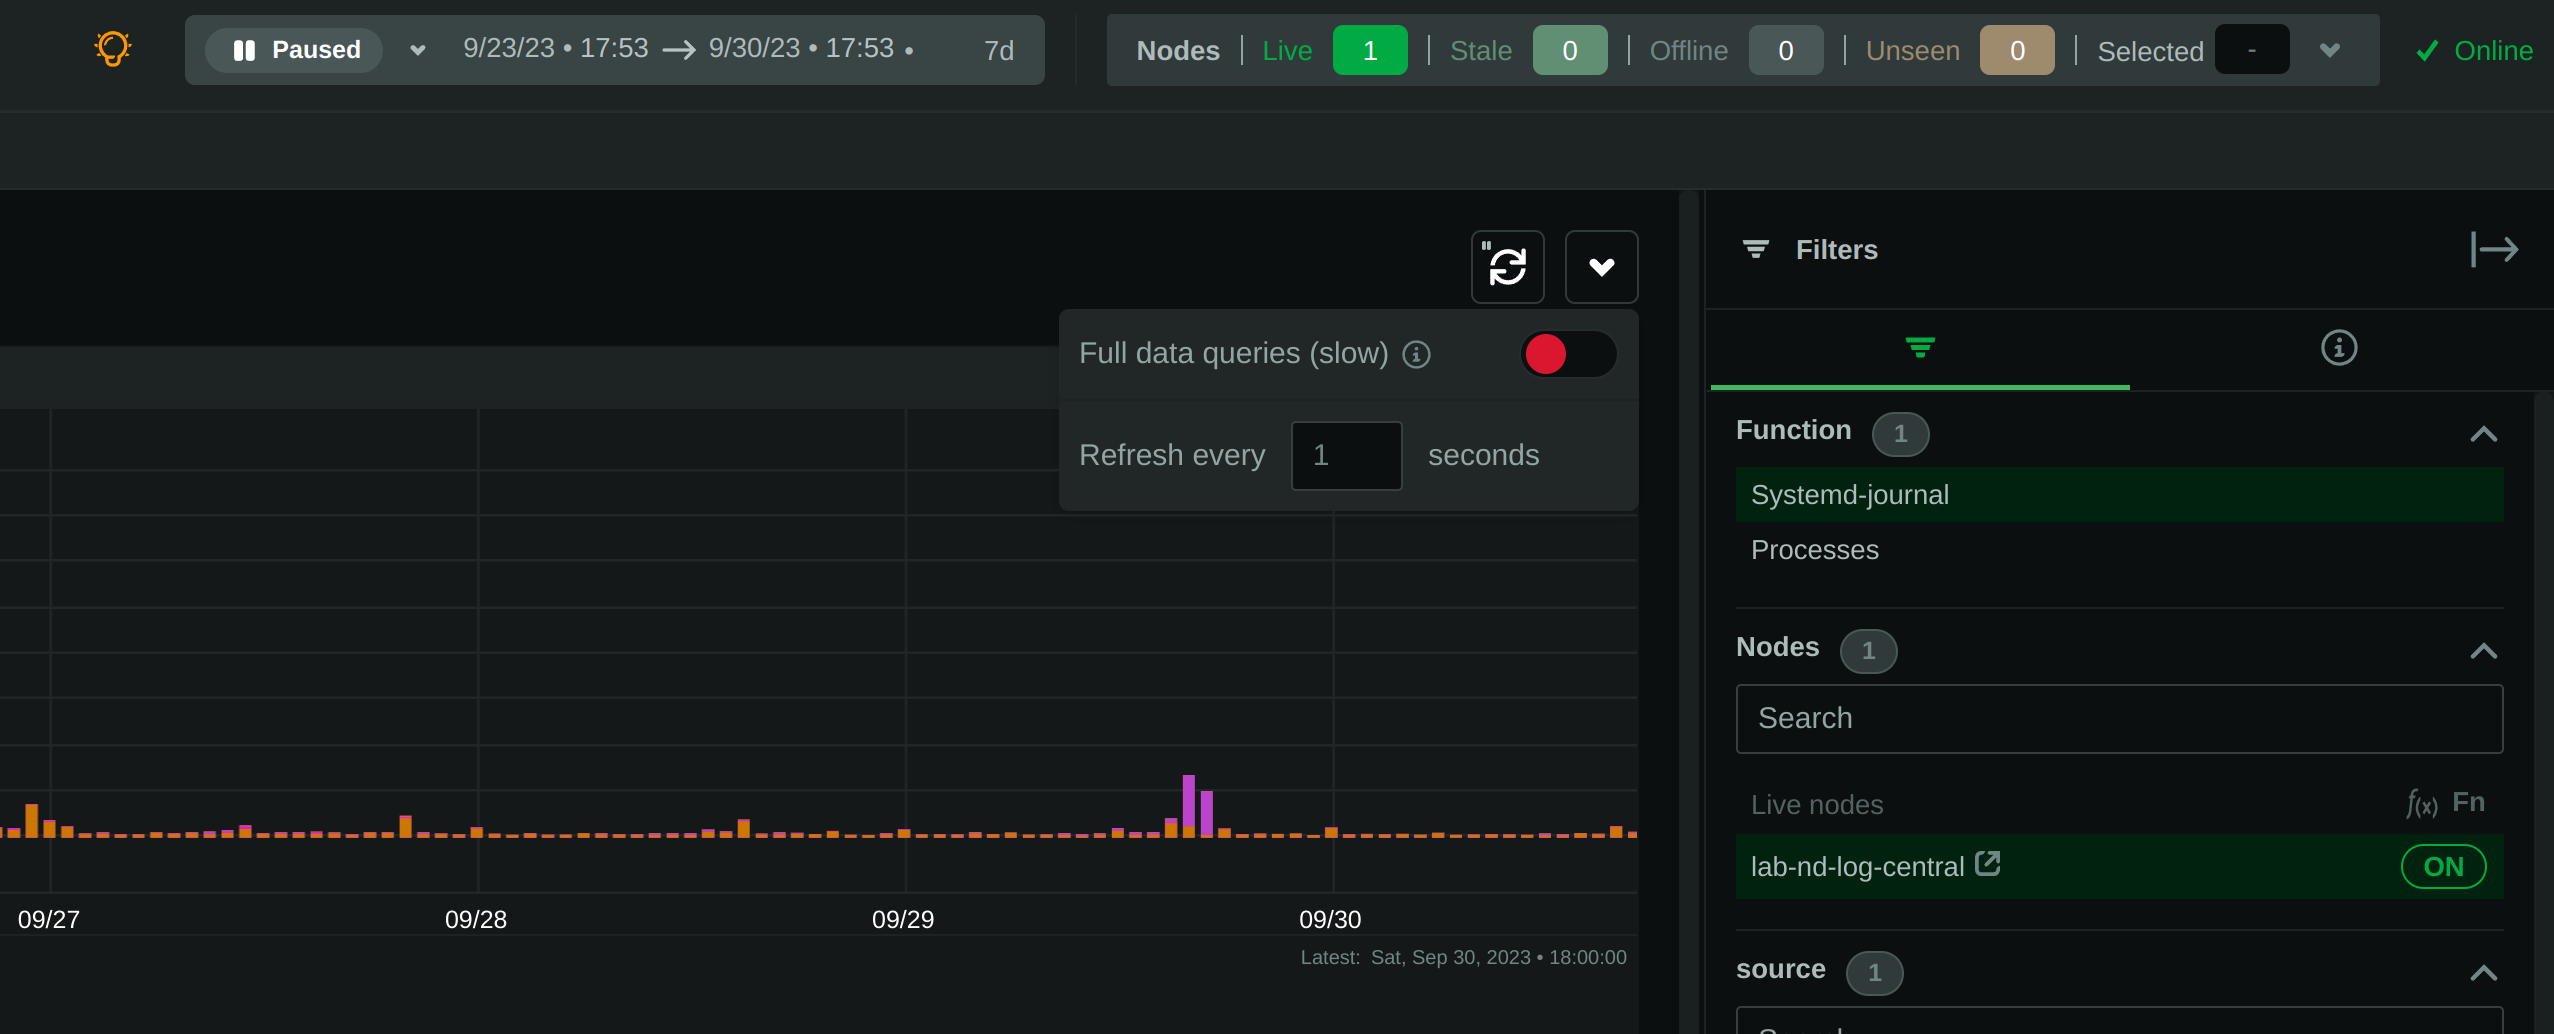
When "full data queries" is off, empty values are hidden and cannot be selected. This is due to a limitation of
`libsystemd` that does not allow negative or empty matches. Also, values with zero counters may appear in the list.
When "full data queries" is on, Netdata is applying all filtering to the data (not `libsystemd`), but this means
that all the data of the entire time-frame, without any filtering applied, have to be read by the plugin to prepare
the response required. So, "full data queries" can be significantly slower over long time-frames.
### Journal fields as histogram sources
The plugin presents a histogram of the number of log entries across time.
The data source of this histogram can be any of the fields that are available as filters.
For each of the values this field has, across the entire time-frame of the query, the histogram will get corresponding
dimensions, showing the number of log entries, per value, over time.
The granularity of the histogram is adjusted automatically to have about 150 columns visible on screen.
The histogram presented by the plugin is interactive:
- **Zoom**, either with the global date-time picker, or the zoom tool in the histogram's toolbox.
- **Pan**, either with global date-time picker, or by dragging with the mouse the chart to the left or the right.
- **Click**, to quickly jump to the highlighted point in time in the log entries.
## PLAY mode
The plugin supports PLAY mode, to continuously update the screen with new log entries found in the journal files.
Just hit the "play" button at the top of the Netdata dashboard screen.
On centralized log servers, PLAY mode provides a unified view of all the new logs encountered across the entire
infrastructure,
from all hosts sending logs to the central logs server via `systemd-remote`.
## Full-text search
The plugin supports searching for any text on all fields of the log entries.
Full text search is combined with the selected filters.
The text box accepts asterisks `*` as wildcards. So, `a*b*c` means match anything that contains `a`, then `b` and
then `c` with anything between them.
## Query performance
Journal files are designed to be accessed by multiple readers and one writer, concurrently.
Readers (like this Netdata plugin), open the journal files and `libsystemd`, behind the scenes, maps regions
of the files into memory, to satisfy each query.
On logs aggregation servers, the performance of the queries depend on the following factors:
1. The **number of files** involved in each query.
This is why we suggest to select a source when possible.
2. The **speed of the disks** hosting the journal files.
Journal files perform a lot of reading while querying, so the fastest the disks, the faster the query will finish.
3. The **memory available** for caching parts of the files.
Increased memory will help the kernel cache the most frequently used parts of the journal files, avoiding disk I/O
and speeding up queries.
4. The **number of filters** applied.
Queries are significantly faster when just a few filters are selected.
In general, for a faster experience, **keep a low number of rows within the visible timeframe**.
Even on long timeframes, selecting a couple of filters that will result in a **few dozen thousand** log entries
will provide fast / rapid responses, usually less than a second. To the contrary, viewing timeframes with **millions
of entries** may result in longer delays.
The plugin aborts journal queries when your browser cancels inflight requests. This allows you to work on the UI
while there are background queries running.
At the time of this writing, this Netdata plugin is about 25-30 times faster than `journalctl` on queries that access
multiple journal files, over long time-frames.
During the development of this plugin, we submitted, to `systemd`, a number of patches to improve `journalctl`
performance by a factor of 14:
- <https://github.com/systemd/systemd/pull/29365>
- <https://github.com/systemd/systemd/pull/29366>
- <https://github.com/systemd/systemd/pull/29261>
However, even after these patches are merged, `journalctl` will still be 2x slower than this Netdata plugin,
on multi-journal queries.
The problem lies in the way `libsystemd` handles multi-journal file queries. To overcome this problem,
the Netdata plugin queries each file individually and it then it merges the results to be returned.
This is transparent, thanks to the `facets` library in `libnetdata` that handles on-the-fly indexing, filtering,
and searching of any dataset, independently of its source.
## Configuration and maintenance
This Netdata plugin does not require any configuration or maintenance.
## FAQ
### Can I use this plugin on journal centralization servers?
Yes. You can centralize your logs using `systemd-journal-remote`, and then install Netdata
on this logs centralization server to explore the logs of all your infrastructure.
This plugin will automatically provide multi-node views of your logs and also give you the ability to combine the logs
of multiple servers, as you see fit.
Check [configuring a logs centralization server](#how-do-i-configure-a-journal-centralization-server).
### Can I use this plugin from a parent Netdata?
Yes. When your nodes are connected to a Netdata parent, all their functions are available
via the parent's UI. So, from the parent UI, you can access the functions of all your nodes.
Keep in mind that to protect your privacy, in order to access Netdata functions, you need a
free Netdata Cloud account.
### Is any of my data exposed to Netdata Cloud from this plugin?
No. When you access the agent directly, none of your data passes through Netdata Cloud.
You need a free Netdata Cloud account only to verify your identity and enable the use of
Netdata Functions. Once this is done, all the data flow directly from your Netdata agent
to your web browser.
Also check [this discussion](https://github.com/netdata/netdata/discussions/16136).
When you access Netdata via `https://app.netdata.cloud`, your data travel via Netdata Cloud,
but they are not stored in Netdata Cloud. This is to allow you access your Netdata agents from
anywhere. All communication from/to Netdata Cloud is encrypted.
### What are `volatile` and `persistent` journals?
`systemd` `journald` allows creating both `volatile` journals in a `tmpfs` ram drive,
and `persistent` journals stored on disk.
`volatile` journals are particularly useful when the system monitored is sensitive to
disk I/O, or does not have any writable disks at all.
For more information check `man systemd-journald`.
### I centralize my logs with Loki. Why to use Netdata for my journals?
`systemd` journals have almost infinite cardinality at their labels and all of them are indexed,
even if every single message has unique fields and values.
When you send `systemd` journal logs to Loki, even if you use the `relabel_rules` argument to
`loki.source.journal` with a JSON format, you need to specify which of the fields from journald
you want inherited by Loki. This means you need to know the most important fields beforehand.
At the same time you loose all the flexibility `systemd` journal provides:
**indexing on all fields and all their values**.
Loki generally assumes that all logs are like a table. All entries in a stream share the same
fields. But journald does exactly the opposite. Each log entry is unique and may have its own unique fields.
So, Loki and `systemd-journal` are good for different use cases.
`systemd-journal` already runs in your systems. You use it today. It is there inside all your systems
collecting the system and applications logs. And for its use case, it has advantages over other
centralization solutions. So, why not use it?
### Is it worth to build a `systemd` logs centralization server?
Yes. It is simple, fast and the software to do it is already in your systems.
For application and system logs, `systemd` journal is ideal and the visibility you can get
by centralizing your system logs and the use of this Netdata plugin, is unparalleled.
### How do I configure a journal centralization server?
A short summary to get journal server running can be found below.
There are two strategies you can apply, when it comes down to a centralized server for `systemd` journal logs.
1. _Active sources_, where the centralized server fetches the logs from each individual server
2. _Passive sources_, where the centralized server accepts a log stream from an individual server.
For more options and reference to documentation, check `man systemd-journal-remote` and `man systemd-journal-upload`.
#### _passive_ journal centralization without encryption
If you want to setup your own passive journal centralization setup without encryption, [check out guide on it](https://github.com/netdata/netdata/blob/master/collectors/systemd-journal.plugin/passive_journal_centralization_guide_no_encryption.md).
#### _passive_ journal centralization with encryption using self-signed certificates
If you want to setup your own passive journal centralization setup using self-signed certificates for encryption, [check out guide on it](https://github.com/netdata/netdata/blob/master/collectors/systemd-journal.plugin/passive_journal_centralization_guide_self_signed_certs.md).
#### Limitations when using a logs centralization server
As of this writing `namespaces` support by `systemd` is limited:
- Docker containers cannot log to namespaces. Check [this issue](https://github.com/moby/moby/issues/41879).
- `systemd-journal-upload` automatically uploads `system` and `user` journals, but not `namespaces` journals. For this
you need to spawn a `systemd-journal-upload` per namespace.
|
