1
2
3
4
5
6
7
8
9
10
11
12
13
14
15
16
17
18
19
20
21
22
23
24
25
26
27
28
29
30
31
32
33
34
35
36
37
38
39
40
41
42
43
44
45
46
47
48
49
50
51
52
53
54
55
56
57
58
59
60
61
62
63
64
65
66
67
68
69
70
71
72
73
74
75
76
77
78
79
80
81
82
83
84
85
86
87
88
89
90
91
92
93
94
95
96
97
98
99
100
101
102
103
104
105
106
107
108
109
110
111
112
113
114
115
116
117
118
119
120
121
122
123
124
125
126
127
128
129
130
131
132
133
134
135
136
137
138
139
140
141
142
143
144
145
146
147
148
149
150
151
152
153
154
155
156
157
158
159
160
161
162
163
164
165
166
167
168
169
170
171
172
173
174
175
176
177
178
179
180
181
182
183
184
185
186
187
188
189
190
191
192
193
194
195
196
197
198
199
200
201
202
203
204
205
206
207
208
209
210
211
212
213
214
215
216
217
218
219
220
221
222
223
224
225
226
227
228
229
230
231
232
233
234
235
236
237
238
239
240
241
242
243
244
245
246
247
248
249
250
251
252
253
254
255
256
257
258
259
260
261
262
263
264
265
266
267
268
269
270
271
272
273
274
275
276
277
278
279
280
281
282
283
284
285
286
287
288
289
290
291
292
293
294
295
296
297
298
299
300
301
302
303
304
305
306
307
308
309
310
311
312
313
314
315
316
317
318
319
320
321
322
323
324
325
326
327
328
329
330
331
332
333
334
335
336
337
338
339
340
341
342
343
344
345
346
347
348
349
350
351
352
353
354
355
356
357
358
359
360
361
362
363
364
365
366
367
368
369
370
371
372
373
374
375
376
377
378
379
380
381
382
383
384
385
386
387
388
389
390
391
392
393
394
395
396
397
398
399
400
401
402
403
404
405
406
407
408
409
410
411
412
413
414
415
416
417
418
419
420
421
422
423
424
425
426
427
428
429
430
431
432
433
434
435
436
437
438
439
440
441
442
443
444
445
446
447
448
449
450
451
452
453
454
455
456
457
458
459
460
461
462
463
464
465
466
467
468
469
470
471
472
473
474
475
476
477
478
479
480
481
482
483
484
485
486
487
488
489
490
491
492
493
494
495
496
497
498
499
500
501
502
503
504
505
506
507
508
509
510
511
512
513
514
515
516
517
518
519
520
521
522
523
524
525
526
527
528
529
530
531
532
533
534
535
536
537
538
539
540
541
542
543
544
545
546
547
548
549
550
551
552
553
554
555
556
557
558
559
560
561
562
563
564
565
566
567
568
569
570
571
572
573
574
575
576
577
578
579
580
581
582
583
584
585
586
587
588
589
590
591
592
593
594
595
596
597
598
599
600
601
602
603
604
605
606
607
608
609
610
611
612
613
614
615
616
617
618
619
620
621
622
623
624
625
626
627
628
629
630
631
632
633
634
635
636
637
638
639
640
641
642
643
644
645
646
647
648
649
650
651
652
653
654
655
656
657
658
659
660
661
662
663
664
665
666
667
668
669
670
671
672
673
674
675
676
677
678
679
680
681
682
683
684
685
686
687
688
689
690
691
692
693
694
695
696
697
698
699
700
701
702
703
704
705
|
# Netdata [](https://travis-ci.com/netdata/netdata) [](https://bestpractices.coreinfrastructure.org/projects/2231) [](https://www.gnu.org/licenses/gpl-3.0) [](<>)
[](https://codeclimate.com/github/netdata/netdata)
[](https://www.codacy.com/app/netdata/netdata?utm_source=github.com&utm_medium=referral&utm_content=netdata/netdata&utm_campaign=Badge_Grade)
[](https://lgtm.com/projects/g/netdata/netdata/context:cpp)
[](https://lgtm.com/projects/g/netdata/netdata/context:javascript)
[](https://lgtm.com/projects/g/netdata/netdata/context:python)
---
Netdata is **distributed, real-time performance and health monitoring** for systems and applications. It is a
highly-optimized monitoring agent you install on all your systems and containers.
Netdata provides **unparalleled insights**, in **real-time**, of everything happening on the systems it's running on
(including web servers, databases, applications), using **highly interactive web dashboards**.
A highly-efficient database **stores long-term historical metrics for days, weeks, or months**, all at 1-second
granularity. Run this long-term storage autonomously, or integrate Netdata with your existing monitoring toolchains
(Prometheus, Graphite, OpenTSDB, Kafka, Grafana, and more).
Netdata is **fast** and **efficient**, designed to permanently run on all systems (**physical** and **virtual** servers,
**containers**, **IoT** devices), without disrupting their core function.
Netdata is **free, open-source software** and it currently runs on **Linux**, **FreeBSD**, and **MacOS**, along with
other systems derived from them, such as **Kubernetes** and **Docker**.
Netdata is not hosted by the CNCF but is the 3rd most starred open-source project in the [Cloud Native Computing
Foundation (CNCF) landscape](https://landscape.cncf.io/format=card-mode&grouping=no&sort=stars).
---
People get **addicted to Netdata**. Once you use it on your systems, **there is no going back**! _You've been warned..._

[](https://twitter.com/intent/tweet?text=Netdata,%20real-time%20performance%20and%20health%20monitoring,%20done%20right!&url=https://my-netdata.io/&via=linuxnetdata&hashtags=netdata,monitoring)
## Contents
1. [What does it look like?](#what-does-it-look-like) - Take a quick tour through the dashboard
2. [Our userbase](#user-base) - Enterprises we help monitor and our userbase
3. [Quickstart](#quickstart) - How to try it now on your systems
4. [Why Netdata](#why-netdata) - Why people love Netdata and how it compares with other solutions
5. [News](#news) - The latest news about Netdata
6. [How Netdata works](#how-it-works) - A high-level diagram of how Netdata works
7. [Infographic](#infographic) - Everything about Netdata in a single graphic
8. [Features](#features) - How you'll use Netdata on your systems
9. [Visualization](#visualization) - Learn about visual anomaly detection
10. [What does it monitor?](#what-does-it-monitor) - See which apps/services Netdata auto-detects
11. [Documentation](#documentation) - Read the documentation
12. [Community](#community) - Discuss Netdata with others and get support
13. [License](#license) - Check Netdata's licencing
14. [Is it any good?](#is-it-any-good) - Yes.
15. [Is it awesome?](#is-it-awesome) - Yes.
## What does it look like?
The following animated GIF shows the top part of a typical Netdata dashboard.
> A typical Netdata dashboard, in 1:1 timing. Charts can be panned by dragging them, zoomed in/out with `SHIFT` + `mouse
> wheel`, an area can be selected for zoom-in with `SHIFT` + `mouse selection`. Netdata is highly interactive,
> **real-time**, and optimized to get the work done!
Want to see Netdata live? Check out any of our [live demos](https://www.netdata.cloud/#live-demo).
## User base
Netdata is used by hundreds of thousands of users all over the world. Check our [GitHub watchers
list](https://github.com/netdata/netdata/watchers). You will find people working for **Amazon**, **Atos**, **Baidu**,
**Cisco Systems**, **Citrix**, **Deutsche Telekom**, **DigitalOcean**, **Elastic**, **EPAM Systems**, **Ericsson**,
**Google**, **Groupon**, **Hortonworks**, **HP**, **Huawei**, **IBM**, **Microsoft**, **NewRelic**, **Nvidia**, **Red
Hat**, **SAP**, **Selectel**, **TicketMaster**, **Vimeo**, and many more!
### Docker pulls
We provide Docker images for the most common architectures. These are statistics reported by Docker Hub:
[](https://hub.docker.com/r/netdata/netdata/)
[](https://hub.docker.com/r/firehol/netdata/)
[](https://hub.docker.com/r/titpetric/netdata/)
### Registry
When you install multiple Netdata, they are integrated into **one distributed application**, via a [Netdata
registry](registry/README.md). This is a web browser feature and it allows us to count the number of unique users and
unique Netdata servers installed. The following information comes from the global public Netdata registry we run:
[](https://registry.my-netdata.io/#menu_netdata_submenu_registry)
[](https://registry.my-netdata.io/#menu_netdata_submenu_registry)
[](https://registry.my-netdata.io/#menu_netdata_submenu_registry)
_In the last 24 hours:_<br/> [](https://registry.my-netdata.io/#menu_netdata_submenu_registry)
[](https://registry.my-netdata.io/#menu_netdata_submenu_registry)
[](https://registry.my-netdata.io/#menu_netdata_submenu_registry)
## Quickstart


To install Netdata from source on any Linux system (physical, virtual, container, IoT, edge) and keep it up to date with
our **nightly releases** automatically, run the following:
```bash
# make sure you run `bash` for your shell
bash
# install Netdata directly from GitHub source
bash <(curl -Ss https://my-netdata.io/kickstart.sh)
```
Starting with v1.12, Netdata collects anonymous usage information by default and sends it to Google Analytics. Read
about the information collected, and learn how to-opt, on our [anonymous statistics](docs/anonymous-statistics.md) page.
The usage statistics are _vital_ for us, as we use them to discover bugs and priortize new features. We thank you for
_actively_ contributing to Netdata's future.
To learn more about the pros and cons of using _nightly_ vs. _stable_ releases, see our [notice about the two options](packaging/installer/README.md#nightly-vs-stable-releases).
The above command will:
- Install any required packages on your system (it will ask you to confirm before doing so)
- Compile it, install it, and start it.
More installation methods and additional options can be found at the [installation page](packaging/installer/).
To try Netdata in a Docker container, run this:
```sh
docker run -d --name=netdata \
-p 19999:19999 \
-v /etc/passwd:/host/etc/passwd:ro \
-v /etc/group:/host/etc/group:ro \
-v /proc:/host/proc:ro \
-v /sys:/host/sys:ro \
-v /var/run/docker.sock:/var/run/docker.sock:ro \
--cap-add SYS_PTRACE \
--security-opt apparmor=unconfined \
netdata/netdata
```
For more information about running Netdata in Docker, check the [docker installation page](packaging/docker/).

From Netdata v1.12 and above, anonymous usage information is collected by default and sent to Google Analytics. To read
more about the information collected and how to opt-out, check the [anonymous statistics
page](docs/anonymous-statistics.md).
## Why Netdata
Netdata has a quite different approach to monitoring.
Netdata is a monitoring agent you install on all your systems. It is:
- A **metrics collector** for system and application metrics (including web servers, databases, containers, and much
more),
- A **long-term metrics database** that stores recent metrics in memory and "spills" historical metrics to disk for
efficient long-term storage,
- A super fast, interactive, and modern **metrics visualizer** optimized for anomaly detection,
- And an **alarms notification engine** for detecting performance and availability issues.
All the above, are packaged together in a very flexible, extremely modular, distributed application.
This is how Netdata compares to other monitoring solutions:
| Netdata | others (open-source and commercial) |
| :-------------------------------------------------------------- | :--------------------------------------------------------------- |
| **High resolution metrics** (1s granularity) | Low resolution metrics (10s granularity at best) |
| Monitors everything, **thousands of metrics per node** | Monitor just a few metrics |
| UI is super fast, optimized for **anomaly detection** | UI is good for just an abstract view |
| **Long-term, autonomous storage** at one-second granularity | Centralized metrics in an expensive data lake at 10s granularity |
| **Meaningful presentation**, to help you understand the metrics | You have to know the metrics before you start |
| Install and get results **immediately** | Long preparation is required to get any useful results |
| Use it for **troubleshooting** performance problems | Use them to get _statistics of past performance_ |
| **Kills the console** for tracing performance issues | The console is always required for troubleshooting |
| Requires **zero dedicated resources** | Require large dedicated resources |
Netdata is **open-source**, **free**, super **fast**, very **easy**, completely **open**, extremely **efficient**,
**flexible** and integrate-able.
It has been designed by **system administrators**, **DevOps engineers**, and **developers** for to not just visualize
metrics, but also troubleshoot complex performance problems.
## News
`Nov 27th, 2019` - **[Netdata v1.19.0 released!](https://github.com/netdata/netdata/releases)**
Release v1.19.0 contains 2 new collectors, 19 bug fixes, 17 improvements, and 19 documentation updates.
We completed a major rewrite of our **web log collector** to dramatically improve its flexibility and performance. The
[new collector](https://github.com/netdata/go.d.plugin/pull/141), written entirely in Go, can parse and chart logs from
Nginx and Apache servers, and combines numerous improvements. Netdata now supports the LTSV log format, creates charts
for TLS and cipher usage, and is amazingly fast. In a test using SSD storage, the collector parsed the logs for 200,000
requests in about 200ms, using 30% of a single core.
This Go-based collector also has powerful custom log parsing capabilities, which means we're one step closer to a
generic application log parser for Netdata. We're continuing to work on this parser to support more application log
formatting in the future.
We have a new tutorial on [enabling the Go web log
collector](https://docs.netdata.cloud/docs/tutorials/collect-apache-nginx-web-logs/) and using it with Nginx and/or
Apache access logs with minimal configuration. Thanks to [Wing924](https://github.com/Wing924) for starting the Go
rewrite!
We introduced more **cmocka unit testing** to Netdata. In this release, we're testing how Netdata's internal web server
processes HTTP requests—the first step to improve the quality of code throughout, reduce bugs, and make refactoring
easier. We wanted to validate the web server's behavior but needed to build a layer of parametric testing on top of the
CMocka test runner. Read all about our process of testing and selecting cmocka on our blog post: [Building an agile
team's 'safety harness' with cmocka and FOSS](https://blog.netdata.cloud/posts/agile-team-cmocka-foss/).
Netdata's **Unbound collector** was also [completely rewritten in Go](https://github.com/netdata/go.d.plugin/pull/287)
to improve how it collects and displays metrics. This new version can get dozens of metrics, including details on
queries, cache, uptime, and even show per-thread metrics. See our
[tutorial](https://docs.netdata.cloud/docs/tutorials/collect-unbound-metrics/) on enabling the new collector via
Netdata's amazing auto-detection feature.
We [fixed an error](https://github.com/netdata/netdata/pull/7220) where **invalid spikes** appeared on certain charts by
improving the incremental counter reset/wraparound detection algorithm.
Netdata can now send [**health alarm notifications to IRC
channels**](https://docs.netdata.cloud/health/notifications/irc/) thanks to [Strykar](https://github.com/Strykar)!
And, Netdata can now monitor [**AM2320 sensors**](https://docs.netdata.cloud/collectors/python.d.plugin/am2320/), thanks
to hard work from [Tom Buck](https://github.com/tommybuck).
---
See more news and previous releases at our [blog](https://blog.netdata.cloud) or our [releases
page](https://github.com/netdata/netdata/releases).
## How it works
Netdata is a highly efficient, highly modular, metrics management engine. Its lockless design makes it ideal for
concurrent operations on the metrics.
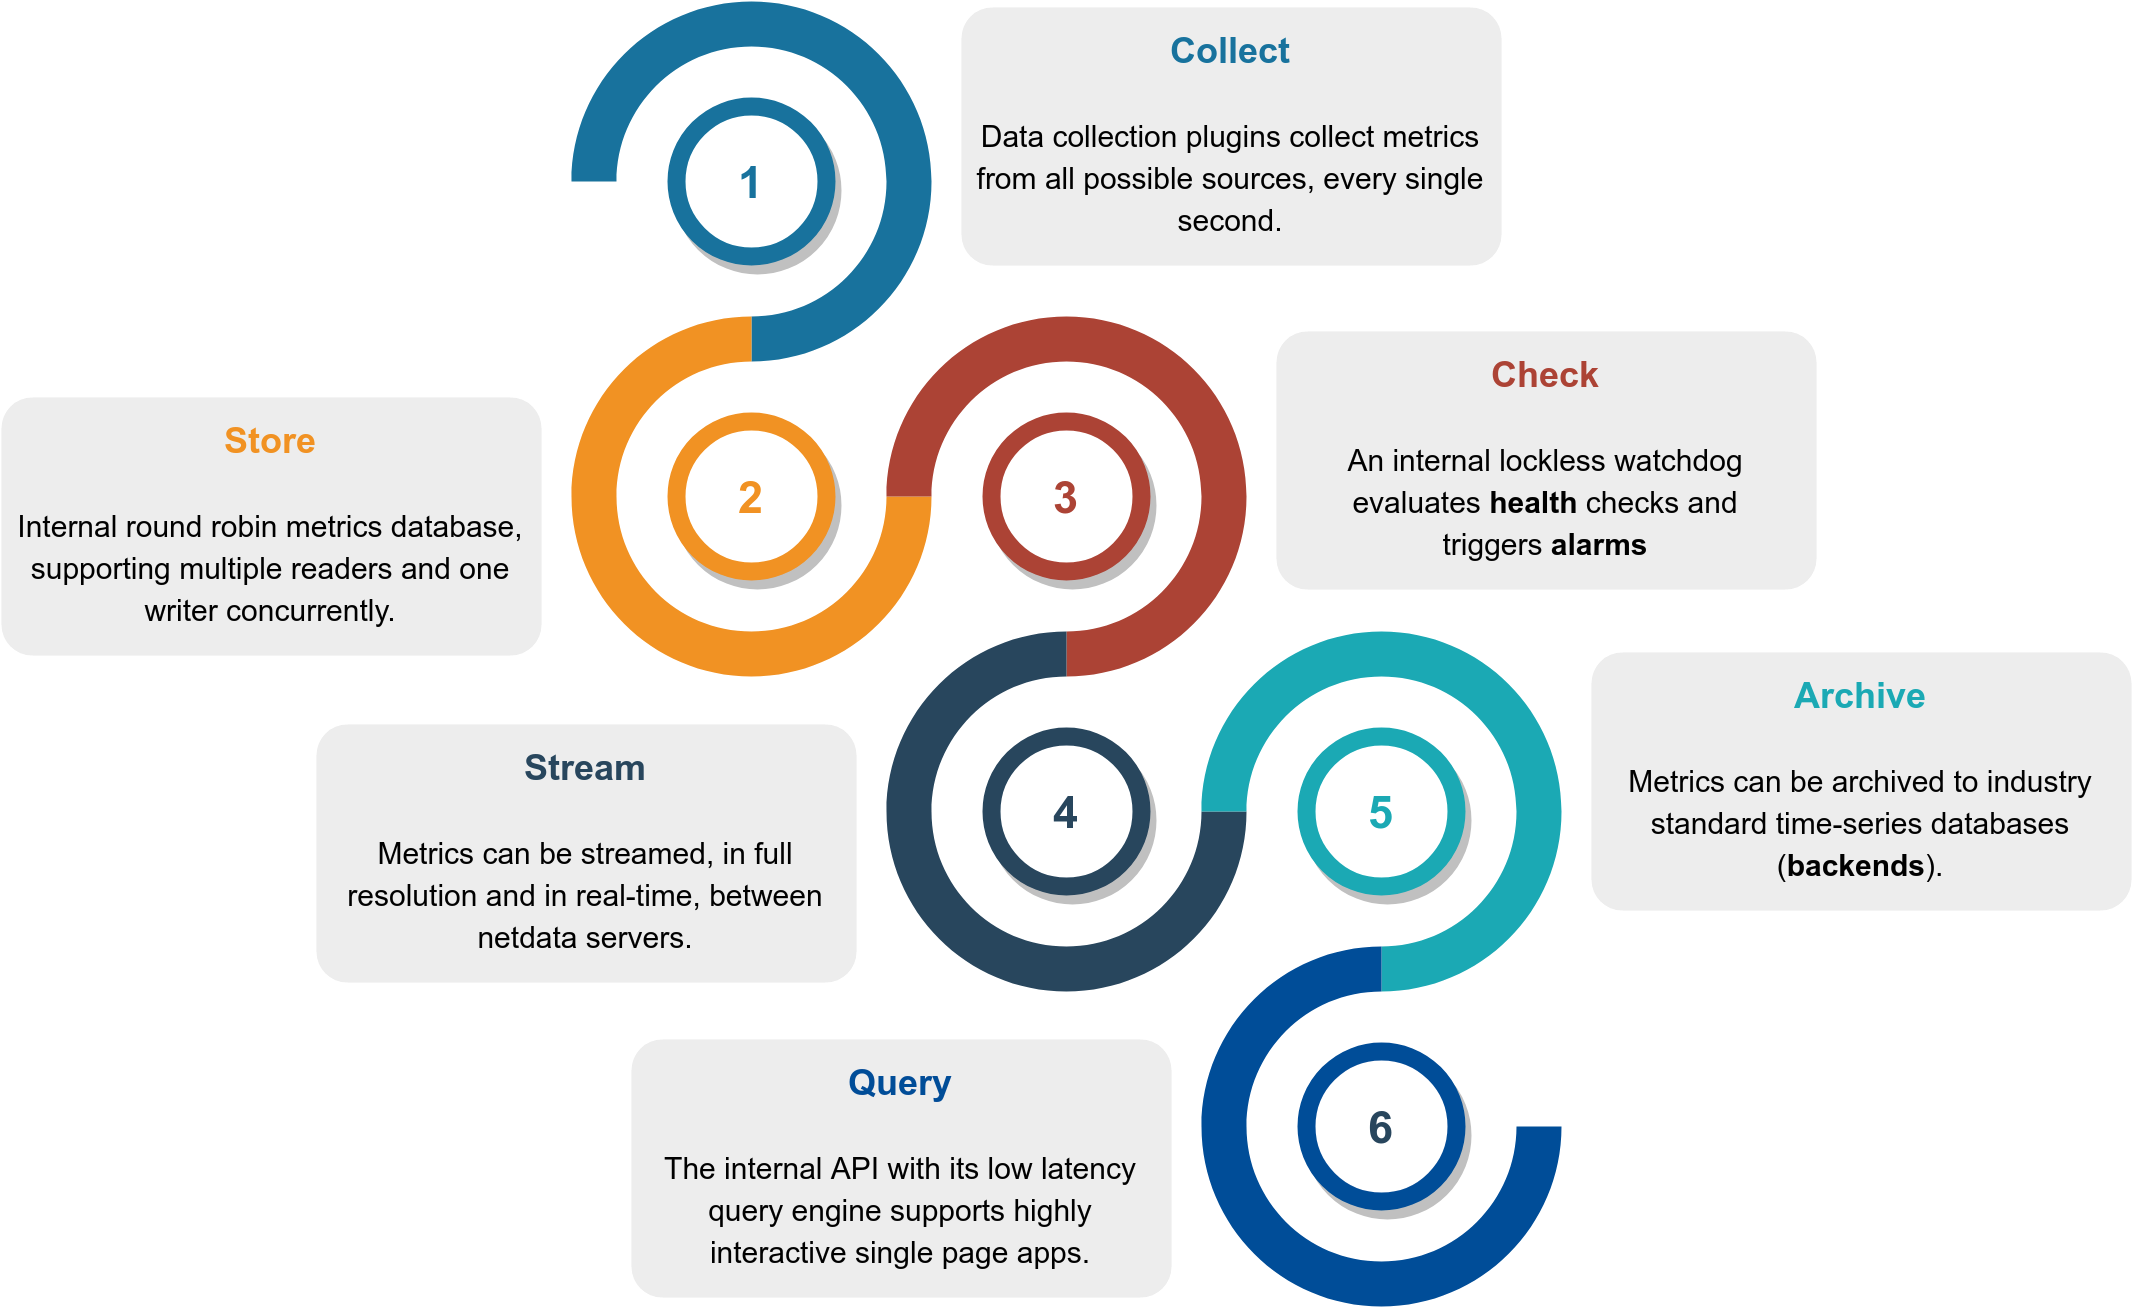
This is how it works:
| Function | Description | Documentation |
| :---------- | :------------------------------------------------------------------------------------------------------------------------------------------------------------------------------------------------------------------------------------------------------------- | :-------------------------------------------------- |
| **Collect** | Multiple independent data collection workers are collecting metrics from their sources using the optimal protocol for each application and push the metrics to the database. Each data collection worker has lockless write access to the metrics it collects. | [`collectors`](collectors/README.md) |
| **Store** | Metrics are first stored in RAM in a custom database engine that then "spills" historical metrics to disk for efficient long-term metrics storage. | [`database`](database/README.md) |
| **Check** | A lockless independent watchdog is evaluating **health checks** on the collected metrics, triggers alarms, maintains a health transaction log and dispatches alarm notifications. | [`health`](health/README.md) |
| **Stream** | A lockless independent worker is streaming metrics, in full detail and in real-time, to remote Netdata servers, as soon as they are collected. | [`streaming`](streaming/README.md) |
| **Archive** | A lockless independent worker is down-sampling the metrics and pushes them to **backend** time-series databases. | [`backends`](backends/README.md) |
| **Query** | Multiple independent workers are attached to the [internal web server](web/server/README.md), servicing API requests, including [data queries](web/api/queries/README.md). | [`web/api`](web/api/README.md) |
The result is a highly efficient, low-latency system, supporting multiple readers and one writer on each metric.
## Infographic
This is a high level overview of Netdata feature set and architecture. Click it to to interact with it (it has direct
links to our documentation).
[](https://my-netdata.io/infographic.html)
## Features
This is what you should expect from Netdata:
### General
- **1s granularity** - The highest possible resolution for all metrics.
- **Unlimited metrics** - Netdata collects all the available metrics—the more, the better.
- **1% CPU utilization of a single core** - It's unbelievably optimized.
- **A few MB of RAM** - The highly-efficient database engine stores per-second metrics in RAM and then "spills"
historical metrics to disk long-term storage.
- **Minimal disk I/O** - While running, Netdata only writes historical metrics and reads `error` and `access` logs.
- **Zero configuration** - Netdata auto-detects everything, and can collect up to 10,000 metrics per server out of the
box.
- **Zero maintenance** - You just run it. Netdata does the rest.
- **Zero dependencies** - Netdata runs a custom web server for its static web files and its web API (though its
plugins may require additional libraries, depending on the applications monitored).
- **Scales to infinity** - You can install it on all your servers, containers, VMs, and IoT devices. Metrics are not
centralized by default, so there is no limit.
- **Several operating modes** - Autonomous host monitoring (the default), headless data collector, forwarding proxy,
store and forward proxy, central multi-host monitoring, in all possible configurations. Each node may have different
metrics retention policies and run with or without health monitoring.
### Health Monitoring & Alarms
|
