
diff options
Diffstat (limited to 'health/REFERENCE.md')
| -rw-r--r-- | health/REFERENCE.md | 317 |
1 files changed, 302 insertions, 15 deletions
diff --git a/health/REFERENCE.md b/health/REFERENCE.md index ce568db516..ead035b0d9 100644 --- a/health/REFERENCE.md +++ b/health/REFERENCE.md @@ -1,33 +1,160 @@ <!-- -title: "Health configuration reference" +title: "Configure agent alerts" sidebar_label: "Health" custom_edit_url: "https://github.com/netdata/netdata/edit/master/health/REFERENCE.md" learn_status: "Published" -learn_topic_type: "Tasks" -learn_rel_path: "Operations/Alerts" +learn_rel_path: "Configuration" --> -# Health configuration reference +# Configure agent alerts -Welcome to the health configuration reference. +Netdata's health watchdog is highly configurable, with support for dynamic thresholds, hysteresis, alarm templates, and +more. You can tweak any of the existing alarms based on your infrastructure's topology or specific monitoring needs, or +create new entities. -This guide contains information about editing health configuration files to tweak existing alarms or create new health -entities that are customized to the needs of your infrastructure. +You can use health alarms in conjunction with any of Netdata's [collectors](https://github.com/netdata/netdata/blob/master/collectors/README.md) (see +the [supported collector list](https://github.com/netdata/netdata/blob/master/collectors/COLLECTORS.md)) to monitor the health of your systems, containers, and +applications in real time. -To learn the basics of locating and editing health configuration files, see the [Configure health alarms](https://github.com/netdata/netdata/blob/master/docs/monitor/configure-alarms.md) documentation. +While you can see active alarms both on the local dashboard and Netdata Cloud, all health alarms are configured _per +node_ via individual Netdata Agents. If you want to deploy a new alarm across your +[infrastructure](https://github.com/netdata/netdata/blob/master/docs/quickstart/infrastructure.md), you must configure each node with the same health configuration +files. -## Health configuration files +## Edit health configuration files You can configure the Agent's health watchdog service by editing files in two locations: - The `[health]` section in `netdata.conf`. By editing the daemon's behavior, you can disable health monitoring - altogether, run health checks more or less often, and more. See [daemon - configuration](https://github.com/netdata/netdata/blob/master/daemon/config/README.md#health-section-options) for a table of all the available settings, their - default values, and what they control. + altogether, run health checks more or less often, and more. See + [daemon configuration](https://github.com/netdata/netdata/blob/master/daemon/config/README.md#health-section-options) for a table of + all the available settings, their default values, and what they control. + - The individual `.conf` files in `health.d/`. These health entity files are organized by the type of metric they are performing calculations on or their associated collector. You should edit these files using the `edit-config` script. For example: `sudo ./edit-config health.d/cpu.conf`. +Navigate to your [Netdata config directory](https://github.com/netdata/netdata/blob/master/docs/configure/nodes.md) and +use `edit-config` to make changes to any of these files. + +For example, to edit the `cpu.conf` health configuration file, run: + +```bash +sudo ./edit-config health.d/cpu.conf +``` + +Each health configuration file contains one or more health _entities_, which always begin with `alarm:` or `template:`. +For example, here is the first health entity in `health.d/cpu.conf`: + +```yaml +template: 10min_cpu_usage + on: system.cpu + os: linux + hosts: * + lookup: average -10m unaligned of user,system,softirq,irq,guest + units: % + every: 1m + warn: $this > (($status >= $WARNING) ? (75) : (85)) + crit: $this > (($status == $CRITICAL) ? (85) : (95)) + delay: down 15m multiplier 1.5 max 1h + info: average cpu utilization for the last 10 minutes (excluding iowait, nice and steal) + to: sysadmin +``` + +To tune this alarm to trigger warning and critical alarms at a lower CPU utilization, change the `warn` and `crit` lines +to the values of your choosing. For example: + +```yaml + warn: $this > (($status >= $WARNING) ? (60) : (75)) + crit: $this > (($status == $CRITICAL) ? (75) : (85)) +``` + +Save the file and [reload Netdata's health configuration](#reload-health-configuration) to make your changes live. + +### Silence an individual alarm + +Instead of disabling an alarm altogether, or even disabling _all_ alarms, you can silence individual alarms by changing +one line in a given health entity. To silence any single alarm, change the `to:` line in its entity to `silent`. + +```yaml + to: silent +``` + +## Write a new health entity + +While tuning existing alarms may work in some cases, you may need to write entirely new health entities based on how +your systems, containers, and applications work. + +Read the [health entity reference](#health-entity-reference) for a full listing of the format, +syntax, and functionality of health entities. + +To write a new health entity into a new file, navigate to your [Netdata config directory](https://github.com/netdata/netdata/blob/master/docs/configure/nodes.md), +then use `touch` to create a new file in the `health.d/` directory. Use `edit-config` to start editing the file. + +As an example, let's create a `ram-usage.conf` file. + +```bash +sudo touch health.d/ram-usage.conf +sudo ./edit-config health.d/ram-usage.conf +``` + +For example, here is a health entity that triggers a warning alarm when a node's RAM usage rises above 80%, and a +critical alarm above 90%: + +```yaml + alarm: ram_usage + on: system.ram +lookup: average -1m percentage of used + units: % + every: 1m + warn: $this > 80 + crit: $this > 90 + info: The percentage of RAM being used by the system. +``` + +Let's look into each of the lines to see how they create a working health entity. + +- `alarm`: The name for your new entity. The name needs to follow these requirements: + - Any alphabet letter or number. + - The symbols `.` and `_`. + - Cannot be `chart name`, `dimension name`, `family name`, or `chart variable names`. + +- `on`: Which chart the entity listens to. + +- `lookup`: Which metrics the alarm monitors, the duration of time to monitor, and how to process the metrics into a + usable format. + - `average`: Calculate the average of all the metrics collected. + - `-1m`: Use metrics from 1 minute ago until now to calculate that average. + - `percentage`: Clarify that we're calculating a percentage of RAM usage. + - `of used`: Specify which dimension (`used`) on the `system.ram` chart you want to monitor with this entity. + +- `units`: Use percentages rather than absolute units. + +- `every`: How often to perform the `lookup` calculation to decide whether or not to trigger this alarm. + +- `warn`/`crit`: The value at which Netdata should trigger a warning or critical alarm. This example uses simple + syntax, but most pre-configured health entities use + [hysteresis](#special-use-of-the-conditional-operator) to avoid superfluous notifications. + +- `info`: A description of the alarm, which will appear in the dashboard and notifications. + +In human-readable format: + +> This health entity, named **ram_usage**, watches the **system.ram** chart. It looks up the last **1 minute** of +> metrics from the **used** dimension and calculates the **average** of all those metrics in a **percentage** format, +> using a **% unit**. The entity performs this lookup **every minute**. +> +> If the average RAM usage percentage over the last 1 minute is **more than 80%**, the entity triggers a warning alarm. +> If the usage is **more than 90%**, the entity triggers a critical alarm. + +When you finish writing this new health entity, [reload Netdata's health configuration](#reload-health-configuration) to +see it live on the local dashboard or Netdata Cloud. + +## Reload health configuration + +To make any changes to your health configuration live, you must reload Netdata's health monitoring system. To do that +without restarting all of Netdata, run `netdatacli reload-health` or `killall -USR2 netdata`. + ## Health entity reference The following reference contains information about the syntax and options of _health entities_, which Netdata attaches @@ -326,7 +453,8 @@ Everything is the same with [badges](https://github.com/netdata/netdata/blob/mas - `foreach DIMENSIONS` is optional, will always be the last parameter, and uses the same `,`/`|` rules as the `of` parameter. Each dimension you specify in `foreach` will use the same rule to trigger an alarm. If you set both `of` and `foreach`, Netdata will ignore the `of` parameter - and replace it with one of the dimensions you gave to `foreach`. + and replace it with one of the dimensions you gave to `foreach`. This option allows you to + [use dimension templates to create dynamic alarms](#use-dimension-templates-to-create-dynamic-alarms). The result of the lookup will be available as `$this` and `$NAME` in expressions. The timestamps of the timeframe evaluated by the database lookup is available as variables @@ -1020,7 +1148,166 @@ expression. It's currently not possible to schedule notifications from within the alarm template. For those scenarios where you need to temporary disable notifications (for instance when running backups triggers a disk alert) you can disable or silence -notifications are runtime. The health checks can be controlled at runtime via the [health management -api](https://github.com/netdata/netdata/blob/master/web/api/health/README.md). +notifications are runtime. The health checks can be controlled at runtime via the +[health management API](https://github.com/netdata/netdata/blob/master/web/api/health/README.md). + +## Use dimension templates to create dynamic alarms + +In v1.18 of Netdata, we introduced **dimension templates** for alarms, which simplifies the process of +writing [alarm entities](#health-entity-reference) for +charts with many dimensions. + +Dimension templates can condense many individual entities into one—no more copy-pasting one entity and changing the +`alarm`/`template` and `lookup` lines for each dimension you'd like to monitor. + +### The fundamentals of `foreach` + +Our dimension templates update creates a new `foreach` parameter to the +existing [`lookup` line](#alarm-line-lookup). This +is where the magic happens. + +You use the `foreach` parameter to specify which dimensions you want to monitor with this single alarm. You can separate +them with a comma (`,`) or a pipe (`|`). You can also use +a [Netdata simple pattern](https://github.com/netdata/netdata/blob/master/libnetdata/simple_pattern/README.md) to create +many alarms with a regex-like syntax. + +The `foreach` parameter _has_ to be the last parameter in your `lookup` line, and if you have both `of` and `foreach` in +the same `lookup` line, Netdata will ignore the `of` parameter and use `foreach` instead. + +Let's get into some examples so you can see how the new parameter works. + +> ⚠️ The following entities are examples to showcase the functionality and syntax of dimension templates. They are not +> meant to be run as-is on production systems. + +### Condensing entities with `foreach` + +Let's say you want to monitor the `system`, `user`, and `nice` dimensions in your system's overall CPU utilization. +Before dimension templates, you would need the following three entities: + +```yaml + alarm: cpu_system + on: system.cpu +lookup: average -10m percentage of system + every: 1m + warn: $this > 50 + crit: $this > 80 + + alarm: cpu_user + on: system.cpu +lookup: average -10m percentage of user + every: 1m + warn: $this > 50 + crit: $this > 80 + + alarm: cpu_nice + on: system.cpu +lookup: average -10m percentage of nice + every: 1m + warn: $this > 50 + crit: $this > 80 +``` + +With dimension templates, you can condense these into a single alarm. Take note of the `alarm` and `lookup` lines. + +```yaml + alarm: cpu_template + on: system.cpu +lookup: average -10m percentage foreach system,user,nice + every: 1m + warn: $this > 50 + crit: $this > 80 +``` + +The `alarm` line specifies the naming scheme Netdata will use. You can use whatever naming scheme you'd like, with `.` +and `_` being the only allowed symbols. + +The `lookup` line has changed from `of` to `foreach`, and we're now passing three dimensions. + +In this example, Netdata will create three alarms with the names `cpu_template_system`, `cpu_template_user`, and +`cpu_template_nice`. Every minute, each alarm will use the same database query to calculate the average CPU usage for +the `system`, `user`, and `nice` dimensions over the last 10 minutes and send out alarms if necessary. + +You can find these three alarms active by clicking on the **Alarms** button in the top navigation, and then clicking on +the **All** tab and scrolling to the **system - cpu** collapsible section. + +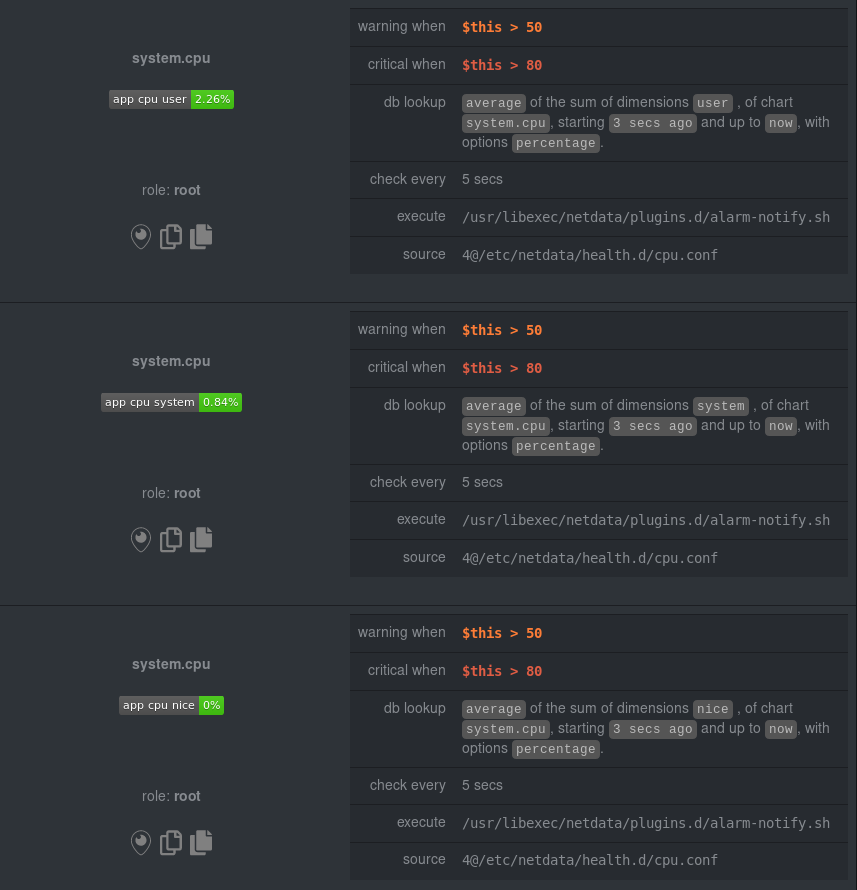 + +Let's look at some other examples of how `foreach` works so you can best apply it in your configurations. + +### Using a Netdata simple pattern in `foreach` + +In the last example, we used `foreach system,user,nice` to create three distinct alarms using dimension templates. But +what if you want to quickly create alarms for _all_ the dimensions of a given chart? + +Use a [simple pattern](https://github.com/netdata/netdata/blob/master/libnetdata/simple_pattern/README.md)! One example of a simple pattern is a single wildcard +(`*`). + +Instead of monitoring system CPU usage, let's monitor per-application CPU usage using the `apps.cpu` chart. Passing a +wildcard as the simple pattern tells Netdata to create a separate alarm for _every_ process on your system: + +```yaml + alarm: app_cpu + on: apps.cpu +lookup: average -10m percentage foreach * + every: 1m + warn: $this > 50 + crit: $this > 80 +``` + +This entity will now create alarms for every dimension in the `apps.cpu` chart. Given that most `apps.cpu` charts have +10 or more dimensions, using the wildcard ensures you catch every CPU-hogging process. + +To learn more about how to use simple patterns with dimension templates, see +our [simple patterns documentation](https://github.com/netdata/netdata/blob/master/libnetdata/simple_pattern/README.md). + +### Using `foreach` with alarm templates + +Dimension templates also work +with [alarm templates](#alarm-line-alarm-or-template). +Alarm templates help you create alarms for all the charts with a given context—for example, all the cores of your +system's CPU. + +By combining the two, you can create dozens of individual alarms with a single template entity. Here's how you would +create alarms for the `system`, `user`, and `nice` dimensions for every chart in the `cpu.cpu` context—or, in other +words, every CPU core. + +```yaml +template: cpu_template + on: cpu.cpu + lookup: average -10m percentage foreach system,user,nice + every: 1m + warn: $this > 50 + crit: $this > 80 +``` + +On a system with a 6-core, 12-thread Ryzen 5 1600 CPU, this one entity creates alarms on the following charts and +dimensions: + +- `cpu.cpu0` + - `cpu_template_user` + - `cpu_template_system` + - `cpu_template_nice` + +- `cpu.cpu1` + - `cpu_template_user` + - `cpu_template_system` + - `cpu_template_nice` + +- `cpu.cpu2` + - `cpu_template_user` + - `cpu_template_system` + - `cpu_template_nice` + +- ... + +- `cpu.cpu11` + - `cpu_template_user` + - `cpu_template_system` + - `cpu_template_nice` + +And how just a few of those dimension template-generated alarms look like in the Netdata dashboard. +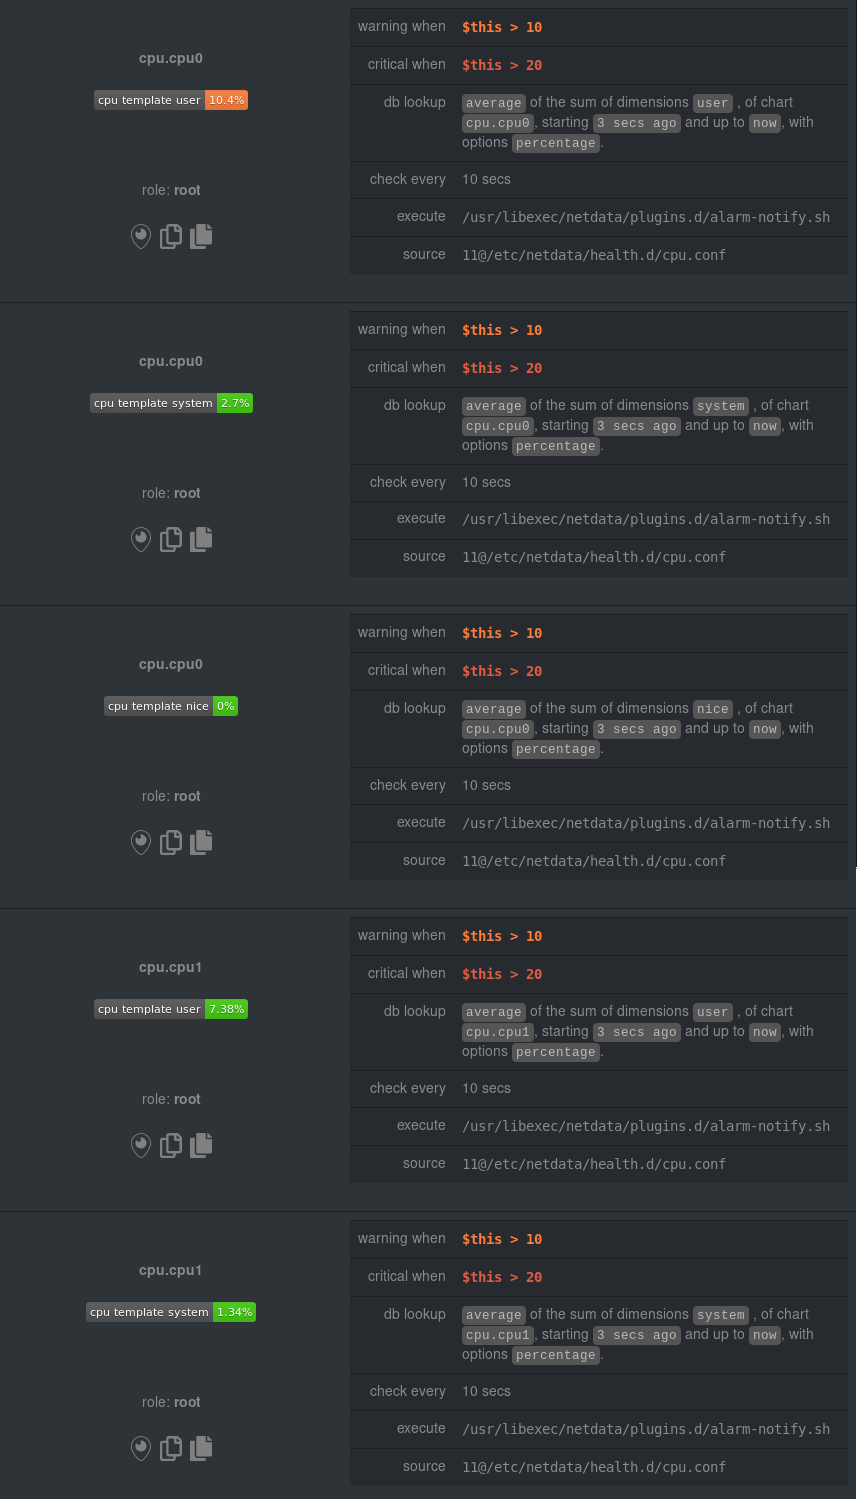 +All in all, this single entity creates 36 individual alarms. Much easier than writing 36 separate entities in your +health configuration files! |