
diff options
Diffstat (limited to 'docs')
| -rw-r--r-- | docs/guides/monitor/lamp-stack.md | 2 | ||||
| -rw-r--r-- | docs/metrics-storage-management/how-streaming-works.md | 2 | ||||
| -rw-r--r-- | docs/quickstart/infrastructure.md | 2 | ||||
| -rw-r--r-- | docs/store/distributed-data-architecture.md | 2 | ||||
| -rw-r--r-- | docs/visualize/create-dashboards.md | 4 | ||||
| -rw-r--r-- | docs/visualize/overview-infrastructure.md | 22 |
6 files changed, 7 insertions, 27 deletions
diff --git a/docs/guides/monitor/lamp-stack.md b/docs/guides/monitor/lamp-stack.md index 47a13177b6..42b4ee6321 100644 --- a/docs/guides/monitor/lamp-stack.md +++ b/docs/guides/monitor/lamp-stack.md @@ -171,7 +171,7 @@ If the Netdata Agent isn't already open in your browser, open a new tab and navi Netdata automatically organizes all metrics and charts onto a single page for easy navigation. Peek at gauges to see overall system performance, then scroll down to see more. Click-and-drag with your mouse to pan _all_ charts back and forth through different time intervals, or hold `SHIFT` and use the scrollwheel (or two-finger scroll) to zoom in and -out. Check out our doc on [interacting with charts](https://github.com/netdata/netdata/blob/master/docs/visualize/interact-dashboards-charts.md) for all the details. +out. Check out our doc on [interacting with charts](https://github.com/netdata/netdata/blob/master/docs/dashboard/interact-charts.md) for all the details.  diff --git a/docs/metrics-storage-management/how-streaming-works.md b/docs/metrics-storage-management/how-streaming-works.md index f09b13b4cc..1934a3362e 100644 --- a/docs/metrics-storage-management/how-streaming-works.md +++ b/docs/metrics-storage-management/how-streaming-works.md @@ -19,7 +19,7 @@ replicate metrics data across multiple nodes, or centralize all your metrics dat (TSDB). When one node streams metrics to another, the node receiving metrics can visualize them on the -[dashboard](https://github.com/netdata/netdata/blob/master/docs/visualize/interact-dashboards-charts.md), run health checks to [trigger +[dashboard](https://github.com/netdata/netdata/blob/master/docs/dashboard/interact-charts.md), run health checks to [trigger alarms](https://github.com/netdata/netdata/blob/master/docs/monitor/view-active-alarms.md) and [send notifications](https://github.com/netdata/netdata/blob/master/docs/monitor/enable-notifications.md), and [export](https://github.com/netdata/netdata/blob/master/docs/export/external-databases.md) all metrics to an external TSDB. When Netdata streams metrics to another Netdata, the receiving one is able to perform everything a Netdata instance is capable of. diff --git a/docs/quickstart/infrastructure.md b/docs/quickstart/infrastructure.md index 80eb0f2e50..92c3cb1a13 100644 --- a/docs/quickstart/infrastructure.md +++ b/docs/quickstart/infrastructure.md @@ -91,7 +91,7 @@ historical data, and see like metrics presented meaningfully to help you trouble Read about the process in the [infrastructure overview](https://github.com/netdata/netdata/blob/master/docs/visualize/overview-infrastructure.md#drill-down-with-single-node-dashboards) doc, then learn about [interacting with -dashboards and charts](https://github.com/netdata/netdata/blob/master/docs/visualize/interact-dashboards-charts.md) to get the most from all of Netdata's real-time +dashboards and charts](https://github.com/netdata/netdata/blob/master/docs/cloud/visualize/interact-new-charts.md) to get the most from all of Netdata's real-time metrics. ### Create new dashboards diff --git a/docs/store/distributed-data-architecture.md b/docs/store/distributed-data-architecture.md index 96ae4d9995..f4d520ea2e 100644 --- a/docs/store/distributed-data-architecture.md +++ b/docs/store/distributed-data-architecture.md @@ -14,7 +14,7 @@ Netdata uses a distributed data architecture to help you collect and store per-s Every node in your infrastructure, whether it's one or a thousand, stores the metrics it collects. Netdata Cloud bridges the gap between many distributed databases by _centralizing the interface_ you use to query and -visualize your nodes' metrics. When you [look at charts in Netdata Cloud](https://github.com/netdata/netdata/blob/master/docs/visualize/interact-dashboards-charts.md) +visualize your nodes' metrics. When you [look at charts in Netdata Cloud](https://github.com/netdata/netdata/blob/master/docs/cloud/visualize/interact-new-charts.md) , the metrics values are queried directly from that node's database and securely streamed to Netdata Cloud, which proxies them to your browser. diff --git a/docs/visualize/create-dashboards.md b/docs/visualize/create-dashboards.md index e1fd2c4ce9..d08b7caa7a 100644 --- a/docs/visualize/create-dashboards.md +++ b/docs/visualize/create-dashboards.md @@ -28,7 +28,7 @@ respond node](https://user-images.githubusercontent.com/1153921/102650776-a654ba80-4128-11eb-9a65-4f9801b03d4b.png) Charts in dashboards -are [fully interactive](https://github.com/netdata/netdata/blob/master/docs/visualize/interact-dashboards-charts.md) and +are [fully interactive](https://github.com/netdata/netdata/blob/master/docs/cloud/visualize/interact-new-charts.md) and synchronized. You can pan through time, zoom, highlight specific timeframes, and more. @@ -44,7 +44,7 @@ more detail when troubleshooting an issue. Quickly jump to any node's dashboard of any card to open a menu. Hit the **Go to Chart** item. Netdata Cloud takes you to the same chart on that node's dashboard. You can now navigate all that node's metrics and -[interact with charts](https://github.com/netdata/netdata/blob/master/docs/visualize/interact-dashboards-charts.md) to +[interact with charts](https://github.com/netdata/netdata/blob/master/docs/cloud/visualize/interact-new-charts.md) to further investigate anomalies or troubleshoot complex performance problems. diff --git a/docs/visualize/overview-infrastructure.md b/docs/visualize/overview-infrastructure.md index ff76aea260..4591bfa907 100644 --- a/docs/visualize/overview-infrastructure.md +++ b/docs/visualize/overview-infrastructure.md @@ -84,7 +84,7 @@ given node to quickly _jump to the same chart in that node's single-node dashboa You can use single-node dashboards in Netdata Cloud to drill down on specific issues, scrub backward in time to investigate historical data, and see like metrics presented meaningfully to help you troubleshoot performance problems. -All of the familiar [interactions](https://github.com/netdata/netdata/blob/master/docs/visualize/interact-dashboards-charts.md) are available, as is adding any chart +All of the familiar [interactions](https://github.com/netdata/netdata/blob/master/docs/cloud/visualize/interact-new-charts.md) are available, as is adding any chart to a [new dashboard](https://github.com/netdata/netdata/blob/master/docs/visualize/create-dashboards.md). ## Nodes view @@ -93,23 +93,3 @@ You can also use the **Nodes view** to monitor the health status and user-config in a War Room. Read the [Nodes view doc](https://github.com/netdata/netdata/blob/master/docs/cloud/visualize/nodes.md) for details. 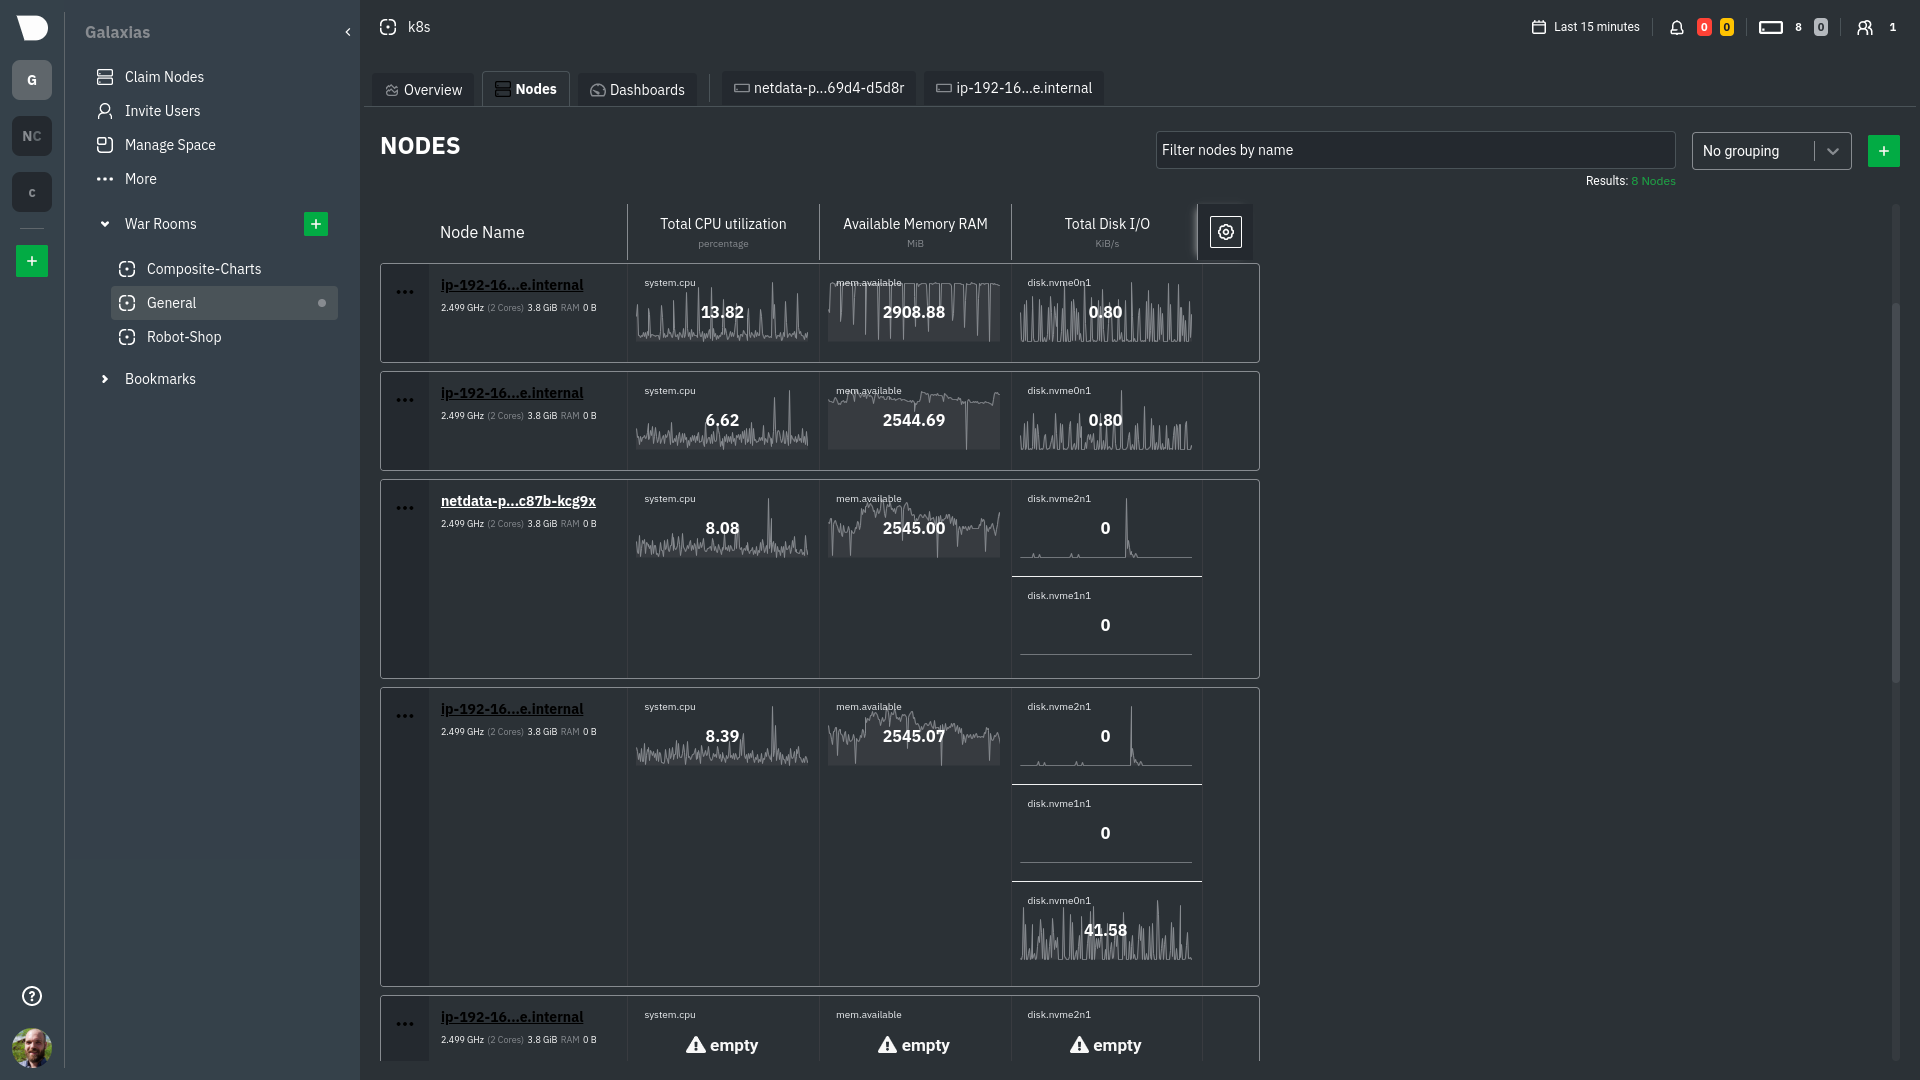 - -## What's next? - -To troubleshoot complex performance issues using Netdata, you need to understand how to interact with its meaningful -visualizations. Learn more about [interaction](https://github.com/netdata/netdata/blob/master/docs/visualize/interact-dashboards-charts.md) to see historical metrics, -highlight timeframes for targeted analysis, and more. - -If you're a Kubernetes user, read about Netdata's [Kubernetes -visualizations](https://github.com/netdata/netdata/blob/master/docs/cloud/visualize/kubernetes.md) for details about the health map and -time-series k8s charts, and our tutorial, [_Kubernetes monitoring with Netdata: Overview and -visualizations_](https://github.com/netdata/netdata/blob/master/docs/guides/monitor/kubernetes-k8s-netdata.md), for a full walkthrough. - -### Related reference documentation - -- [Netdata Cloud · War Rooms](https://github.com/netdata/netdata/blob/master/docs/cloud/war-rooms.md) -- [Netdata Cloud · Overview](https://github.com/netdata/netdata/blob/master/docs/cloud/visualize/overview.md) -- [Netdata Cloud · Nodes view](https://github.com/netdata/netdata/blob/master/docs/cloud/visualize/nodes.md) -- [Netdata Cloud · Kubernetes visualizations](https://github.com/netdata/netdata/blob/master/docs/cloud/visualize/kubernetes.md) - - |