
diff options
Diffstat (limited to 'docs')
| -rw-r--r-- | docs/collect/application-metrics.md | 4 | ||||
| -rw-r--r-- | docs/collect/container-metrics.md | 12 | ||||
| -rw-r--r-- | docs/collect/system-metrics.md | 9 | ||||
| -rw-r--r-- | docs/configure/nodes.md | 12 | ||||
| -rw-r--r-- | docs/configure/secure-nodes.md | 17 | ||||
| -rw-r--r-- | docs/get/README.md | 39 | ||||
| -rw-r--r-- | docs/monitor/configure-alarms.md | 8 | ||||
| -rw-r--r-- | docs/monitor/view-active-alarms.md | 16 | ||||
| -rw-r--r-- | docs/overview/what-is-netdata.md | 7 | ||||
| -rw-r--r-- | docs/overview/why-netdata.md | 2 | ||||
| -rw-r--r-- | docs/quickstart/infrastructure.md | 15 | ||||
| -rw-r--r-- | docs/store/distributed-data-architecture.md | 2 | ||||
| -rw-r--r-- | docs/visualize/view-all-nodes.md | 8 |
13 files changed, 86 insertions, 65 deletions
diff --git a/docs/collect/application-metrics.md b/docs/collect/application-metrics.md index ec5127ac3a..c36cc72b1a 100644 --- a/docs/collect/application-metrics.md +++ b/docs/collect/application-metrics.md @@ -69,6 +69,10 @@ list](/collectors/COLLECTORS.md#service-and-application-collectors) that can run ## What's next? +If you haven't yet seen the [supported collectors list](/collectors/COLLECTORS.md) give it a once-over for any +additional applications you may want to monitor using Netdata's native collectors, or the [generic Prometheus +collector](https://learn.netdata.cloud/docs/agent/collectors/go.d.plugin/modules/prometheus). + Collecting all the available metrics on your nodes, and across your entire infrastructure, is just one piece of the puzzle. Next, learn more about Netdata's famous real-time visualizations by [viewing all your nodes at a glance](/docs/visualize/view-all-nodes.md). diff --git a/docs/collect/container-metrics.md b/docs/collect/container-metrics.md index c27b84483d..c9c83c97d0 100644 --- a/docs/collect/container-metrics.md +++ b/docs/collect/container-metrics.md @@ -70,11 +70,13 @@ your k8s infrastructure. - A [Helm chart](https://github.com/netdata/helmchart), which bootstraps a Netdata Agent pod on every node in your cluster, plus an additional parent pod for storing metrics and managing alarm notifications. -- A [service discovery plugin](https://github.com/netdata/agent-service-discovery), which discovers and immediately - monitors 22 different services that might be running inside of your cluster's pods. Service discovery happens - without manual intervention as pods are created, destroyed, or moved between nodes. [Compatible - services](https://github.com/netdata/helmchart#service-discovery-and-supported-services) include Nginx, Apache, - MySQL, CoreDNS, and much more. +- A [service discovery plugin](https://github.com/netdata/agent-service-discovery), which discovers and creates + configuration files for [compatible + applications](https://github.com/netdata/helmchart#service-discovery-and-supported-services) and any endpoints + covered by our [generic Prometheus + collector](https://learn.netdata.cloud/docs/agent/collectors/go.d.plugin/modules/prometheus). With these + configuration files, Netdata collects metrics from any compatible applications as they run _inside_ of a pod. + Service discovery happens without manual intervention as pods are created, destroyed, or moved between nodes. - A [Kubelet collector](https://learn.netdata.cloud/docs/agent/collectors/go.d.plugin/modules/k8s_kubelet), which runs on each node in a k8s cluster to monitor the number of pods/containers, the volume of operations on each container, and more. diff --git a/docs/collect/system-metrics.md b/docs/collect/system-metrics.md index a27942f262..72aa5714be 100644 --- a/docs/collect/system-metrics.md +++ b/docs/collect/system-metrics.md @@ -39,9 +39,12 @@ collector](https://learn.netdata.cloud/docs/agent/collectors/go.d.plugin/modules [windows_exporter](https://github.com/prometheus-community/windows_exporter), a small Go-based binary that you can run on Windows systems. The WMI collector then gathers metrics from an endpoint created by windows_exporter. -First, [install -windows_exporter](https://learn.netdata.cloud/docs/agent/collectors/go.d.plugin/modules/wmi#configuration) and run it: -`windows_exporter-0.13.0-amd64.exe --collectors.enabled="cpu,memory,net,logical_disk,os,system,logon"`. +First, [download windows_exporter](https://github.com/prometheus-community/windows_exporter#installation) and run it +with the following collectors enabled, changing `0.14.0` to the version you downloaded. + +```powershell +windows_exporter-0.14.0-amd64.exe --collectors.enabled="cpu,memory,net,logical_disk,os,system,logon" +``` Next, [configure the WMI collector](https://learn.netdata.cloud/docs/agent/collectors/go.d.plugin/modules/wmi#configuration) to point to the URL diff --git a/docs/configure/nodes.md b/docs/configure/nodes.md index 5998c1e746..761350b161 100644 --- a/docs/configure/nodes.md +++ b/docs/configure/nodes.md @@ -40,16 +40,14 @@ Upon installation, the Netdata config directory contains a few files and directo `/usr/lib/netdata/conf.d`, as they are overwritten by updates to the Netdata Agent._ - `edit-config` is a shell script used for [editing configuration files](#use-edit-config-to-edit-netdataconf). - `go.d/`, `python.d/`, `charts.d/`, `node.d`/, and `custom-plugins.d/`, which are directories for each of Netdata's - [orchestrators](/collectors/plugins.d/README.md#external-plugins-overview). These directories can each contain - additional `.conf` files for configuring specific collectors. + [orchestrators](/collectors/plugins.d/README.md). These directories can each contain additional `.conf` files for + configuring specific collectors. ## Use `edit-config` to edit `netdata.conf` -The best way to edit any configuration file is with `edit-config` script. This script opens existing Netdata -configuration files using your system's `$EDITOR`. If the file doesn't yet exist in your config directory, the script -copies the stock version from `/usr/lib/netdata/conf.d` and opens it for editing. - -`edit-config` is the recommended way to easily and safely edit Netdata's configuration. +The **recommended way to easily and safely edit Netdata's configuration** is with the `edit-config` script. This script +opens existing Netdata configuration files using your system's `$EDITOR`. If the file doesn't yet exist in your config +directory, the script copies the stock version from `/usr/lib/netdata/conf.d` and opens it for editing. Run `edit-config` without any options to see details on its usage and a list of all the configuration files you can edit. diff --git a/docs/configure/secure-nodes.md b/docs/configure/secure-nodes.md index 629409f815..9e5784b311 100644 --- a/docs/configure/secure-nodes.md +++ b/docs/configure/secure-nodes.md @@ -8,7 +8,7 @@ custom_edit_url: https://github.com/netdata/netdata/edit/master/docs/configure/s # Secure your nodes -Upon installation, the Netdata Agent serves the local dashboard at port `19999`. If the node is accessible to the +Upon installation, the Netdata Agent serves the **local dashboard** at port `19999`. If the node is accessible to the internet at large, anyone can access the dashboard and your node's metrics at `http://NODE:19999`. We made this decision so that the local dashboard was immediately accessible to users, and so that we don't dictate how professionals set up and secure their infrastructures. @@ -27,9 +27,9 @@ Instead of dictating how to secure your infrastructure, we give you many options that align with your goals and your organization's standards. - [Disable the local dashboard](#disable-the-local-dashboard): **Simplest and recommended method** for those who have - added nodes to Netdata Cloud and view metrics there. -- [Restrict access to the local dashboard](#restrict-access-to-the-local-dashboard): Allow dashboard access from only - certain IP addresses, such as a trusted static IP or connections from behind a management LAN. Full support for + added nodes to Netdata Cloud and view dashboards and metrics there. +- [Restrict access to the local dashboard](#restrict-access-to-the-local-dashboard): Allow local dashboard access from + only certain IP addresses, such as a trusted static IP or connections from behind a management LAN. Full support for Netdata Cloud. - [Use a reverse proxy](#use-a-reverse-proxy): Password-protect a local dashboard and enable TLS to secure it. Full support for Netdata Cloud. @@ -39,13 +39,13 @@ that align with your goals and your organization's standards. This is the _recommended method for those who have claimed their nodes to Netdata Cloud_ and prefer viewing real-time metrics using the Nodes view and Cloud dashboards. -You can disable the local dashboard entirely but retain the encrypted Agent-Cloud link ([ACLK](/aclk/README.md)) that +You can disable the local dashboard (and API) but retain the encrypted Agent-Cloud link ([ACLK](/aclk/README.md)) that allows you to stream metrics on demand from your nodes via the Netdata Cloud interface. This change mitigates all concerns about revealing metrics and system design to the internet at large, while keeping all the functionality you -need to view metrics and troubleshoot issues. +need to view metrics and troubleshoot issues with Netdata Cloud. Open `netdata.conf` with `./edit-config netdata.conf`. Scroll down to the `[web]` section, and find the `mode = -static-threaded` setting. To disable the local dashboard, change this setting to `none`. +static-threaded` setting, and change it to `none`. ```conf [web] @@ -97,7 +97,8 @@ The `allow connections from` setting is global and restricts access to the dashb ``` See the [web server](/web/server/README.md#access-lists) docs for additional details about access lists. You can take -access lists one step further by [enabling SSL](/web/server/README.md#enabling-tls-support) to encrypt data in transit. +access lists one step further by [enabling SSL](/web/server/README.md#enabling-tls-support) to encrypt data from local +dashboard in transit. The connection to Netdata Cloud is always secured with TLS. ## Use a reverse proxy diff --git a/docs/get/README.md b/docs/get/README.md index 69a0b00089..bd2580dba3 100644 --- a/docs/get/README.md +++ b/docs/get/README.md @@ -9,10 +9,10 @@ custom_edit_url: https://github.com/netdata/netdata/edit/master/docs/get/README. import { OneLineInstall } from '../src/components/OneLineInstall/' import { Install, InstallBox } from '../src/components/InstallBox/' -Netdata uses an open-source monitoring Agent and web application [together](/docs/overview/what-is-netdata.md) to help -you collect every metric, visualize the health of your systems, and troubleshoot complex performance problems. Once -you've signed in to Netdata Cloud and installed the Netdata Agent on all your nodes, you can claim these nodes and see -their real-time metrics on a single interface. +Netdata uses the open-source Netdata Agent and Netdata Cloud web application +[together](/docs/overview/what-is-netdata.md) to help you collect every metric, visualize the health of your nodes, and +troubleshoot complex performance problems. Once you've signed in to Netdata Cloud and installed the Netdata Agent on all +your nodes, you can claim your nodes and see their real-time metrics on a single interface. ## Sign in to Netdata Cloud @@ -28,7 +28,7 @@ devices. It runs on Linux distributions (**Ubuntu**, **Debian**, **CentOS**, and required. > ⚠️ Many distributions ship with third-party packages of Netdata, which we cannot maintain or keep up-to-date. For the -> best experience, use one of the methods described or link to below. +> best experience, use one of the methods described or linked to below. The **recommended** way to install the Netdata Agent on a Linux system is our one-line [kickstart script](/packaging/installer/methods/kickstart.md). This script automatically installs dependencies and builds Netdata @@ -62,18 +62,22 @@ platform to see specific instructions. <InstallBox to="/docs/agent/packaging/installer/methods/cloud-providers" img="/img/index/methods/cloud.svg" + imgDark="/img/index/methods/cloud-dark.svg" os="Cloud providers (GCP, AWS, Azure)" /> <InstallBox to="/docs/agent/packaging/installer/methods/packages" img="/img/index/methods/package.svg" + imgDark="/img/index/methods/package-dark.svg" os="Linux with .deb/.rpm" /> <InstallBox to="/docs/agent/packaging/installer/methods/kickstart-64" img="/img/index/methods/static.svg" + imgDark="/img/index/methods/static-dark.svg" os="Linux with static 64-bit binary" /> <InstallBox to="/docs/agent/packaging/installer/methods/manual" img="/img/index/methods/git.svg" + imgDark="/img/index/methods/git-dark.svg" os="Linux from Git" /> <InstallBox to="/docs/agent/packaging/installer/methods/freebsd" @@ -94,33 +98,38 @@ connection to Netdata Cloud using the [Agent-Cloud link](/aclk/README.md), and p access to that node. When you view a node in Netdata Cloud, the Agent running on that node streams metrics, metadata, and alarm status to -Netdata Cloud, which in turn streams those metrics to your web browser. Netdata Cloud does not store or log metrics or -alarm status. +Netdata Cloud, which in turn streams those metrics to your web browser. Netdata Cloud [does not +store](/docs/store/distributed-data-architecture.md#does-netdata-cloud-store-my-metrics) or log metrics values. To claim a node, you need to run the claiming script. In Netdata Cloud, click on your Space's name, then **Manage your Space** in the dropdown. Click **Nodes** in the panel that appears. Copy the script and run it in your node's terminal. -For example: +The script looks like the following, with long strings instead of `TOKEN` and `ROOM1,ROOM2`: ```bash sudo netdata-claim.sh -token=TOKEN -rooms=ROOM1,ROOM2 -url=https://app.netdata.cloud ``` -The script should return `Agent was successfully claimed.` after creating a new RSA pair and establishing the link to -Netdata Cloud. +The script returns `Agent was successfully claimed.` after creating a new RSA pair and establishing the link to Netdata +Cloud. If the script returns an error, try our [troubleshooting tips](/claim/README.md#troubleshooting). -For more information on the claiming process, why we implemented it, and how it works, see the [claim](/claim/README.md) -and [Agent-Cloud link](/aclk/README.md) reference docs. +> 💡 Our claiming reference guide also contains instructions for claiming [Docker +> containers](/claim/README.md#claim-an-agent-running-in-docker), [Kubernetes cluster parent +> pods](/claim/README.md#claim-an-agent-running-in-docker), via a [proxy](/claim/README.md#claim-through-a-proxy), and +> more. <details> <summary>Watch how claiming nodes works</summary> <iframe width="820" height="460" src="https://www.youtube.com/embed/UAzVvhMab8g" frameborder="0" allow="accelerometer; autoplay; clipboard-write; encrypted-media; gyroscope; picture-in-picture" allowfullscreen></iframe> </details> +For more information on the claiming process, why we implemented it, and how it works, see the [claim](/claim/README.md) +and [Agent-Cloud link](/aclk/README.md) reference docs. + ## What's next? -At this point, you have set up your free Netdata Cloud account, installed the Agent, and claimed one or more nodes to -your Space. You're ready to start monitoring, visualizing, and troubleshooting with Netdata. We have two quickstart -guides based on the scope of what you need to monitor: +At this point, you have set up your free Netdata Cloud account, installed the Netdata Agent on your node(s), and claimed +one or more nodes to your Space. You're ready to start monitoring, visualizing, and troubleshooting with Netdata. We +have two quickstart guides based on the scope of what you need to monitor. Interested in monitoring a single node? Check out our [single-node monitoring quickstart](/docs/quickstart/single-node.md). diff --git a/docs/monitor/configure-alarms.md b/docs/monitor/configure-alarms.md index a11ba32a27..4575b03ea1 100644 --- a/docs/monitor/configure-alarms.md +++ b/docs/monitor/configure-alarms.md @@ -60,10 +60,8 @@ Save the file and [reload Netdata's health configuration](#reload-health-configu ### Silence an individual alarm -Many Netdata users don't need all the default alarms enabled. Instead of disabling any given alarm, or even _all_ -alarms, you can silence individual alarms by changing one line in a given health entity. - -To silence any single alarm, change the `to:` line to `silent`. +Instead of disabling an alarm altogether, or even disabling _all_ alarms, you can silence individual alarms by changing +one line in a given health entity. To silence any single alarm, change the `to:` line in its entity to `silent`. ```yaml to: silent @@ -72,7 +70,7 @@ To silence any single alarm, change the `to:` line to `silent`. ## Write a new health entity While tuning existing alarms may work in some cases, you may need to write entirely new health entities based on how -your systems and applications work. +your systems, containers, and applications work. Read Netdata's [health reference](/health/REFERENCE.md#health-entity-reference) for a full listing of the format, syntax, and functionality of health entities. diff --git a/docs/monitor/view-active-alarms.md b/docs/monitor/view-active-alarms.md index 81460095fe..f624af91cb 100644 --- a/docs/monitor/view-active-alarms.md +++ b/docs/monitor/view-active-alarms.md @@ -16,25 +16,25 @@ active alarms in both the local dashboard and Netdata Cloud. You can see active alarms from any node in your infrastructure in two ways: Click on the bell 🔔 icon in the top navigation, or click on the first column of any node's row in Nodes. This column's color changes based on the node's -health status: gray is `CLEAR`, yellow is `WARNING`, and red is `CRITICAL`. +[health status](/health/REFERENCE.md#alarm-statuses): gray is `CLEAR`, yellow is `WARNING`, and red is `CRITICAL`. -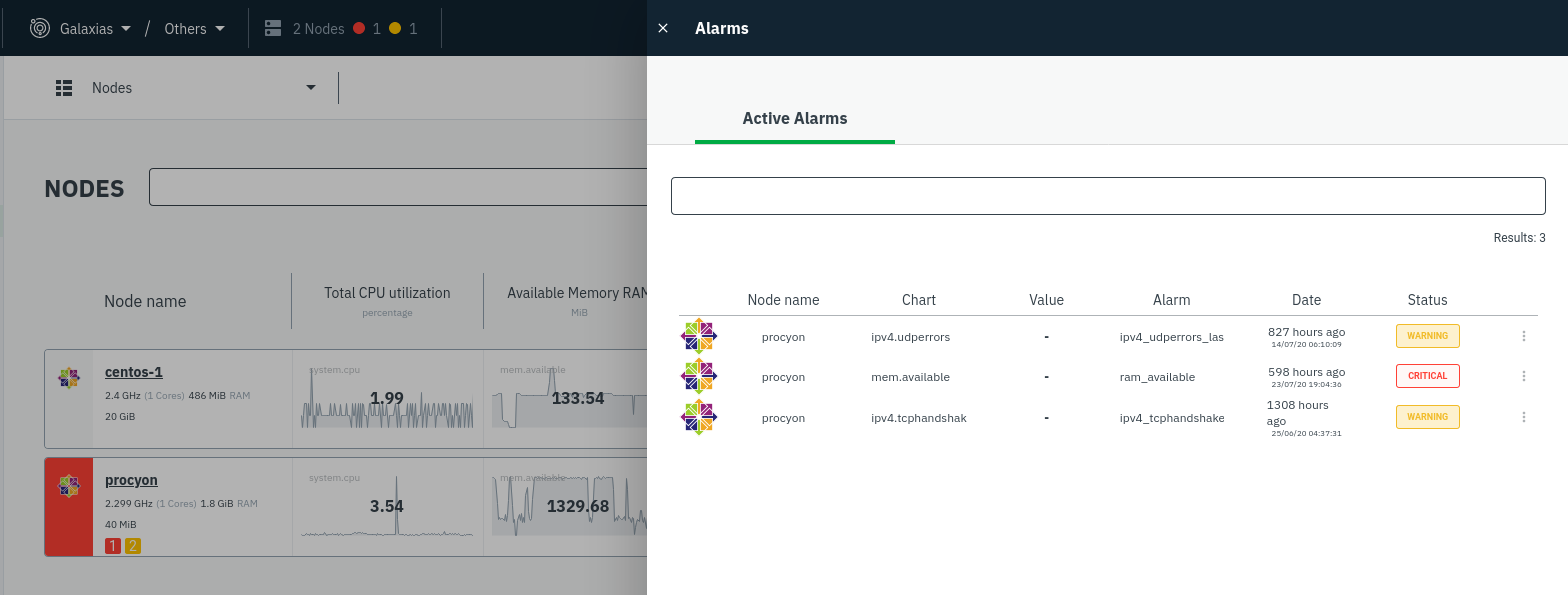 + The Alarms panel lists all active alarms for nodes within that War Room, and tells you which chart triggered the alarm, what that chart's current value is, the alarm that triggered it, and when the alarm status first began. -You can use the input field in the Alarms panel to filter active alarms. You can sort by the node's name, alarm, status, -chart that triggered the alarm, or the operating system. Read more about the [filtering +Use the input field in the Alarms panel to filter active alarms. You can sort by the node's name, alarm, status, chart +that triggered the alarm, or the operating system. Read more about the [filtering syntax](/docs/visualize/view-all-nodes.md#filter-and-group-your-infrastructure) to build valuable filters for your infrastructure. Click on the 3-dot icon (`⋮`) to view active alarm information or navigate directly to the offending chart in that node's Cloud dashboard with the **Go to chart** button. -The active alarm information gives you in-depth information about the alarm that's been triggered. You can see the -alarm's configuration, how it calculates warning or critical alarms, and which configuration file you could edit on that -node if you want to tweak or disable the alarm to better suit your needs. +The active alarm information gives you details about the alarm that's been triggered. You can see the alarm's +configuration, how it calculates warning or critical alarms, and which configuration file you could edit on that node if +you want to tweak or disable the alarm to better suit your needs. 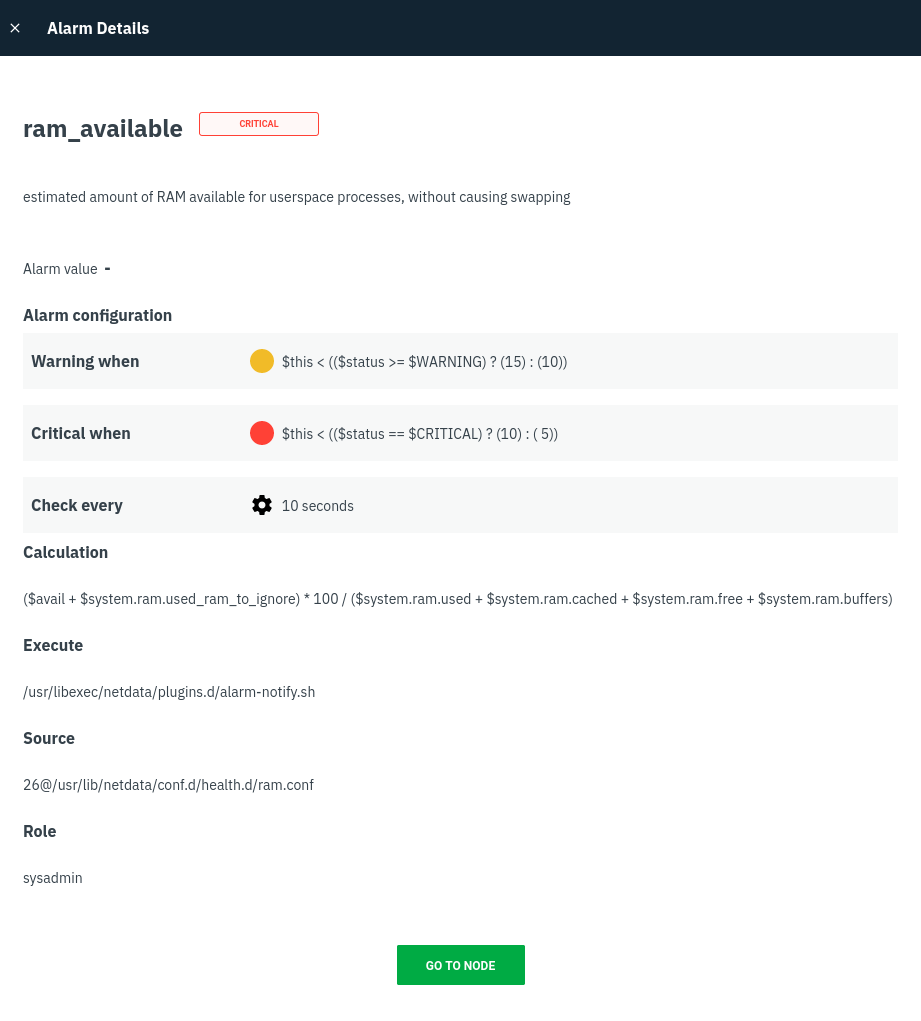 diff --git a/docs/overview/what-is-netdata.md b/docs/overview/what-is-netdata.md index 441d336da3..8ee0db410d 100644 --- a/docs/overview/what-is-netdata.md +++ b/docs/overview/what-is-netdata.md @@ -10,7 +10,7 @@ Netdata helps sysadmins, SREs, DevOps engineers, and IT professionals collect al applications, visualize these metrics in real-time, and troubleshoot complex performance problems. Netdata's solution uses two components, the Netdata Agent and Netdata Cloud, to deliver real-time performance and health -monitoring for both single nodes and entire infrastructures. +monitoring for both single nodes and entire infrastructure. ## Netdata Agent @@ -18,8 +18,9 @@ Netdata's distributed monitoring Agent collects thousands of metrics from system configuration. It runs permanently on all your physical/virtual servers, containers, cloud deployments, and edge/IoT devices. -You can install Netdata on most Linux distributions (Ubuntu, Debian, CentOS, and more), container/microservice platforms -(Kubernetes clusters, Docker), and many other operating systems (FreeBSD, macOS), with no `sudo` required. +You can [install](/docs/get/README.md#install-the-netdata-agent) Netdata on most Linux distributions (Ubuntu, Debian, +CentOS, and more), container/microservice platforms (Kubernetes clusters, Docker), and many other operating systems +(FreeBSD, macOS), with no `sudo` required.  diff --git a/docs/overview/why-netdata.md b/docs/overview/why-netdata.md index d97f42caff..27a30a4c6a 100644 --- a/docs/overview/why-netdata.md +++ b/docs/overview/why-netdata.md @@ -14,7 +14,7 @@ Netdata is: ## Simple to deploy -- **One-line deployment** for Linux distributions, plus support for Kubernetes/Docker infrastructures +- **One-line deployment** for Linux distributions, plus support for Kubernetes/Docker infrastructures. - **Zero configuration and maintenance** required to collect thousands of metrics, every second, from the underlying OS and running applications. - **Prebuilt charts and alarms** alert you to common anomalies and performance issues without manual configuration. diff --git a/docs/quickstart/infrastructure.md b/docs/quickstart/infrastructure.md index 9ce3ad214c..10cf58df6c 100644 --- a/docs/quickstart/infrastructure.md +++ b/docs/quickstart/infrastructure.md @@ -9,17 +9,22 @@ custom_edit_url: https://github.com/netdata/netdata/edit/master/docs/quickstart/ Together, the Netdata Agent and Netdata Cloud create a powerful, infinitely-scalable infrastructure monitoring solution. -The Netdata Agent uses zero-configuration collectors to gather metrics from every application and container instantly. -The distributed data model lets you monitor everything without a slow and troublesome centralized data lake for your -infrastructure's metrics, reducing the resources you need to invest in metrics retention. Netdata Cloud unifies all the -metrics from these distributed nodes on customizable, interactive, and real-time visualizations. +The Netdata Agent uses zero-configuration collectors to gather metrics from every application and container instantly, +and uses Netdata's [distributed data architecture](/docs/store/distributed-data-architecture.md) to store metrics +locally. Without a slow and troublesome centralized data lake for your infrastructure's metrics, you reduce the +resources you need to invest in, and the complexity of, monitoring your infrastructure. + +Netdata Cloud unifies monitoring your infrastructure by _centralizing the interface_ you use to query and visualize your +nodes' metrics, not the data. By streaming metrics values to your browser, with Netdata Cloud acting as the secure proxy +between them, you can monitor your infrastructure using customizable, interactive, and real-time visualizations from any +numbe of distributed nodes. In this quickstart guide, you'll learn how to see key metrics from all your nodes in one interface and build your first dashboard for aggregating like metrics from many distributed nodes. You'll then take a peek into configuring individual nodes and get helpful pointers about collecting all the metrics from every critical application in your infrastructure. > This quickstart assumes you've installed the Netdata Agent on more than one node in your infrastructure, and claimed -> that node to your Space in Netdata Cloud. If you haven't yet, see the [_Get Netdata_ doc](/docs/get/README.md) for +> those nodes to your Space in Netdata Cloud. If you haven't yet, see the [_Get Netdata_ doc](/docs/get/README.md) for > details on installation and claiming. ## See your infrastructure's metrics diff --git a/docs/store/distributed-data-architecture.md b/docs/store/distributed-data-architecture.md index 354b3ce8e0..d3bee8fab6 100644 --- a/docs/store/distributed-data-architecture.md +++ b/docs/store/distributed-data-architecture.md @@ -9,7 +9,7 @@ custom_edit_url: https://github.com/netdata/netdata/edit/master/docs/store/distr Netdata uses a distributed data architecture to help you collect and store per-second metrics from any number of nodes. Every node in your infrastructure, whether it's one or a thousand, stores the metrics it collects. -Netdata Cloud bridges the gap between many distributed databases by _centralizing the interface you use_ to query and +Netdata Cloud bridges the gap between many distributed databases by _centralizing the interface_ you use to query and visualize your nodes' metrics. When you [look at charts in Netdata Cloud](/docs/visualize/interact-dashboards-charts.md), the metrics values are queried directly from that node's database and securely streamed to Netdata Cloud, which proxies them to your browser. diff --git a/docs/visualize/view-all-nodes.md b/docs/visualize/view-all-nodes.md index 8dc7d98400..559817fa0d 100644 --- a/docs/visualize/view-all-nodes.md +++ b/docs/visualize/view-all-nodes.md @@ -54,15 +54,15 @@ Nodes](https://user-images.githubusercontent.com/1153921/93496405-03d83180-f8c4- ## Filter and group your infrastructure Use the filter input next to the Nodes heading to filter the nodes in a given War Room. The filtering feature supports -relational operators (==, !=, contains, and !contains) and logical operators (AND, OR), plus the name, OS, or services -running on your nodes to quickly turn any War Room into a focused troubleshooting interface. See what services Netdata -Cloud can filter by in the [supported collectors list](/collectors/COLLECTORS.md). +relational operators (`==`, `!=`, `contains`, and `!contains`) and logical operators (`AND`, `OR`), plus the name, OS, +or services running on your nodes to quickly turn any War Room into a focused troubleshooting interface. See what +services Netdata Cloud can filter by in the [supported collectors list](/collectors/COLLECTORS.md). For example, `name == centos OR os == debian` filters any nodes by the exact name centos or has Debian as its operating system. You can also use parentheses around operators to create more sophisticated filters. `(name contains aws AND os contains -ubuntu) OR services == apache` shows only nodes that have aws in the hostname and are Ubuntu-based, or any nodes that +ubuntu) OR services == apache` shows only nodes that have `aws` in the hostname and are Ubuntu-based, or any nodes that have an Apache webserver running on them. ![Filtering a War Room in Netdata |