
diff options
Diffstat (limited to 'docs/visualize/view-all-nodes.md')
| -rw-r--r-- | docs/visualize/view-all-nodes.md | 77 |
1 files changed, 77 insertions, 0 deletions
diff --git a/docs/visualize/view-all-nodes.md b/docs/visualize/view-all-nodes.md new file mode 100644 index 0000000000..8dc7d98400 --- /dev/null +++ b/docs/visualize/view-all-nodes.md @@ -0,0 +1,77 @@ +<!-- +title: "View all nodes at a glance" +description: "With Netdata Cloud's War Rooms, you can see the health status and real-time key metrics from any number of nodes in your infrastructure." +custom_edit_url: https://github.com/netdata/netdata/edit/master/docs/visualize/view-all-nodes.md +--> + +# View all nodes at a glance + +In Netdata Cloud, your nodes are organized into War Rooms. The default view for any War Room is called the **Nodes +view**, which lets you see the health, performance, and alarm status of a particular cross-section of your +infrastructure. + +Each node occupies a single row, first featuring that node's alarm status (yellow for warnings, red for critical alarms) +and operating system, some essential information about the node, followed by any number of user-defined columns for key +metrics. + +Click on the hostname of any node to seamlessly navigate to that node's Cloud dashboard. From here, you will see all the +same charts and real-time metrics as you would if you viewed the local dashboard at `http://NODE:19999`. + +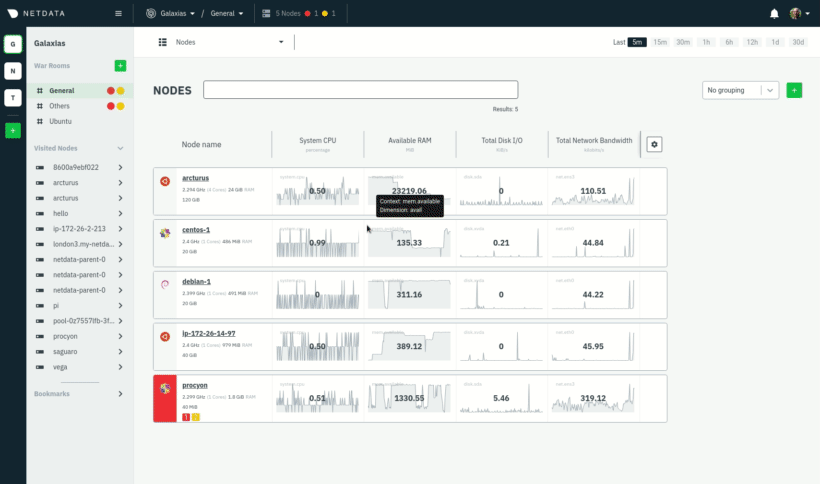 + +By combining Nodes view with Cloud dashboards, you and your team can view all nodes at a glance, immediately identify +anomalies with auto-updating health statuses and key metrics, then dive into individual dashboards for discovering the +root cause. + +## Add and edit key metrics + +Customize any War Room by adding new key metrics or editing the existing ones. These customizations appear for anyone +else with access to that War Room so that your entire team can troubleshoot from the same platform. + +Add more key metrics by clicking the gear icon in the Nodes view. Choose the context you'd like to add, give it a +relevant name, and select whether you want to see all dimensions (the default), or only the specific dimensions your +team is interested in. + +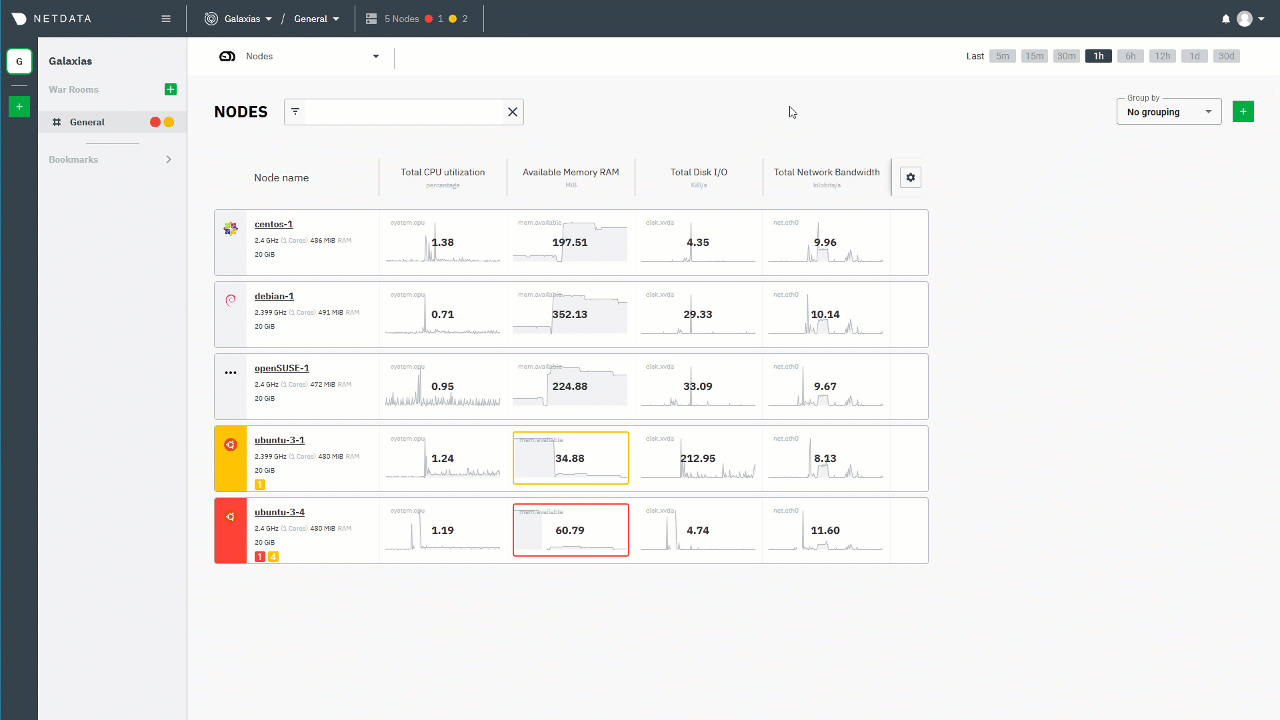 + +To edit existing key metrics, click the gear icon, then the pencil icon. Use the panel to edit that metric's context or +title, add or remove dimension, or delete the chart altogether. + +## Change the timeframe + +By default, the Nodes view shows the last 5 minutes of metrics data on every chart. The value displayed above the chart +is the 5-minute average of those metrics. + +Change the timeframe, and also change both the charts and the average value, by clicking on any of the buttons +next to the **Last** label. **15m** will display the last 15 minutes of metrics for each chart, **30m** for 30 minutes, +and so on. + +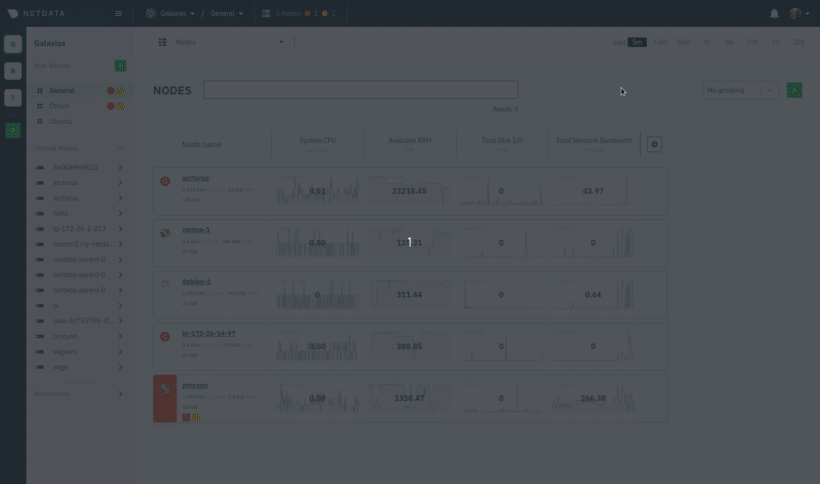 + +## Filter and group your infrastructure + +Use the filter input next to the Nodes heading to filter the nodes in a given War Room. The filtering feature supports +relational operators (==, !=, contains, and !contains) and logical operators (AND, OR), plus the name, OS, or services +running on your nodes to quickly turn any War Room into a focused troubleshooting interface. See what services Netdata +Cloud can filter by in the [supported collectors list](/collectors/COLLECTORS.md). + +For example, `name == centos OR os == debian` filters any nodes by the exact name centos or has Debian as its operating +system. + +You can also use parentheses around operators to create more sophisticated filters. `(name contains aws AND os contains +ubuntu) OR services == apache` shows only nodes that have aws in the hostname and are Ubuntu-based, or any nodes that +have an Apache webserver running on them. + +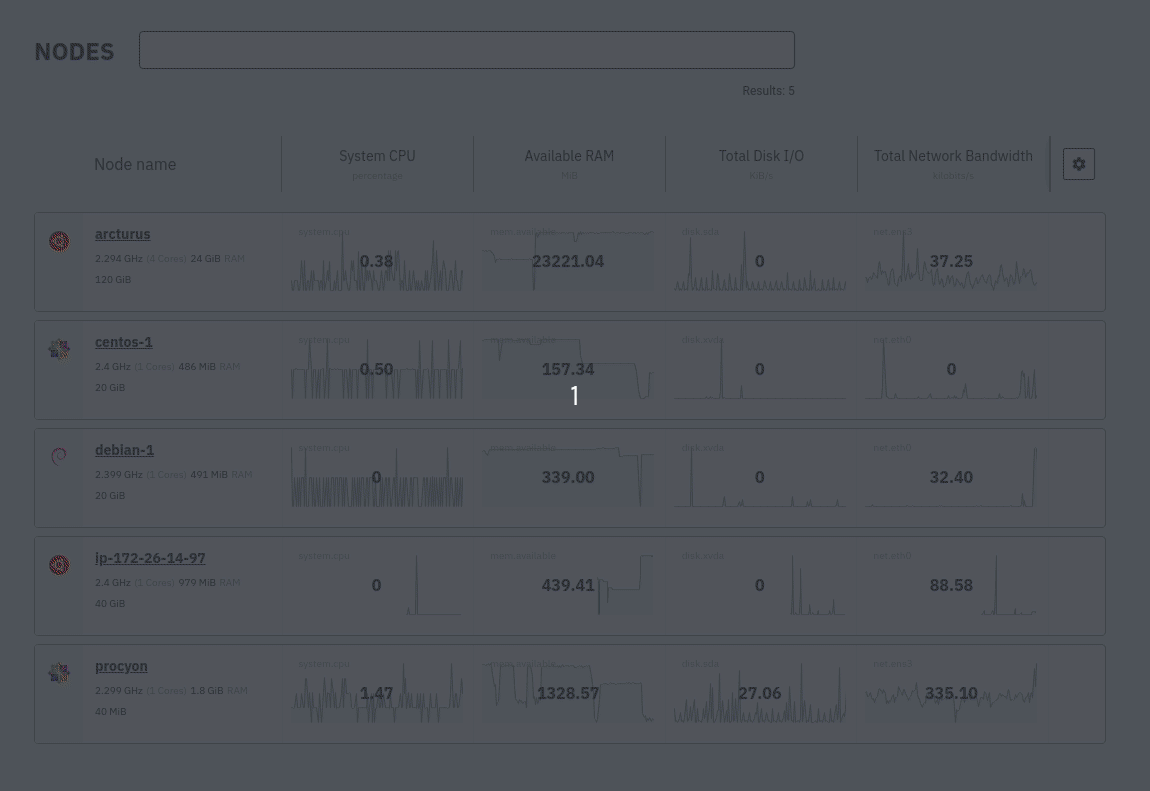 + +## What's next? + +To troubleshoot complex performance issues using Netdata, you need to understand how to interact with its meaningful +visualizations. Learn more about [interaction](/docs/visualize/interact-dashboards-charts.md) to see historical metrics, +highlight timeframes for targeted analysis, and more. + +[](<>) |