
diff options
Diffstat (limited to 'docs/visualize/overview-infrastructure.md')
| -rw-r--r-- | docs/visualize/overview-infrastructure.md | 47 |
1 files changed, 17 insertions, 30 deletions
diff --git a/docs/visualize/overview-infrastructure.md b/docs/visualize/overview-infrastructure.md index b677b584e8..63a0bad7fb 100644 --- a/docs/visualize/overview-infrastructure.md +++ b/docs/visualize/overview-infrastructure.md @@ -53,53 +53,40 @@ See the [War Rooms](https://learn.netdata.cloud/docs/cloud/war-rooms) docs for m ### Configure composite charts to identify problems -Let's say you notice an interesting spike in disk I/O between `14:42:56` and `14:47:08`. Highlight the anomalous area -using `ALT/⌘ + mouse selection`, then zoom in with `SHIFT + mouse selection` to synchronize all composite charts around -this potentially problematic area. +Let's say you notice a sharp decrease in available RAM for applications, as seen in the example screenshot below. In +this situation, you can see when the anomalous behavior began and that it affects the average available and committed +RAM across your infrastructure. However, when _grouped by dimension_, composite charts cannot show whether an anomaly +affects a single node, a subset of nodes, or an entire infrastructure. -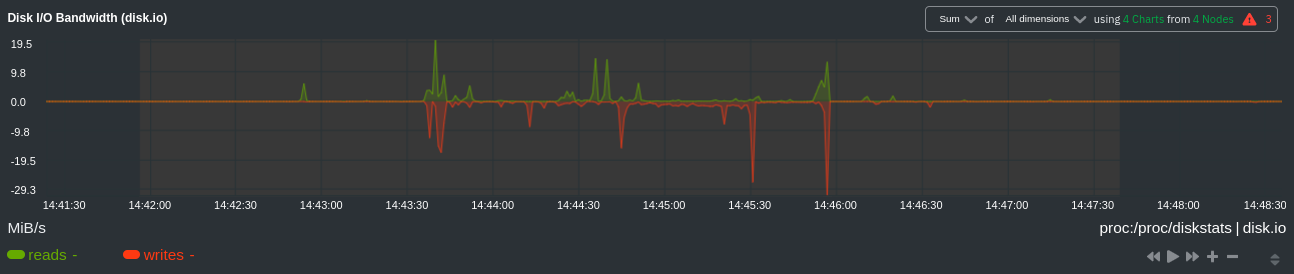 + -By default, the **Disk I/O Bandwidth (disk.io)** composite chart displays the **sum** of all dimensions (`reads` and -`writes`) from all nodes in that War Room. This smart default helps you identify anomalous behavior, but doesn't -necessarily provide the full picture. Let's say you want to understand the severity of disk writes. Use the definition -bar to change the aggregate function to **min** (because the `writes` dimension is on the negative axis), and display -only the `writes` dimension. +Use [_group by node_](https://learn.netdata.cloud/docs/cloud/visualize/overview#group-by-dimension-or-node) to visualize +a single metric across all contributing nodes. If the composite chart has 5 contributing nodes, there will be 5 +lines/areas, one for the most relevant dimension from each node. - + -Because you're now looking at the largest magnitude of change on your infrastructure, you know a single node experienced -31 MiB/s in disk writes. By first using the Overview to gather baseline data, identify anomalies, and use aggregate -functions to your advantage, you've proactively recognized single-node issues using an infrastructure-wide interface. +After grouping by node, it's clear that the `Composite-Charts-01` node is experiencing anomalous behavior and should be +investigated further by jumping to its [single-node dashboard](#drill-down-with-single-node-dashboards) in Netdata +Cloud. -### Drill down to single-node dashboards - -Overview helps you take the investigation further with quick access to single-node dashboards in Netdata Cloud. +### Drill down with single-node dashboards Click on **X Charts** of any composite chart's definition bar to display a dropdown of contributing contexts and nodes contributing. Click on the link icon <img class="img__inline img__inline--link" src="https://user-images.githubusercontent.com/1153921/95762109-1d219300-0c62-11eb-8daa-9ba509a8e71c.png" /> next to a given node to quickly _jump to the same chart in that node's single-node dashboard_ in Netdata Cloud. -) + You can use single-node dashboards in Netdata Cloud to drill down on specific issues, scrub backward in time to investigate historical data, and see like metrics presented meaningfully to help you troubleshoot performance problems. All of the familiar [interactions](/docs/visualize/interact-dashboards-charts.md) are available, as is adding any chart to a [new dashboard](/docs/visualize/create-dashboards.md). -Using the above example, one of the single-node dashboards reveals similar spike in disk I/O. Interestingly enough, it -also shows a maximum disk write of 31 MiB/s at the exact same moment as the composite chart in Overview. - -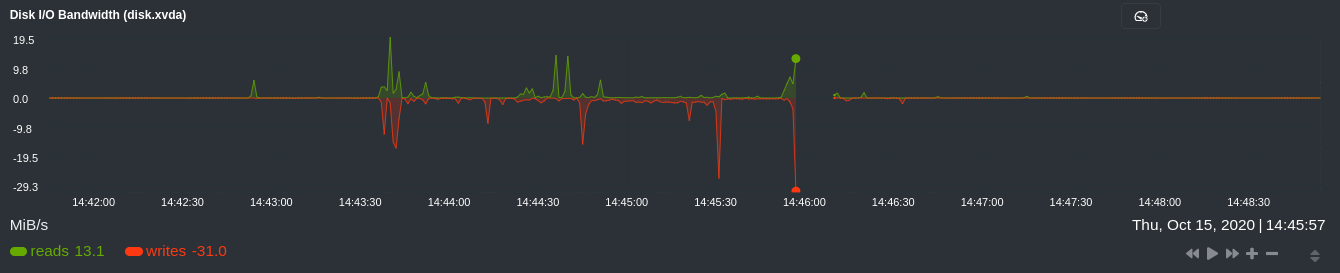 - -You now know that this particular node, during this particular time, experienced anomalous behavior. In this case, the -root cause of the disk I/O spike was due to updating the Netdata Agent itself, which is also the cause of the subsequent -gap in metrics history. - ## Nodes view You can also use the **Nodes view** to monitor the health status and user-configurable key metrics from multiple nodes |