
diff options
Diffstat (limited to 'docs/visualize/interact-dashboards-charts.md')
| -rw-r--r-- | docs/visualize/interact-dashboards-charts.md | 30 |
1 files changed, 27 insertions, 3 deletions
diff --git a/docs/visualize/interact-dashboards-charts.md b/docs/visualize/interact-dashboards-charts.md index d9a3ef6b8b..dd1d10a9af 100644 --- a/docs/visualize/interact-dashboards-charts.md +++ b/docs/visualize/interact-dashboards-charts.md @@ -13,9 +13,6 @@ metrics, and you interact with both of them the same way. > If you're not sure which option is best for you, see our [single-node](/docs/quickstart/single-node.md) and > [infrastructure](/docs/quickstart/infrastructure.md) quickstart guides. - - Netdata dashboards are single, scrollable pages with many charts stacked on top of one another. As you scroll up or down, charts appearing in your browser's viewport automatically load and update every second. @@ -24,6 +21,31 @@ automatically generated based on which [collectors](/docs/collect/how-collectors Netdata starts up. Sections also appear in the right-hand **menu**, along with submenus based on the contexts and families Netdata creates for your node. +## Choose timeframes to visualize + +Both the local Agent dashboard and Netdata Cloud feature time & date pickers to help you visualize specific points in +time. In Netdata Cloud, the picker appears in the [Overview](/docs/visualize/overview-infrastructure.md), [Nodes +view](https://learn.netdata.cloud/docs/cloud/visualize/nodes), [new +dashboards](https://learn.netdata.cloud/docs/cloud/visualize/dashboards), and any single-node dashboards you visit. + +Local Agent dashboard: + +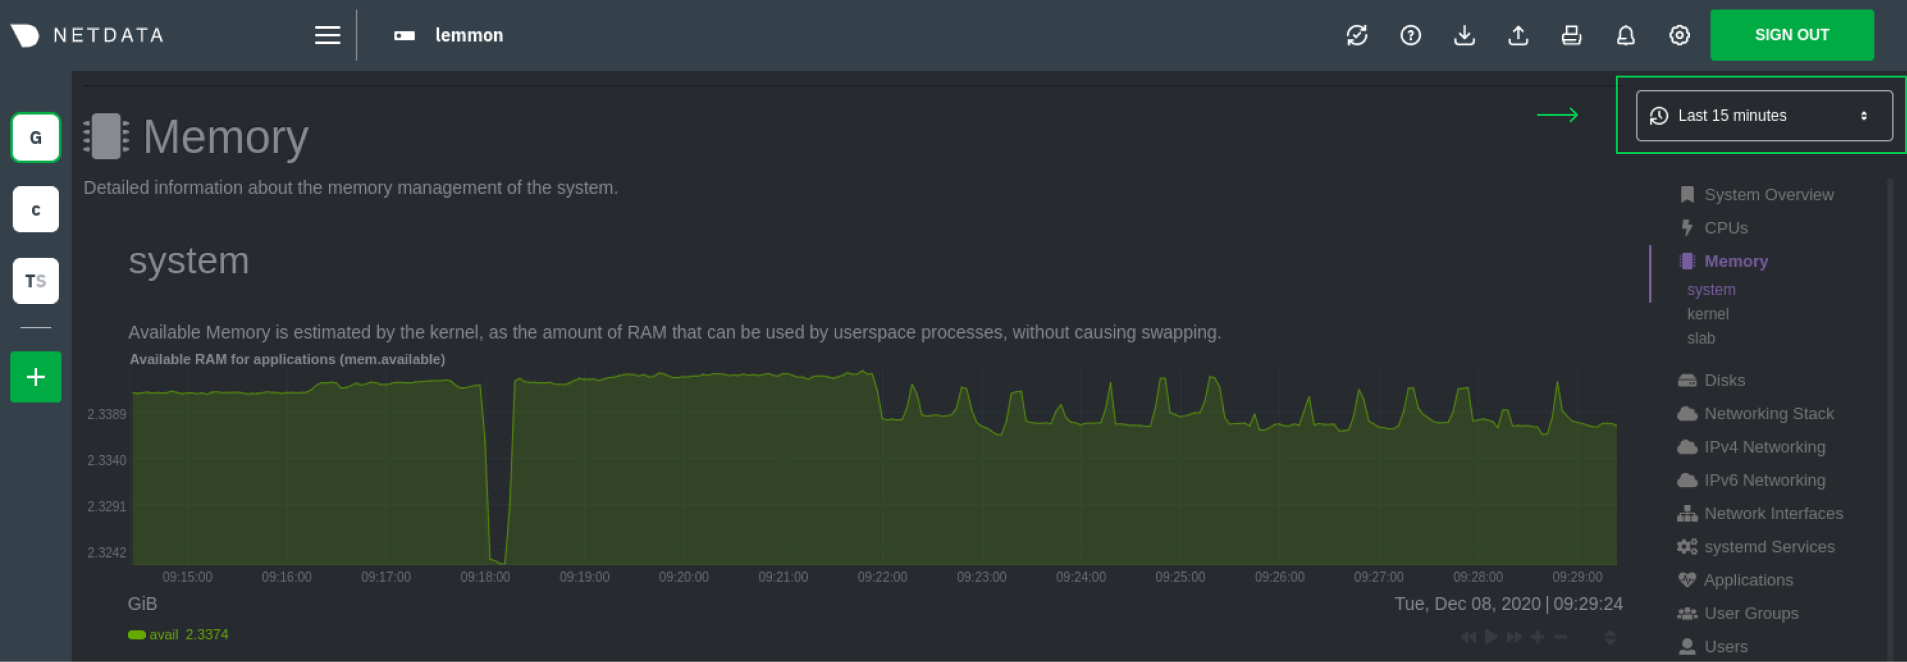 + +Netdata Cloud: + +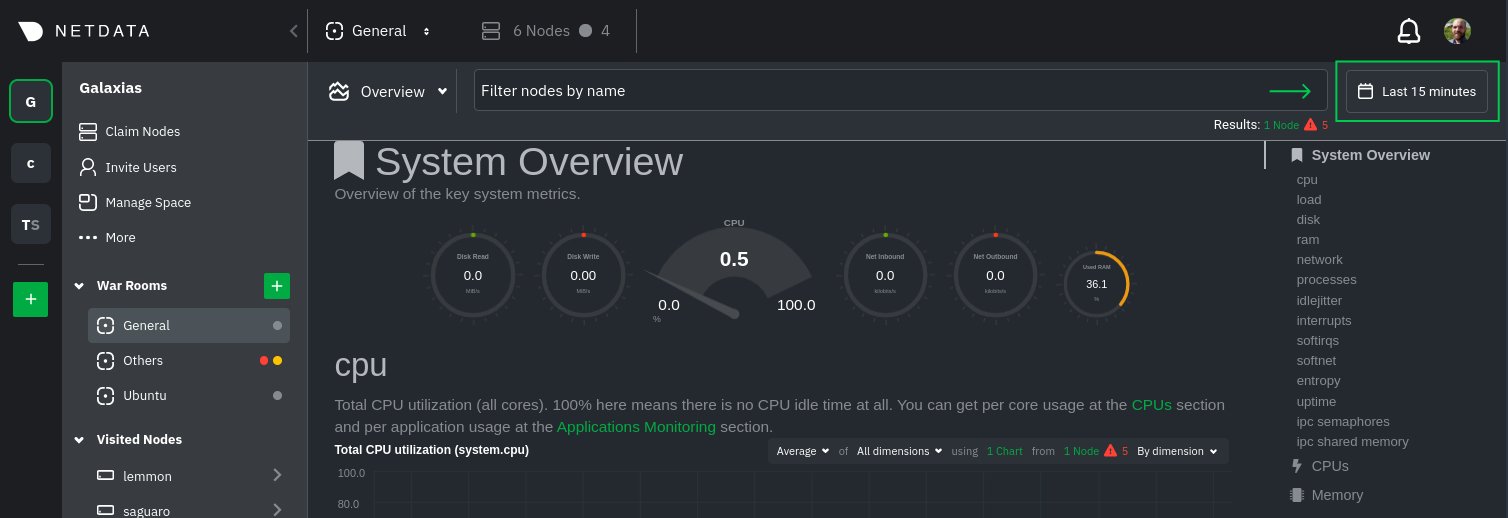 + +Their behavior is identical. Use the Quick Selector to visualize generic timeframes, or use the calendar or inputs to +select days, hours, minutes or seconds. Click **Apply** to re-render all visualizations with new metrics data, or +**Clear** to restore the default timeframe. + +See reference documentation for the [local Agent dashboard](/web/gui/README.md#time--date-picker) and [Netdata +Cloud](https://learn.netdata.cloud/docs/cloud/war-rooms#time--date-picker) for additional context about how the time & +date picker behaves in each environment. + ## Charts, dimensions, families, and contexts A **chart** is an interactive visualization of one or more collected/calculated metrics. You can see the name (also @@ -99,5 +121,7 @@ to get informed when something goes wrong in your infrastructure. - [Netdata Agent · Web dashboards overview](/web/README.md) - [Netdata Cloud · War Rooms](https://learn.netdata.cloud/docs/cloud/war-rooms) - [Netdata Cloud · Overview](https://learn.netdata.cloud/docs/cloud/visualize/overview) +- [Netdata Cloud · Nodes](https://learn.netdata.cloud/docs/cloud/visualize/nodes) +- [Netdata Cloud · Build new dashboards](https://learn.netdata.cloud/docs/cloud/visualize/dashboards) [](<>) |