
diff options
Diffstat (limited to 'docs/developer-and-contributor-corner')
16 files changed, 3106 insertions, 0 deletions
diff --git a/docs/developer-and-contributor-corner/README.md b/docs/developer-and-contributor-corner/README.md new file mode 100644 index 0000000000..d4d86382ac --- /dev/null +++ b/docs/developer-and-contributor-corner/README.md @@ -0,0 +1,3 @@ +# Developer and Contributor Corner + +In this section of our Documentation you will find more advanced information, suited for developers and contributors alike.
\ No newline at end of file diff --git a/docs/developer-and-contributor-corner/build-the-netdata-agent-yourself.md b/docs/developer-and-contributor-corner/build-the-netdata-agent-yourself.md new file mode 100644 index 0000000000..99166ad951 --- /dev/null +++ b/docs/developer-and-contributor-corner/build-the-netdata-agent-yourself.md @@ -0,0 +1,3 @@ +# Build the Netdata Agent yourself + +This section contains documentation on all the ways that you can build the Netdata Agent.
\ No newline at end of file diff --git a/docs/developer-and-contributor-corner/collect-apache-nginx-web-logs.md b/docs/developer-and-contributor-corner/collect-apache-nginx-web-logs.md new file mode 100644 index 0000000000..055219935b --- /dev/null +++ b/docs/developer-and-contributor-corner/collect-apache-nginx-web-logs.md @@ -0,0 +1,112 @@ +# Monitor Nginx or Apache web server log files + +Parsing web server log files with Netdata, revealing the volume of redirects, requests and other metrics, can give you a better overview of your infrastructure. + +Too many bad requests? Maybe a recent deploy missed a few small SVG icons. Too many requests? Time to batten down the hatches—it's a DDoS. + +You can use the [LTSV log format](http://ltsv.org/), track TLS and cipher usage, and the whole parser is faster than +ever. In one test on a system with SSD storage, the collector consistently parsed the logs for 200,000 requests in +200ms, using ~30% of a single core. + +The [web_log](https://github.com/netdata/netdata/blob/master/src/go/collectors/go.d.plugin/modules/weblog/README.md) collector is currently compatible +with [Nginx](https://nginx.org/en/) and [Apache](https://httpd.apache.org/). + +This guide will walk you through using the new Go-based web log collector to turn the logs these web servers +constantly write to into real-time insights into your infrastructure. + +## Set up your web servers + +As with all data sources, Netdata can auto-detect Nginx or Apache servers if you installed them using their standard +installation procedures. + +Almost all web server installations will need _no_ configuration to start collecting metrics. As long as your web server +has readable access log file, you can configure the web log plugin to access and parse it. + +## Custom configuration of the web log collector + +The web log collector's default configuration comes with a few example jobs that should cover most Linux distributions +and their default locations for log files: + +```yaml +# [ JOBS ] +jobs: +# NGINX +# debian, arch + - name: nginx + path: /var/log/nginx/access.log + +# gentoo + - name: nginx + path: /var/log/nginx/localhost.access_log + +# APACHE +# debian + - name: apache + path: /var/log/apache2/access.log + +# gentoo + - name: apache + path: /var/log/apache2/access_log + +# arch + - name: apache + path: /var/log/httpd/access_log + +# debian + - name: apache_vhosts + path: /var/log/apache2/other_vhosts_access.log + +# GUNICORN + - name: gunicorn + path: /var/log/gunicorn/access.log + + - name: gunicorn + path: /var/log/gunicorn/gunicorn-access.log +``` + +However, if your log files were not auto-detected, it might be because they are in a different location. Try the default +`web_log.conf` file. + +```bash +./edit-config go.d/web_log.conf +``` + +To create a new custom configuration, you need to set the `path` parameter to point to your web server's access log +file. You can give it a `name` as well, and set the `log_type` to `auto`. + +```yaml +jobs: + - name: example + path: /path/to/file.log + log_type: auto +``` + +Restart Netdata with `sudo systemctl restart netdata`, or the [appropriate +method](https://github.com/netdata/netdata/blob/master/packaging/installer/README.md#maintaining-a-netdata-agent-installation) for your system. Netdata should pick up your web server's access log and +begin showing real-time charts! + +### Custom log formats and fields + +The web log collector is capable of parsing custom Nginx and Apache log formats and presenting them as charts, but we'll +leave that topic for a separate guide. + +We do have [extensive +documentation](https://github.com/netdata/netdata/blob/master/src/go/collectors/go.d.plugin/modules/weblog/README.md#custom-log-format) on how +to build custom parsing for Nginx and Apache logs. + +## Tweak web log collector alerts + +Over time, we've created some default alerts for web log monitoring. These alerts are designed to work only when your +web server is receiving more than 120 requests per minute. Otherwise, there's simply not enough data to make conclusions +about what is "too few" or "too many." + +- [web log alerts](https://raw.githubusercontent.com/netdata/netdata/master/src/health/health.d/web_log.conf). + +You can also edit this file directly with `edit-config`: + +```bash +./edit-config health.d/weblog.conf +``` + +For more information about editing the defaults or writing new alert entities, see our +[health monitoring documentation](https://github.com/netdata/netdata/blob/master/src/health/README.md). diff --git a/docs/developer-and-contributor-corner/collect-unbound-metrics.md b/docs/developer-and-contributor-corner/collect-unbound-metrics.md new file mode 100644 index 0000000000..5467592a07 --- /dev/null +++ b/docs/developer-and-contributor-corner/collect-unbound-metrics.md @@ -0,0 +1,144 @@ +<!-- +title: "Monitor Unbound DNS servers with Netdata" +sidebar_label: "Monitor Unbound DNS servers with Netdata" +date: 2020-03-31 +custom_edit_url: https://github.com/netdata/netdata/edit/master/docs/guides/collect-unbound-metrics.md +learn_status: "Published" +learn_topic_type: "Tasks" +learn_rel_path: "Miscellaneous" +--> + +# Monitor Unbound DNS servers with Netdata + +[Unbound](https://nlnetlabs.nl/projects/unbound/about/) is a "validating, recursive, caching DNS resolver" from NLNet +Labs. In v1.19 of Netdata, we release a completely refactored collector for collecting real-time metrics from Unbound +servers and displaying them in Netdata dashboards. + +Unbound runs on FreeBSD, OpenBSD, NetBSD, macOS, Linux, and Windows, and supports DNS-over-TLS, which ensures that DNS +queries and answers are all encrypted with TLS. In theory, that should reduce the risk of eavesdropping or +man-in-the-middle attacks when communicating to DNS servers. + +This guide will show you how to collect dozens of essential metrics from your Unbound servers with minimal +configuration. + +## Set up your Unbound installation + +As with all data sources, Netdata can auto-detect Unbound servers if you installed them using the standard installation +procedure. + +Regardless of whether you're connecting to a local or remote Unbound server, you need to be able to access the server's +`remote-control` interface via an IP address, FQDN, or Unix socket. + +To set up the `remote-control` interface, you can use `unbound-control`. First, run `unbound-control-setup` to generate +the TLS key files that will encrypt connections to the remote interface. Then add the following to the end of your +`unbound.conf` configuration file. See the [Unbound +documentation](https://nlnetlabs.nl/documentation/unbound/howto-setup/#setup-remote-control) for more details on using +`unbound-control`, such as how to handle situations when Unbound is run under a unique user. + +```conf +# enable remote-control +remote-control: + control-enable: yes +``` + +Next, make your `unbound.conf`, `unbound_control.key`, and `unbound_control.pem` files readable by Netdata using [access +control lists](https://wiki.archlinux.org/index.php/Access_Control_Lists) (ACL). + +```bash +sudo setfacl -m user:netdata:r unbound.conf +sudo setfacl -m user:netdata:r unbound_control.key +sudo setfacl -m user:netdata:r unbound_control.pem +``` + +Finally, take note whether you're using Unbound in _cumulative_ or _non-cumulative_ mode. This will become relevant when +configuring the collector. + +## Configure the Unbound collector + +You may not need to do any more configuration to have Netdata collect your Unbound metrics. + +If you followed the steps above to enable `remote-control` and make your Unbound files readable by Netdata, that should +be enough. Restart Netdata with `sudo systemctl restart netdata`, or the [appropriate +method](https://github.com/netdata/netdata/blob/master/packaging/installer/README.md#maintaining-a-netdata-agent-installation) for your system. You should see Unbound metrics in your Netdata +dashboard! + + + +If that failed, you will need to manually configure `unbound.conf`. See the next section for details. + +### Manual setup for a local Unbound server + +To configure Netdata's Unbound collector module, navigate to your Netdata configuration directory (typically at +`/etc/netdata/`) and use `edit-config` to initialize and edit your Unbound configuration file. + +```bash +cd /etc/netdata/ # Replace with your Netdata configuration directory, if not /etc/netdata/ +sudo ./edit-config go.d/unbound.conf +``` + +The file contains all the global and job-related parameters. The `name` setting is required, and two Unbound servers +can't have the same name. + +> It is important you know whether your Unbound server is running in cumulative or non-cumulative mode, as a conflict +> between modes will create incorrect charts. + +Here are two examples for local Unbound servers, which may work based on your unique setup: + +```yaml +jobs: + - name: local + address: 127.0.0.1:8953 + cumulative: no + use_tls: yes + tls_skip_verify: yes + tls_cert: /path/to/unbound_control.pem + tls_key: /path/to/unbound_control.key + + - name: local + address: 127.0.0.1:8953 + cumulative: yes + use_tls: no +``` + +Netdata will attempt to read `unbound.conf` to get the appropriate `address`, `cumulative`, `use_tls`, `tls_cert`, and +`tls_key` parameters. + +Restart Netdata with `sudo systemctl restart netdata`, or the [appropriate +method](https://github.com/netdata/netdata/blob/master/packaging/installer/README.md#maintaining-a-netdata-agent-installation) for your system. + +### Manual setup for a remote Unbound server + +Collecting metrics from remote Unbound servers requires manual configuration. There are too many possibilities to cover +all remote connections here, but the [default `unbound.conf` +file](https://github.com/netdata/netdata/blob/master/src/go/collectors/go.d.plugin/config/go.d/unbound.conf) contains a few useful examples: + +```yaml +jobs: + - name: remote + address: 203.0.113.10:8953 + use_tls: no + + - name: remote_cumulative + address: 203.0.113.11:8953 + use_tls: no + cumulative: yes + + - name: remote + address: 203.0.113.10:8953 + cumulative: yes + use_tls: yes + tls_cert: /etc/unbound/unbound_control.pem + tls_key: /etc/unbound/unbound_control.key +``` + +To see all the available options, see the default [unbound.conf +file](https://github.com/netdata/netdata/blob/master/src/go/collectors/go.d.plugin/config/go.d/unbound.conf). + +## What's next? + +Now that you're collecting metrics from your Unbound servers, let us know how it's working for you! There's always room +for improvement or refinement based on real-world use cases. Feel free to [file an +issue](https://github.com/netdata/netdata/issues/new?assignees=&labels=bug%2Cneeds+triage&template=BUG_REPORT.yml) with your +thoughts. + + diff --git a/docs/developer-and-contributor-corner/customize.md b/docs/developer-and-contributor-corner/customize.md new file mode 100644 index 0000000000..6e994f0d8a --- /dev/null +++ b/docs/developer-and-contributor-corner/customize.md @@ -0,0 +1,75 @@ +# Customize the standard dashboard + +> ### Disclaimer +> +> This document is only applicable to the v1 version of the dashboard and doesn't affect the [Netdata Dashboard](https://github.com/netdata/netdata/blob/master/docs/dashboards-and-charts/README.md). + +While the [Netdata dashboard](https://github.com/netdata/netdata/blob/master/src/web/gui/README.md) comes preconfigured with hundreds of charts and +thousands of metrics, you may want to alter your experience based on a particular use case or preferences. + +## Dashboard settings + +To change dashboard settings, click the on the **settings** icon + +in the top panel. + +These settings only affect how the dashboard behaves in your browser. They take effect immediately and are permanently +saved to browser local storage (except the refresh on focus / always option). Some settings are applied immediately, and +others are only reflected after the dashboard is refreshed, which happens automatically. + +Here are a few popular settings: + +### Change chart legend position + +Find this setting under the **Visual** tab. By default, Netdata places the legend of dimensions _below_ charts. +Click this toggle to move the legend to the _right_ of charts. + + +### Change theme + +Find this setting under the **Visual** tab. Choose between Dark (the default) and White. + +## Customize the standard dashboard info + +Netdata stores information about individual charts in the `dashboard_info.js` file. This file includes section and +subsection headings, descriptions, colors, titles, tooltips, and other information for Netdata to render on the +dashboard. + +One common use case for customizing the standard dashboard is adding internal "documentation" a section or specific +chart that can then be read by anyone with access to that dashboard. + +For example, here is how `dashboard_info.js` defines the **System Overview** section. + +```javascript +netdataDashboard.menu = { + 'system': { + title: 'System Overview', + icon: '<i class="fas fa-bookmark"></i>', + info: 'Overview of the key system metrics.' + }, +``` + +If you want to customize this information, use the example `dashboard_info_custom_example.js` as a starting point. +First, navigate to the web server's directory. If you're on a Linux system, this should be at `/usr/share/netdata/web/`. +Copy the example file, then ensure that its permissions match the rest of the web server, which is `netdata:netdata` by +default. + +```bash +cd /usr/share/netdata/web/ +sudo cp dashboard_info_custom_example.js your_dashboard_info_file.js +sudo chown netdata:netdata your_dashboard_info_file.js +``` + +Edit the file with customizations to the `title`, `icon`, and `info` fields. Replace the string after `fas fa-` with any +icon from [Font Awesome](https://fontawesome.com/cheatsheet) to customize the icons that appear throughout the +dashboard. + +Save the file, then navigate to your [Netdata config directory](https://github.com/netdata/netdata/blob/master/docs/netdata-agent/configuration/README.md) to edit `netdata.conf`. Add +the following line to the `[web]` section to tell Netdata where to find your custom configuration. + +```conf +[web] + custom dashboard_info.js = your_dashboard_info_file.js +``` + +Reload your browser tab to see your custom configuration.
\ No newline at end of file diff --git a/docs/developer-and-contributor-corner/kubernetes-k8s-netdata.md b/docs/developer-and-contributor-corner/kubernetes-k8s-netdata.md new file mode 100644 index 0000000000..3f34071dd3 --- /dev/null +++ b/docs/developer-and-contributor-corner/kubernetes-k8s-netdata.md @@ -0,0 +1,237 @@ +# Kubernetes monitoring with Netdata + +This document gives an overview of what visualizations Netdata provides on Kubernetes deployments. + +At Netdata, we've built Kubernetes monitoring tools that add visibility without complexity while also helping you +actively troubleshoot anomalies or outages. This guide walks you through each of the visualizations and offers best +practices on how to use them to start Kubernetes monitoring in a matter of minutes, not hours or days. + +Netdata's Kubernetes monitoring solution uses a handful of [complementary tools and +collectors](#related-reference-documentation) for peeling back the many complex layers of a Kubernetes cluster, +_entirely for free_. These methods work together to give you every metric you need to troubleshoot performance or +availability issues across your Kubernetes infrastructure. + +## Challenge + +While Kubernetes (k8s) might simplify the way you deploy, scale, and load-balance your applications, not all clusters +come with "batteries included" when it comes to monitoring. Doubly so for a monitoring stack that helps you actively +troubleshoot issues with your cluster. + +Some k8s providers, like GKE (Google Kubernetes Engine), do deploy clusters bundled with monitoring capabilities, such +as Google Stackdriver Monitoring. However, these pre-configured solutions might not offer the depth of metrics, +customization, or integration with your preferred alerting methods. + +Without this visibility, it's like you built an entire house and _then_ smashed your way through the finished walls to +add windows. + +## Solution + +In this tutorial, you'll learn how to navigate Netdata's Kubernetes monitoring features, using +[robot-shop](https://github.com/instana/robot-shop) as an example deployment. Deploying robot-shop is purely optional. +You can also follow along with your own Kubernetes deployment if you choose. While the metrics might be different, the +navigation and best practices are the same for every cluster. + +## What you need to get started + +To follow this tutorial, you need: + +- A free Netdata Cloud account. [Sign up](https://app.netdata.cloud/sign-up?cloudRoute=/spaces) if you don't have one + already. +- A working cluster running Kubernetes v1.9 or newer, with a Netdata deployment and connected parent/child nodes. See + our [Kubernetes deployment process](https://github.com/netdata/netdata/blob/master/packaging/installer/methods/kubernetes.md) for details on deployment and + conneting to Cloud. +- The [`kubectl`](https://kubernetes.io/docs/reference/kubectl/overview/) command line tool, within [one minor version + difference](https://kubernetes.io/docs/tasks/tools/install-kubectl/#before-you-begin) of your cluster, on an + administrative system. +- The [Helm package manager](https://helm.sh/) v3.0.0 or newer on the same administrative system. + +### Install the `robot-shop` demo (optional) + +Begin by downloading the robot-shop code and using `helm` to create a new deployment. + +```bash +git clone git@github.com:instana/robot-shop.git +cd robot-shop/K8s/helm +kubectl create ns robot-shop +helm install robot-shop --namespace robot-shop . +``` + +Running `kubectl get pods` shows both the Netdata and robot-shop deployments. + +```bash +kubectl get pods --all-namespaces +NAMESPACE NAME READY STATUS RESTARTS AGE +default netdata-child-29f9c 2/2 Running 0 10m +default netdata-child-8xphf 2/2 Running 0 10m +default netdata-child-jdvds 2/2 Running 0 11m +default netdata-parent-554c755b7d-qzrx4 1/1 Running 0 11m +kube-system aws-node-jnjv8 1/1 Running 0 17m +kube-system aws-node-svzdb 1/1 Running 0 17m +kube-system aws-node-ts6n2 1/1 Running 0 17m +kube-system coredns-559b5db75d-f58hp 1/1 Running 0 22h +kube-system coredns-559b5db75d-tkzj2 1/1 Running 0 22h +kube-system kube-proxy-9p9cd 1/1 Running 0 17m +kube-system kube-proxy-lt9ss 1/1 Running 0 17m +kube-system kube-proxy-n75t9 1/1 Running 0 17m +robot-shop cart-b4bbc8fff-t57js 1/1 Running 0 14m +robot-shop catalogue-8b5f66c98-mr85z 1/1 Running 0 14m +robot-shop dispatch-67d955c7d8-lnr44 1/1 Running 0 14m +robot-shop mongodb-7f65d86c-dsslc 1/1 Running 0 14m +robot-shop mysql-764c4c5fc7-kkbnf 1/1 Running 0 14m +robot-shop payment-67c87cb7d-5krxv 1/1 Running 0 14m +robot-shop rabbitmq-5bb66bb6c9-6xr5b 1/1 Running 0 14m +robot-shop ratings-94fd9c75b-42wvh 1/1 Running 0 14m +robot-shop redis-0 0/1 Pending 0 14m +robot-shop shipping-7d69cb88b-w7hpj 1/1 Running 0 14m +robot-shop user-79c445b44b-hwnm9 1/1 Running 0 14m +robot-shop web-8bb887476-lkcjx 1/1 Running 0 14m +``` + +## Explore Netdata's Kubernetes monitoring charts + +The Netdata Helm chart deploys and enables everything you need for monitoring Kubernetes on every layer. Once you deploy +Netdata and connect your cluster's nodes, you're ready to check out the visualizations **with zero configuration**. + +To get started, [sign in](https://app.netdata.cloud/sign-in?cloudRoute=/spaces) to your Netdata Cloud account. Head over +to the War Room you connected your cluster to, if not **General**. + +Let's walk through monitoring each layer of a Kubernetes cluster using the Overview as our framework. + +## Cluster and node metrics + +The gauges and time-series charts you see right away in the Overview show aggregated metrics from every node in your +cluster. + +For example, the `apps.cpu` chart (in the **Applications** menu item), visualizes the CPU utilization of various +applications/services running on each of the nodes in your cluster. The **X Nodes** dropdown shows which nodes +contribute to the chart and links to jump a single-node dashboard for further investigation. + +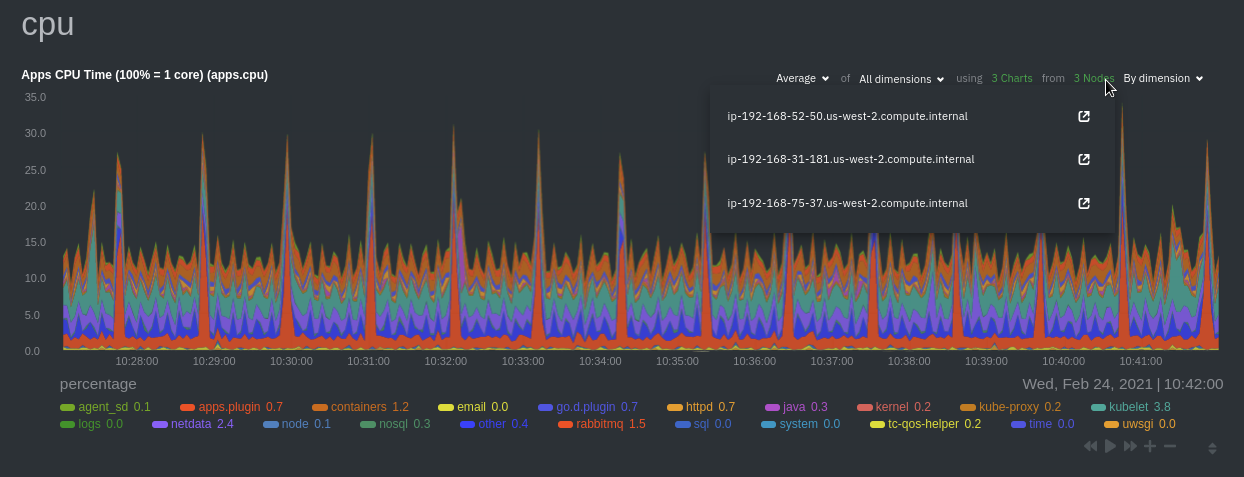 + +For example, the chart above shows a spike in the CPU utilization from `rabbitmq` every minute or so, along with a +baseline CPU utilization of 10-15% across the cluster. + + +## Pod and container metrics + +Click on the **Kubernetes xxxxxxx...** section to jump down to Netdata Cloud's unique Kubernetes visualizations for view +real-time resource utilization metrics from your Kubernetes pods and containers. + +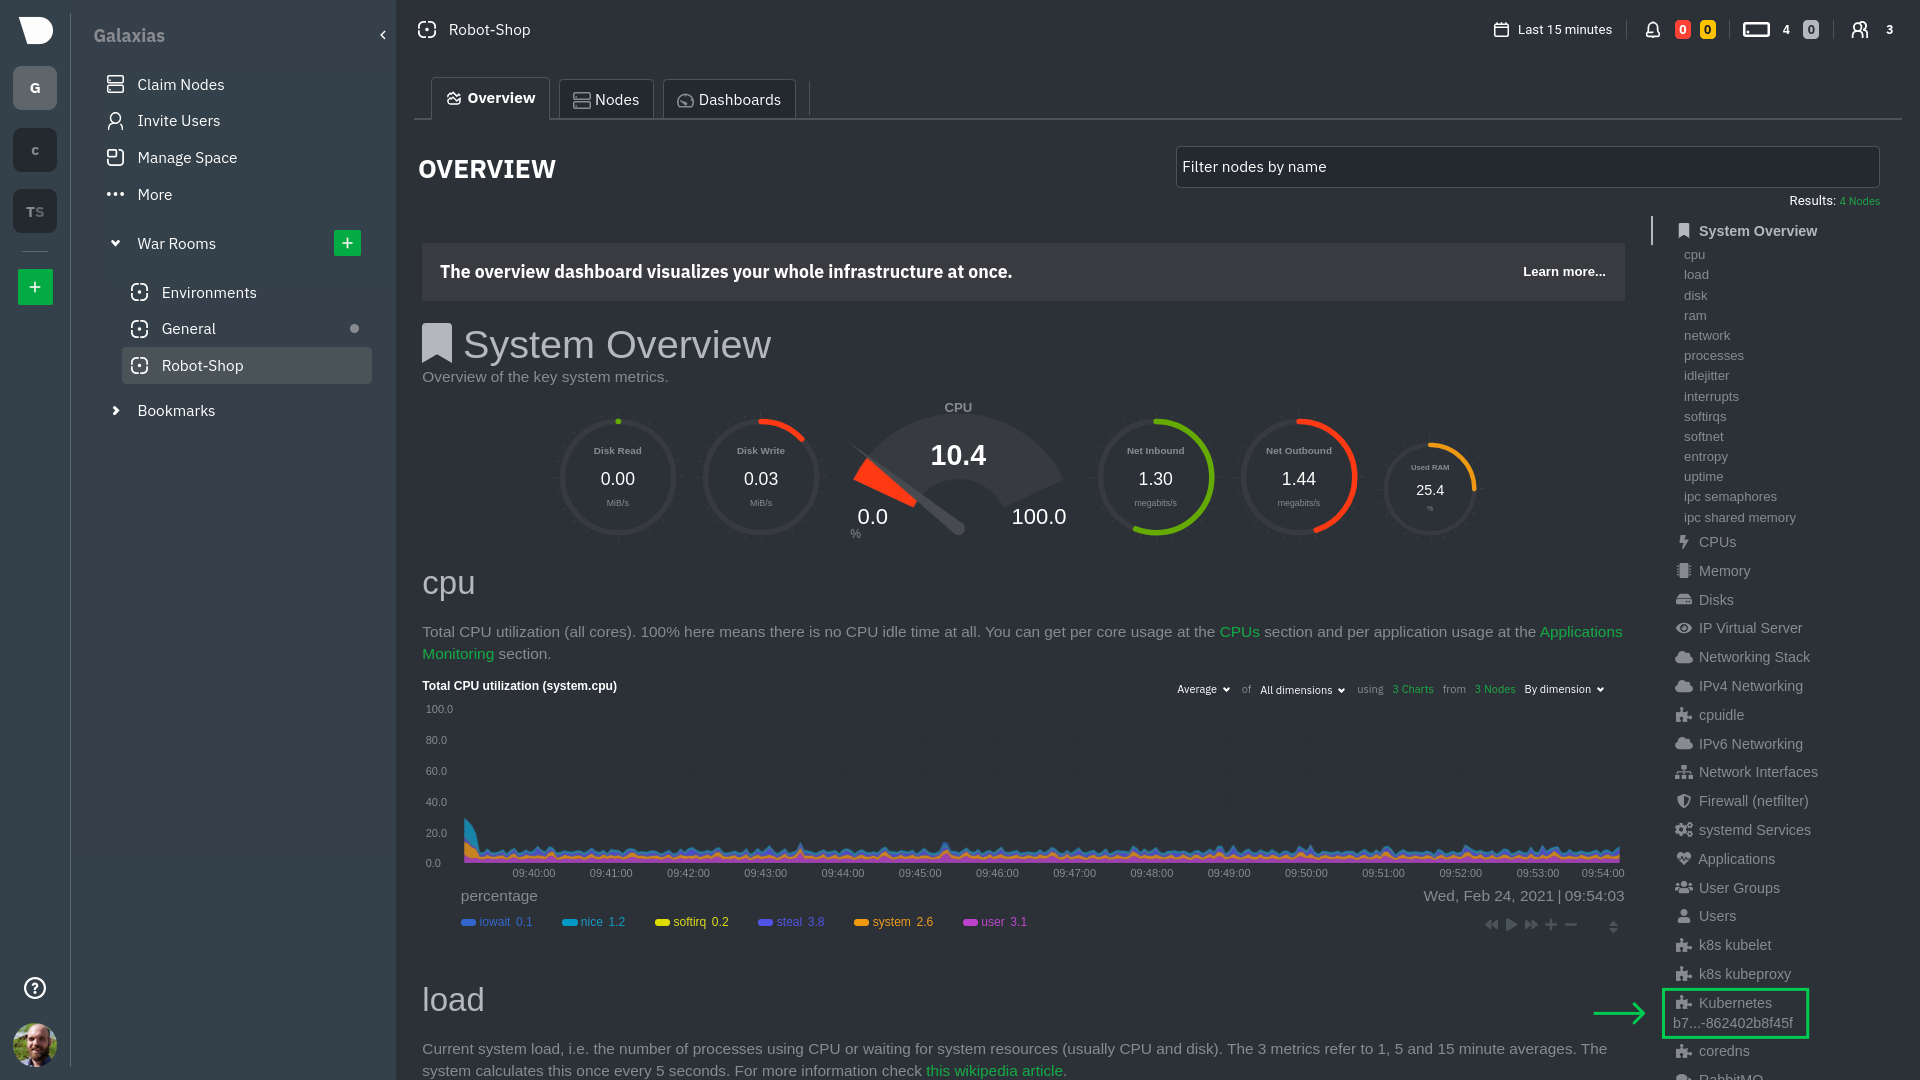 + +### Health map + +The first visualization is the [health map](https://github.com/netdata/netdata/blob/master/docs/dashboards-and-charts/kubernetes-tab.md#health-map), +which places each container into its own box, then varies the intensity of their color to visualize the resource +utilization. By default, the health map shows the **average CPU utilization as a percentage of the configured limit** +for every container in your cluster. + +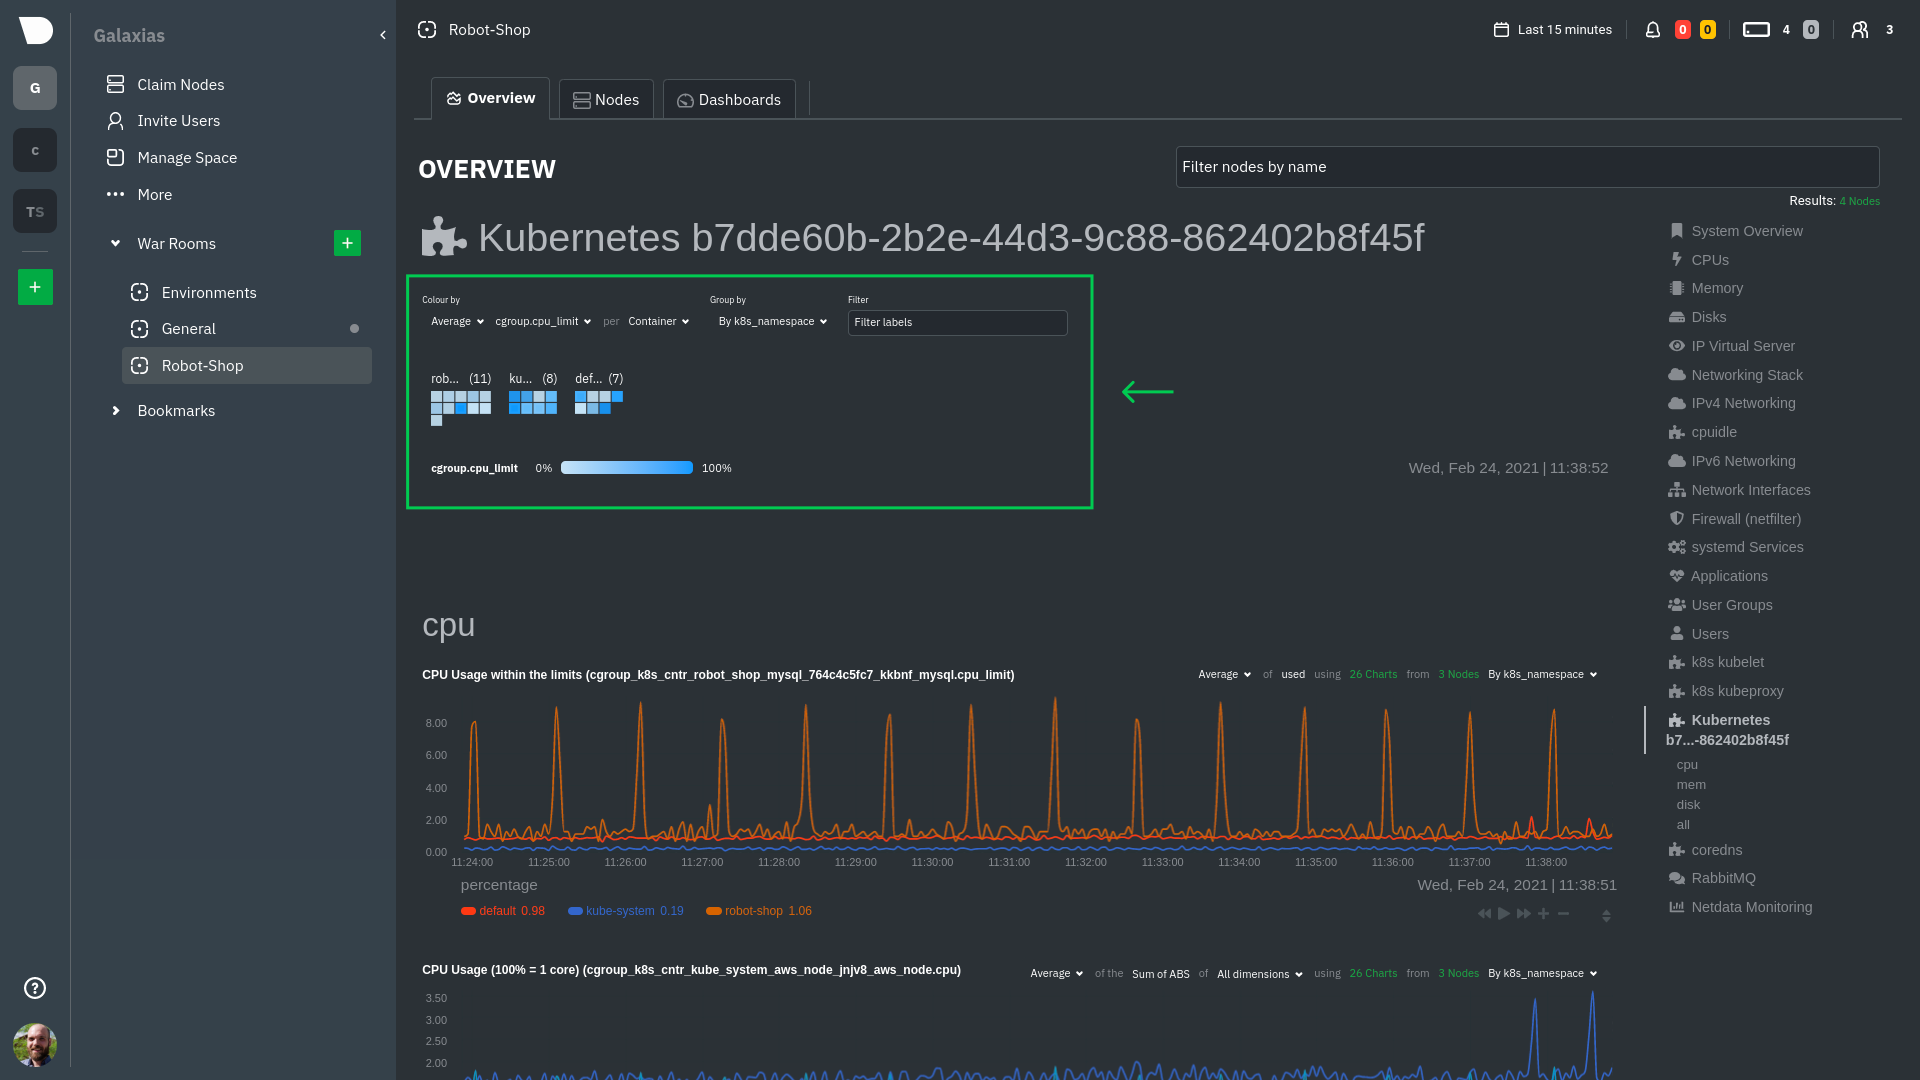 + +Let's explore the most colorful box by hovering over it. + +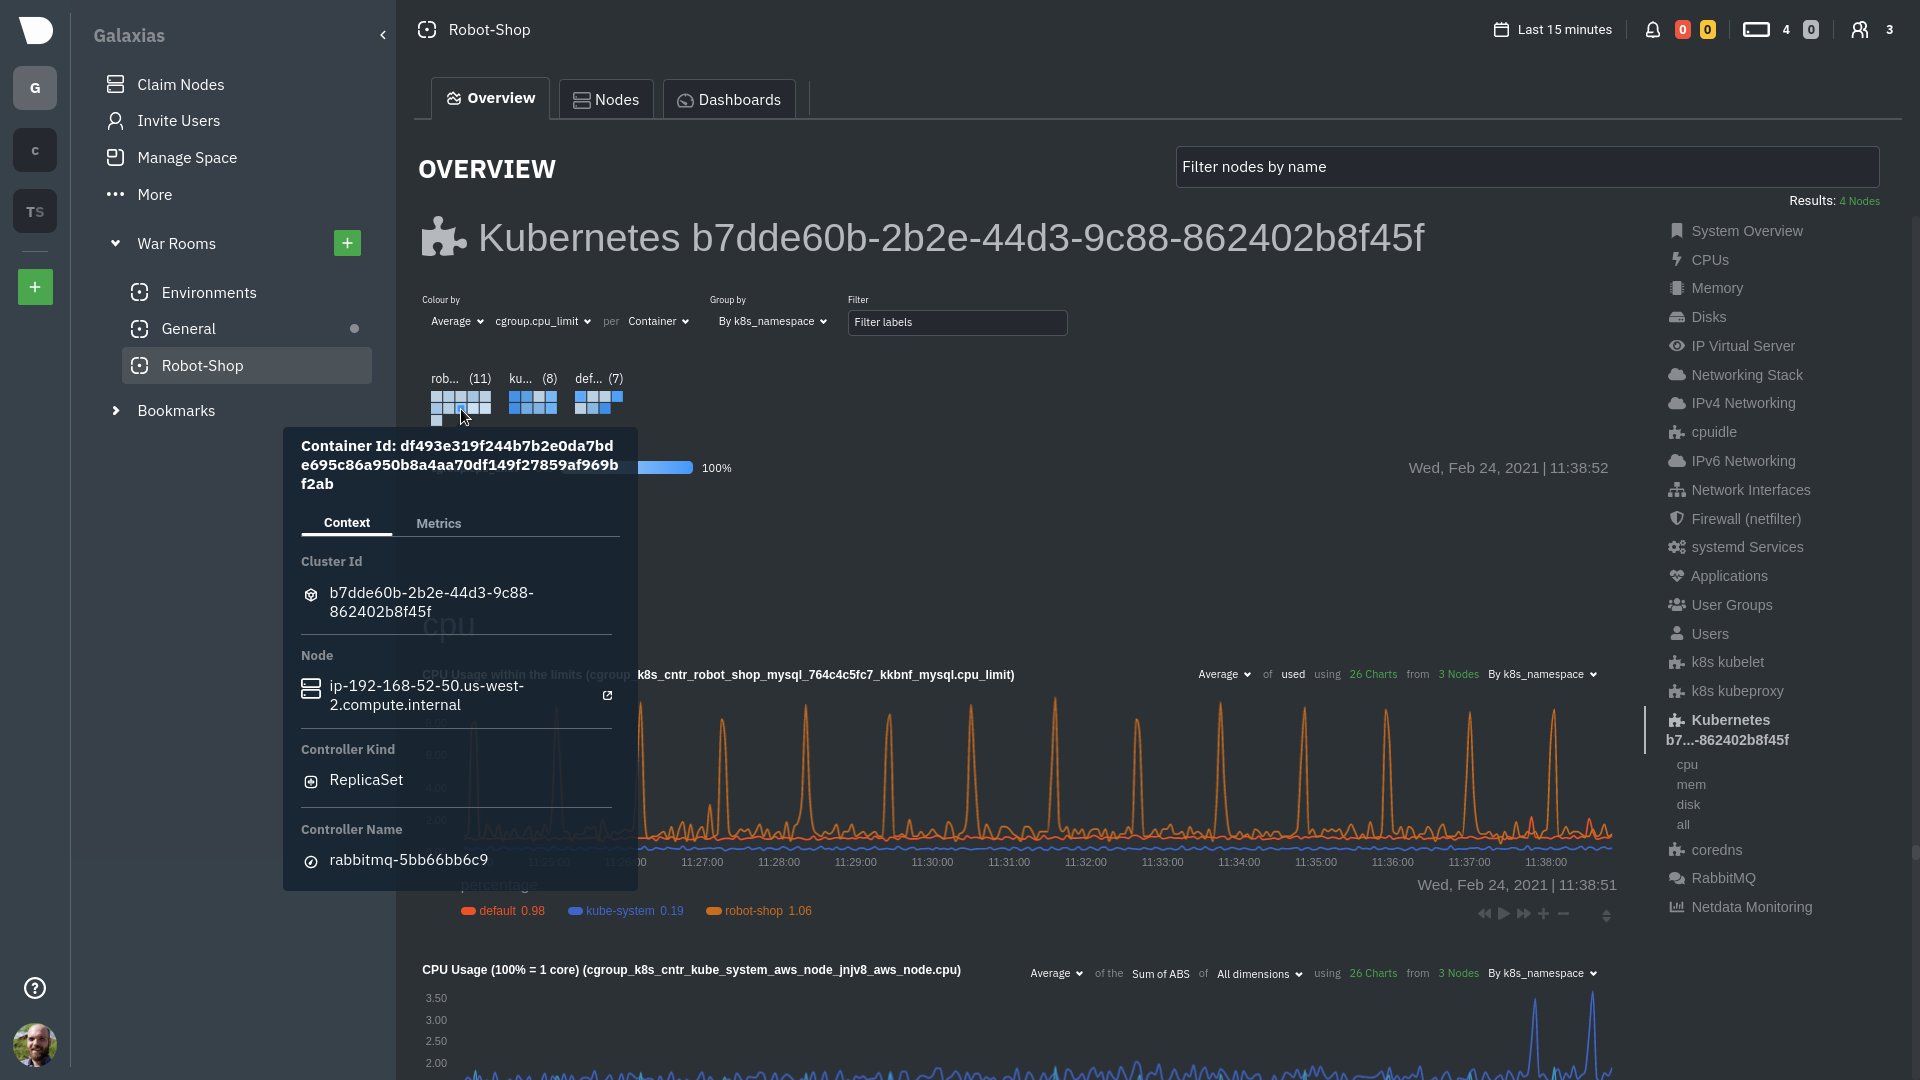 + +The **Context** tab shows `rabbitmq-5bb66bb6c9-6xr5b` as the container's image name, which means this container is +running a [RabbitMQ](https://github.com/netdata/netdata/blob/master/src/go/collectors/go.d.plugin/modules/rabbitmq/README.md) workload. + +Click the **Metrics** tab to see real-time metrics from that container. Unsurprisingly, it shows a spike in CPU +utilization at regular intervals. + +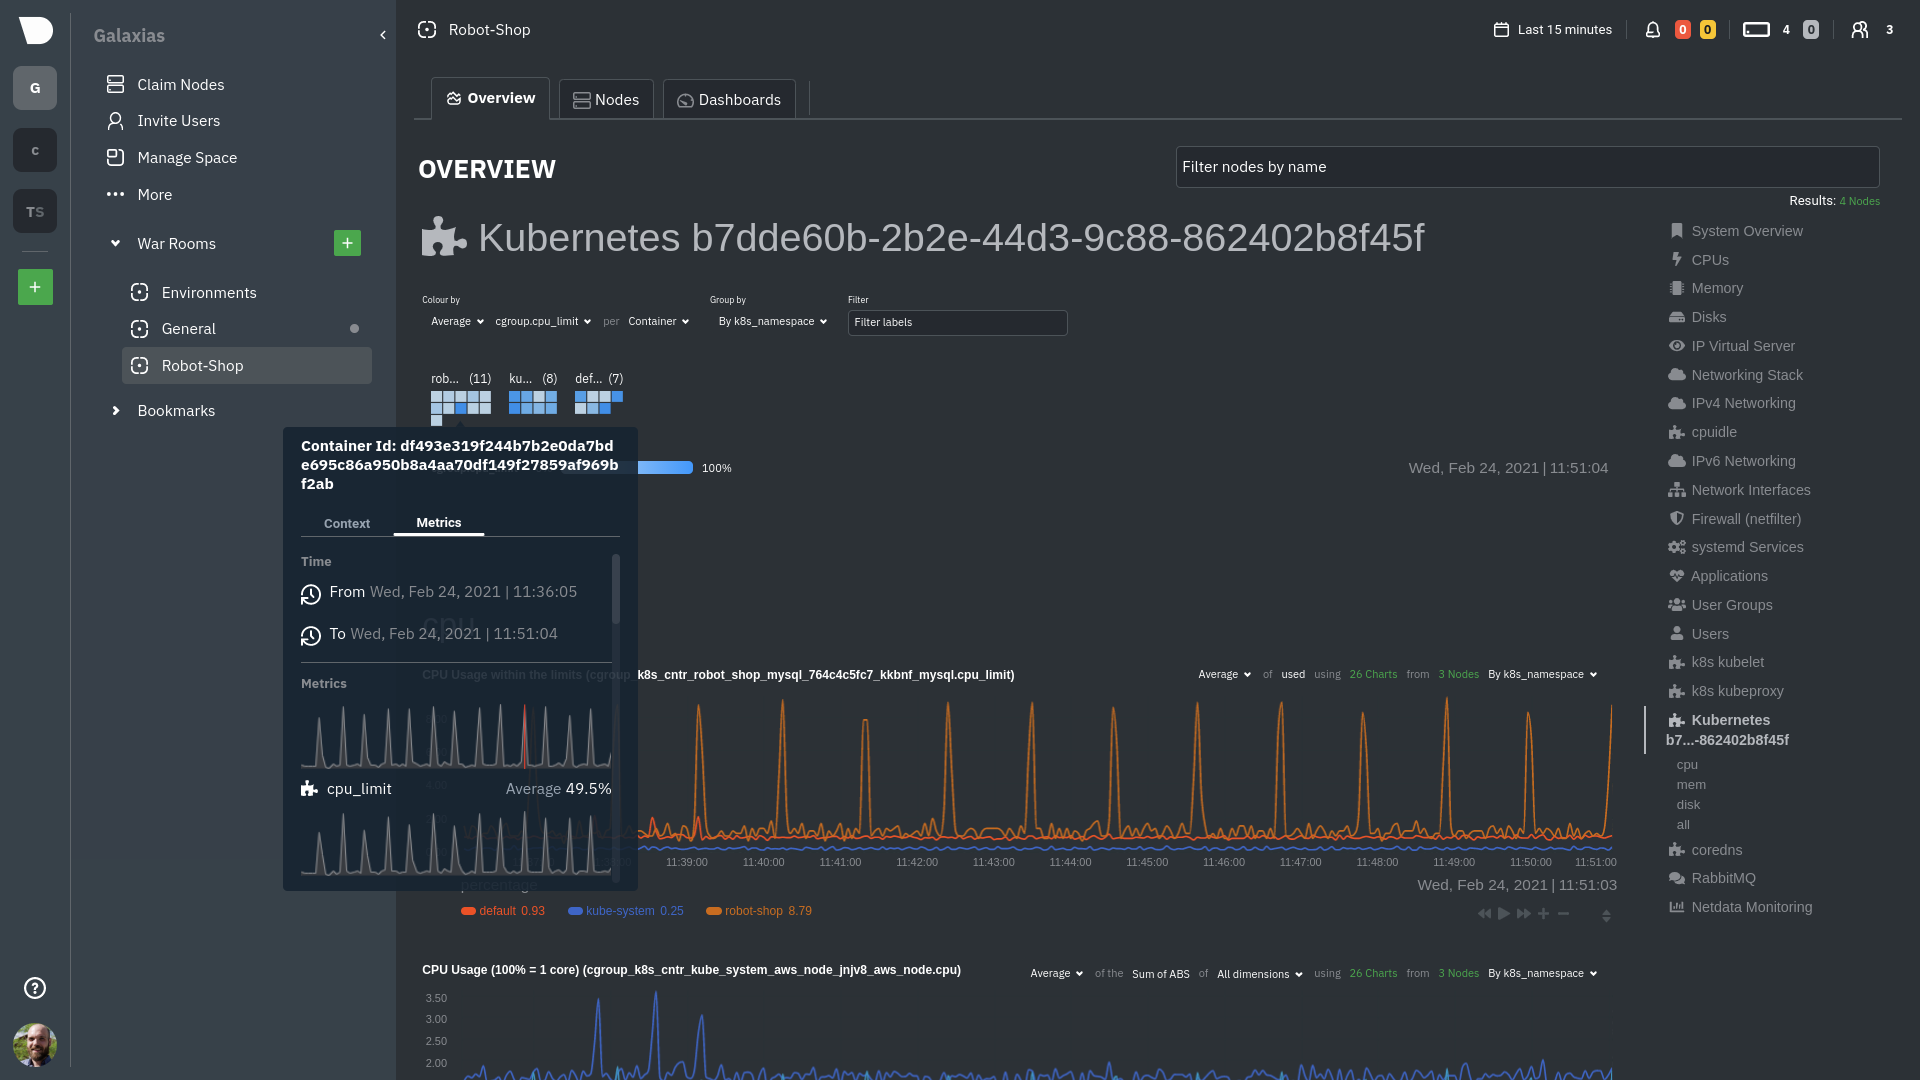 + +### Time-series charts + +Beneath the health map is a variety of time-series charts that help you visualize resource utilization over time, which +is useful for targeted troubleshooting. + +The default is to display metrics grouped by the `k8s_namespace` label, which shows resource utilization based on your +different namespaces. + + + +Each composite chart has a [definition bar](https://github.com/netdata/netdata/blob/master/docs/dashboards-and-charts/netdata-charts.md#definition-bar) +for complete customization. For example, grouping the top chart by `k8s_container_name` reveals new information. + + + +## Service metrics + +Netdata has a [service discovery plugin](https://github.com/netdata/agent-service-discovery), which discovers and +creates configuration files for [compatible +services](https://github.com/netdata/helmchart#service-discovery-and-supported-services) and any endpoints covered by +our [generic Prometheus collector](https://github.com/netdata/netdata/blob/master/src/go/collectors/go.d.plugin/modules/prometheus/README.md). +Netdata uses these files to collect metrics from any compatible application as they run _inside_ of a pod. Service +discovery happens without manual intervention as pods are created, destroyed, or moved between nodes. + +Service metrics show up on the Overview as well, beneath the **Kubernetes** section, and are labeled according to the +service in question. For example, the **RabbitMQ** section has numerous charts from the [`rabbitmq` +collector](https://github.com/netdata/netdata/blob/master/src/go/collectors/go.d.plugin/modules/rabbitmq/README.md): + + + +> The robot-shop cluster has more supported services, such as MySQL, which are not visible with zero configuration. This +> is usually because of services running on non-default ports, using non-default names, or required passwords. Read up +> on [configuring service discovery](https://github.com/netdata/netdata/blob/master/packaging/installer/methods/kubernetes.md#configure-service-discovery) to collect +> more service metrics. + +Service metrics are essential to infrastructure monitoring, as they're the best indicator of the end-user experience, +and key signals for troubleshooting anomalies or issues. + +## Kubernetes components + +Netdata also automatically collects metrics from two essential Kubernetes processes. + +### kubelet + +The **k8s kubelet** section visualizes metrics from the Kubernetes agent responsible for managing every pod on a given +node. This also happens without any configuration thanks to the [kubelet +collector](https://github.com/netdata/netdata/blob/master/src/go/collectors/go.d.plugin/modules/k8s_kubelet/README.md). + +Monitoring each node's kubelet can be invaluable when diagnosing issues with your Kubernetes cluster. For example, you +can see if the number of running containers/pods has dropped, which could signal a fault or crash in a particular +Kubernetes service or deployment (see `kubectl get services` or `kubectl get deployments` for more details). If the +number of pods increases, it may be because of something more benign, like another team member scaling up a +service with `kubectl scale`. + +You can also view charts for the Kubelet API server, the volume of runtime/Docker operations by type, +configuration-related errors, and the actual vs. desired numbers of volumes, plus a lot more. + +### kube-proxy + +The **k8s kube-proxy** section displays metrics about the network proxy that runs on each node in your Kubernetes +cluster. kube-proxy lets pods communicate with each other and accept sessions from outside your cluster. Its metrics are +collected by the [kube-proxy +collector](https://github.com/netdata/netdata/blob/master/src/go/collectors/go.d.plugin/modules/k8s_kubeproxy/README.md). + +With Netdata, you can monitor how often your k8s proxies are syncing proxy rules between nodes. Dramatic changes in +these figures could indicate an anomaly in your cluster that's worthy of further investigation. + +## What's next? + +After reading this guide, you should now be able to monitor any Kubernetes cluster with Netdata, including nodes, pods, +containers, services, and more. + +With the health map, time-series charts, and the ability to drill down into individual nodes, you can see hundreds of +per-second metrics with zero configuration and less time remembering all the `kubectl` options. Netdata moves with your +cluster, automatically picking up new nodes or services as your infrastructure scales. And it's entirely free for +clusters of all sizes. + +### Related reference documentation + +- [Netdata Helm chart](https://github.com/netdata/helmchart) +- [Netdata service discovery](https://github.com/netdata/agent-service-discovery) +- [Netdata Agent · `kubelet` + collector](https://github.com/netdata/netdata/blob/master/src/go/collectors/go.d.plugin/modules/k8s_kubelet/README.md) +- [Netdata Agent · `kube-proxy` + collector](https://github.com/netdata/netdata/blob/master/src/go/collectors/go.d.plugin/modules/k8s_kubeproxy/README.md) +- [Netdata Agent · `cgroups.plugin`](https://github.com/netdata/netdata/blob/master/src/collectors/cgroups.plugin/README.md) + + diff --git a/docs/developer-and-contributor-corner/lamp-stack.md b/docs/developer-and-contributor-corner/lamp-stack.md new file mode 100644 index 0000000000..aa11a749e4 --- /dev/null +++ b/docs/developer-and-contributor-corner/lamp-stack.md @@ -0,0 +1,238 @@ +import { OneLineInstallWget } from '@site/src/components/OneLineInstall/' + +# LAMP stack monitoring with Netdata + +Set up robust LAMP stack monitoring (Linux, Apache, MySQL, PHP) in a few minutes using Netdata. + +The LAMP stack is the "hello world" for deploying dynamic web applications. It's fast, flexible, and reliable, which +means a developer or sysadmin won't go far in their career without interacting with the stack and its services. + +_LAMP_ is an acronym of the core services that make up the web application: **L**inux, **A**pache, **M**ySQL, and +**P**HP. + +- [Linux](https://en.wikipedia.org/wiki/Linux) is the operating system running the whole stack. +- [Apache](https://httpd.apache.org/) is a web server that responds to HTTP requests from users and returns web pages. +- [MySQL](https://www.mysql.com/) is a database that stores and returns information based on queries from the web + application. +- [PHP](https://www.php.net/) is a scripting language used to query the MySQL database and build new pages. + +LAMP stacks are the foundation for tons of end-user applications, with [Wordpress](https://wordpress.org/) being the +most popular. + +## Challenge + +You've already deployed a LAMP stack, either in testing or production. You want to monitor every service's performance +and availability to ensure the best possible experience for your end-users. You might also be particularly interested in +using a free, open-source monitoring tool. + +Depending on your monitoring experience, you may not even know what metrics you're looking for, much less how to build +dashboards using a query language. You need a robust monitoring experience that has the metrics you need without a ton +of required setup. + +## Solution + +In this tutorial, you'll set up robust LAMP stack monitoring with Netdata in just a few minutes. When you're done, +you'll have one dashboard to monitor every part of your web application, including each essential LAMP stack service. + +This dashboard updates every second with new metrics, and pairs those metrics up with preconfigured alerts to keep you +informed of any errors or odd behavior. + +## What you need to get started + +To follow this tutorial, you need: + +- A physical or virtual Linux system, which we'll call a _node_. +- A functional LAMP stack. There's plenty of tutorials for installing a LAMP stack, like [this + one](https://www.digitalocean.com/community/tutorials/how-to-install-linux-apache-mysql-php-lamp-stack-ubuntu-18-04) + from Digital Ocean. +- Optionally, a [Netdata Cloud](https://app.netdata.cloud/sign-up?cloudRoute=/spaces) account, which you can use to view + metrics from multiple nodes in one dashboard, and a whole lot more, for free. + +## Install the Netdata Agent + +If you don't have the free, open-source Netdata monitoring agent installed on your node yet, get started with a [single +kickstart command](https://github.com/netdata/netdata/blob/master/packaging/installer/README.md): + +<OneLineInstallWget/> + +The Netdata Agent is now collecting metrics from your node every second. You don't need to jump into the dashboard yet, +but if you're curious, open your favorite browser and navigate to `http://localhost:19999` or `http://NODE:19999`, +replacing `NODE` with the hostname or IP address of your system. + |