
diff options
Diffstat (limited to 'docs/cloud/alerts-configuration-manager.md')
| -rw-r--r-- | docs/cloud/alerts-configuration-manager.md | 86 |
1 files changed, 30 insertions, 56 deletions
diff --git a/docs/cloud/alerts-configuration-manager.md b/docs/cloud/alerts-configuration-manager.md index cedae0eb47..620764c188 100644 --- a/docs/cloud/alerts-configuration-manager.md +++ b/docs/cloud/alerts-configuration-manager.md @@ -1,71 +1,45 @@ # Creating Alerts with Netdata Alerts Configuration Manager -The Netdata Alerts Configuration Manager enables users with [Business subscriptions](https://www.netdata.cloud/pricing/) to create alerts from the Netdata Dashboard with an intuitive user interface. +The Netdata Alerts Configuration Manager enables subscribers to easily set up alerts directly from the Netdata Dashboard. More details on subscriptions can be found [here](https://www.netdata.cloud/pricing/). -## Using Alerts Configuration Manager - -1. Go to the **Metrics** tab and navigate to the chart you want to configure an alert for. - -2. Click the **Alert icon** on the top right corner of the chart. - <!--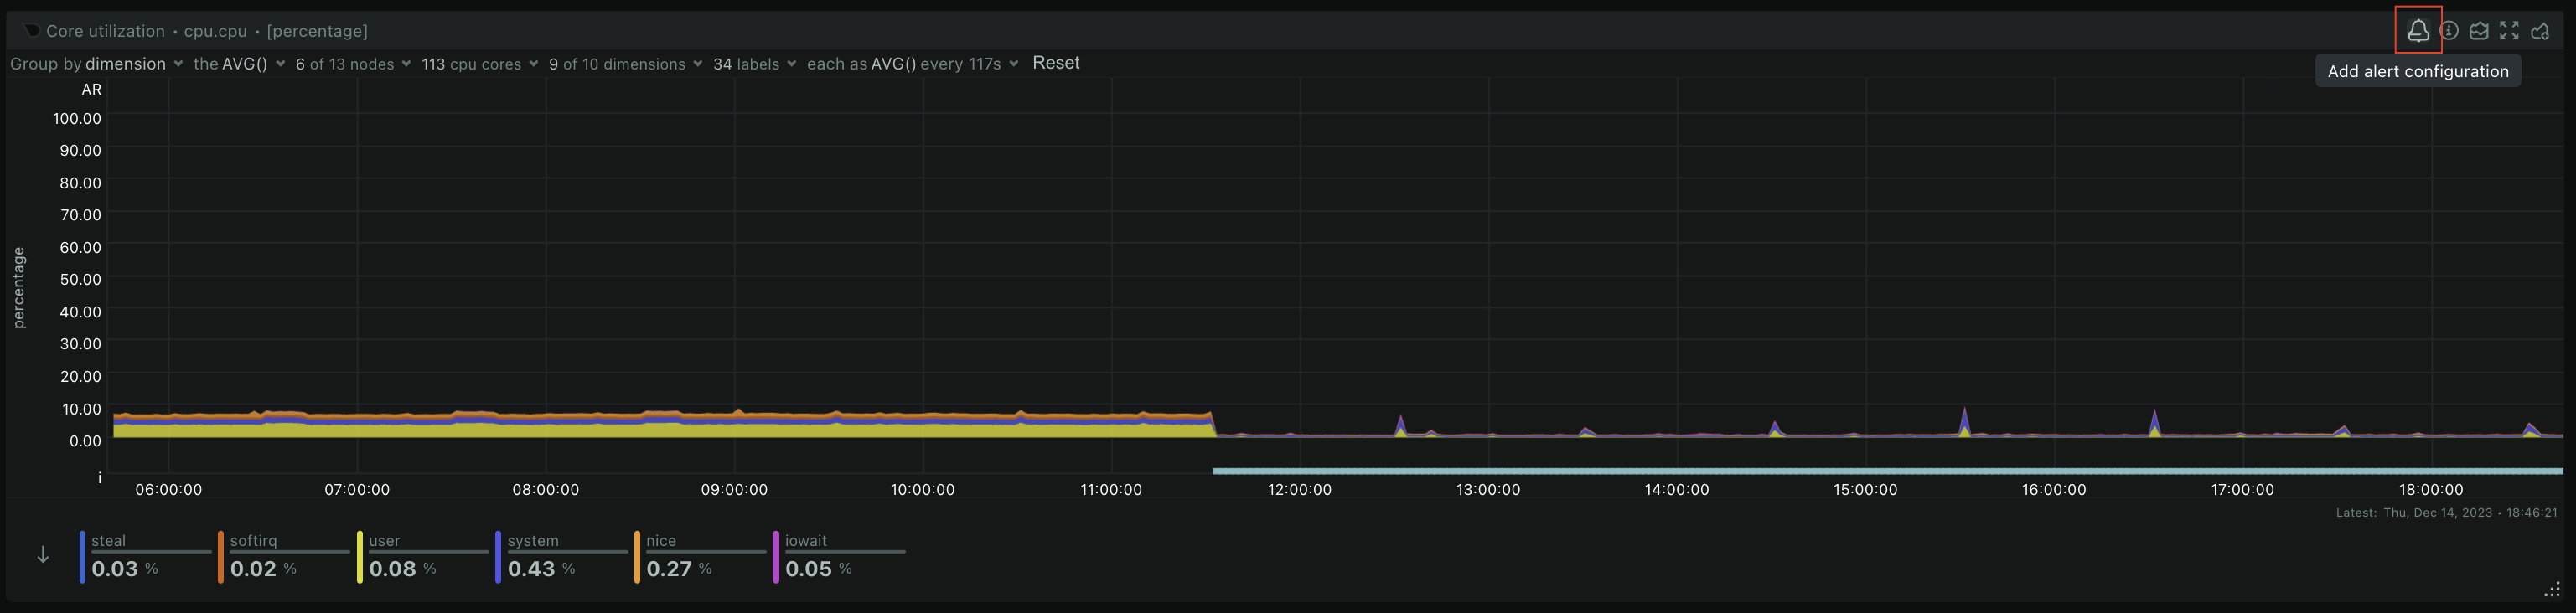--> - -3. The Alert Configuration Manager will open up with the default thresholds. You can modify the configuration as required and the alert definition on the right will be updated dynamically. - <!--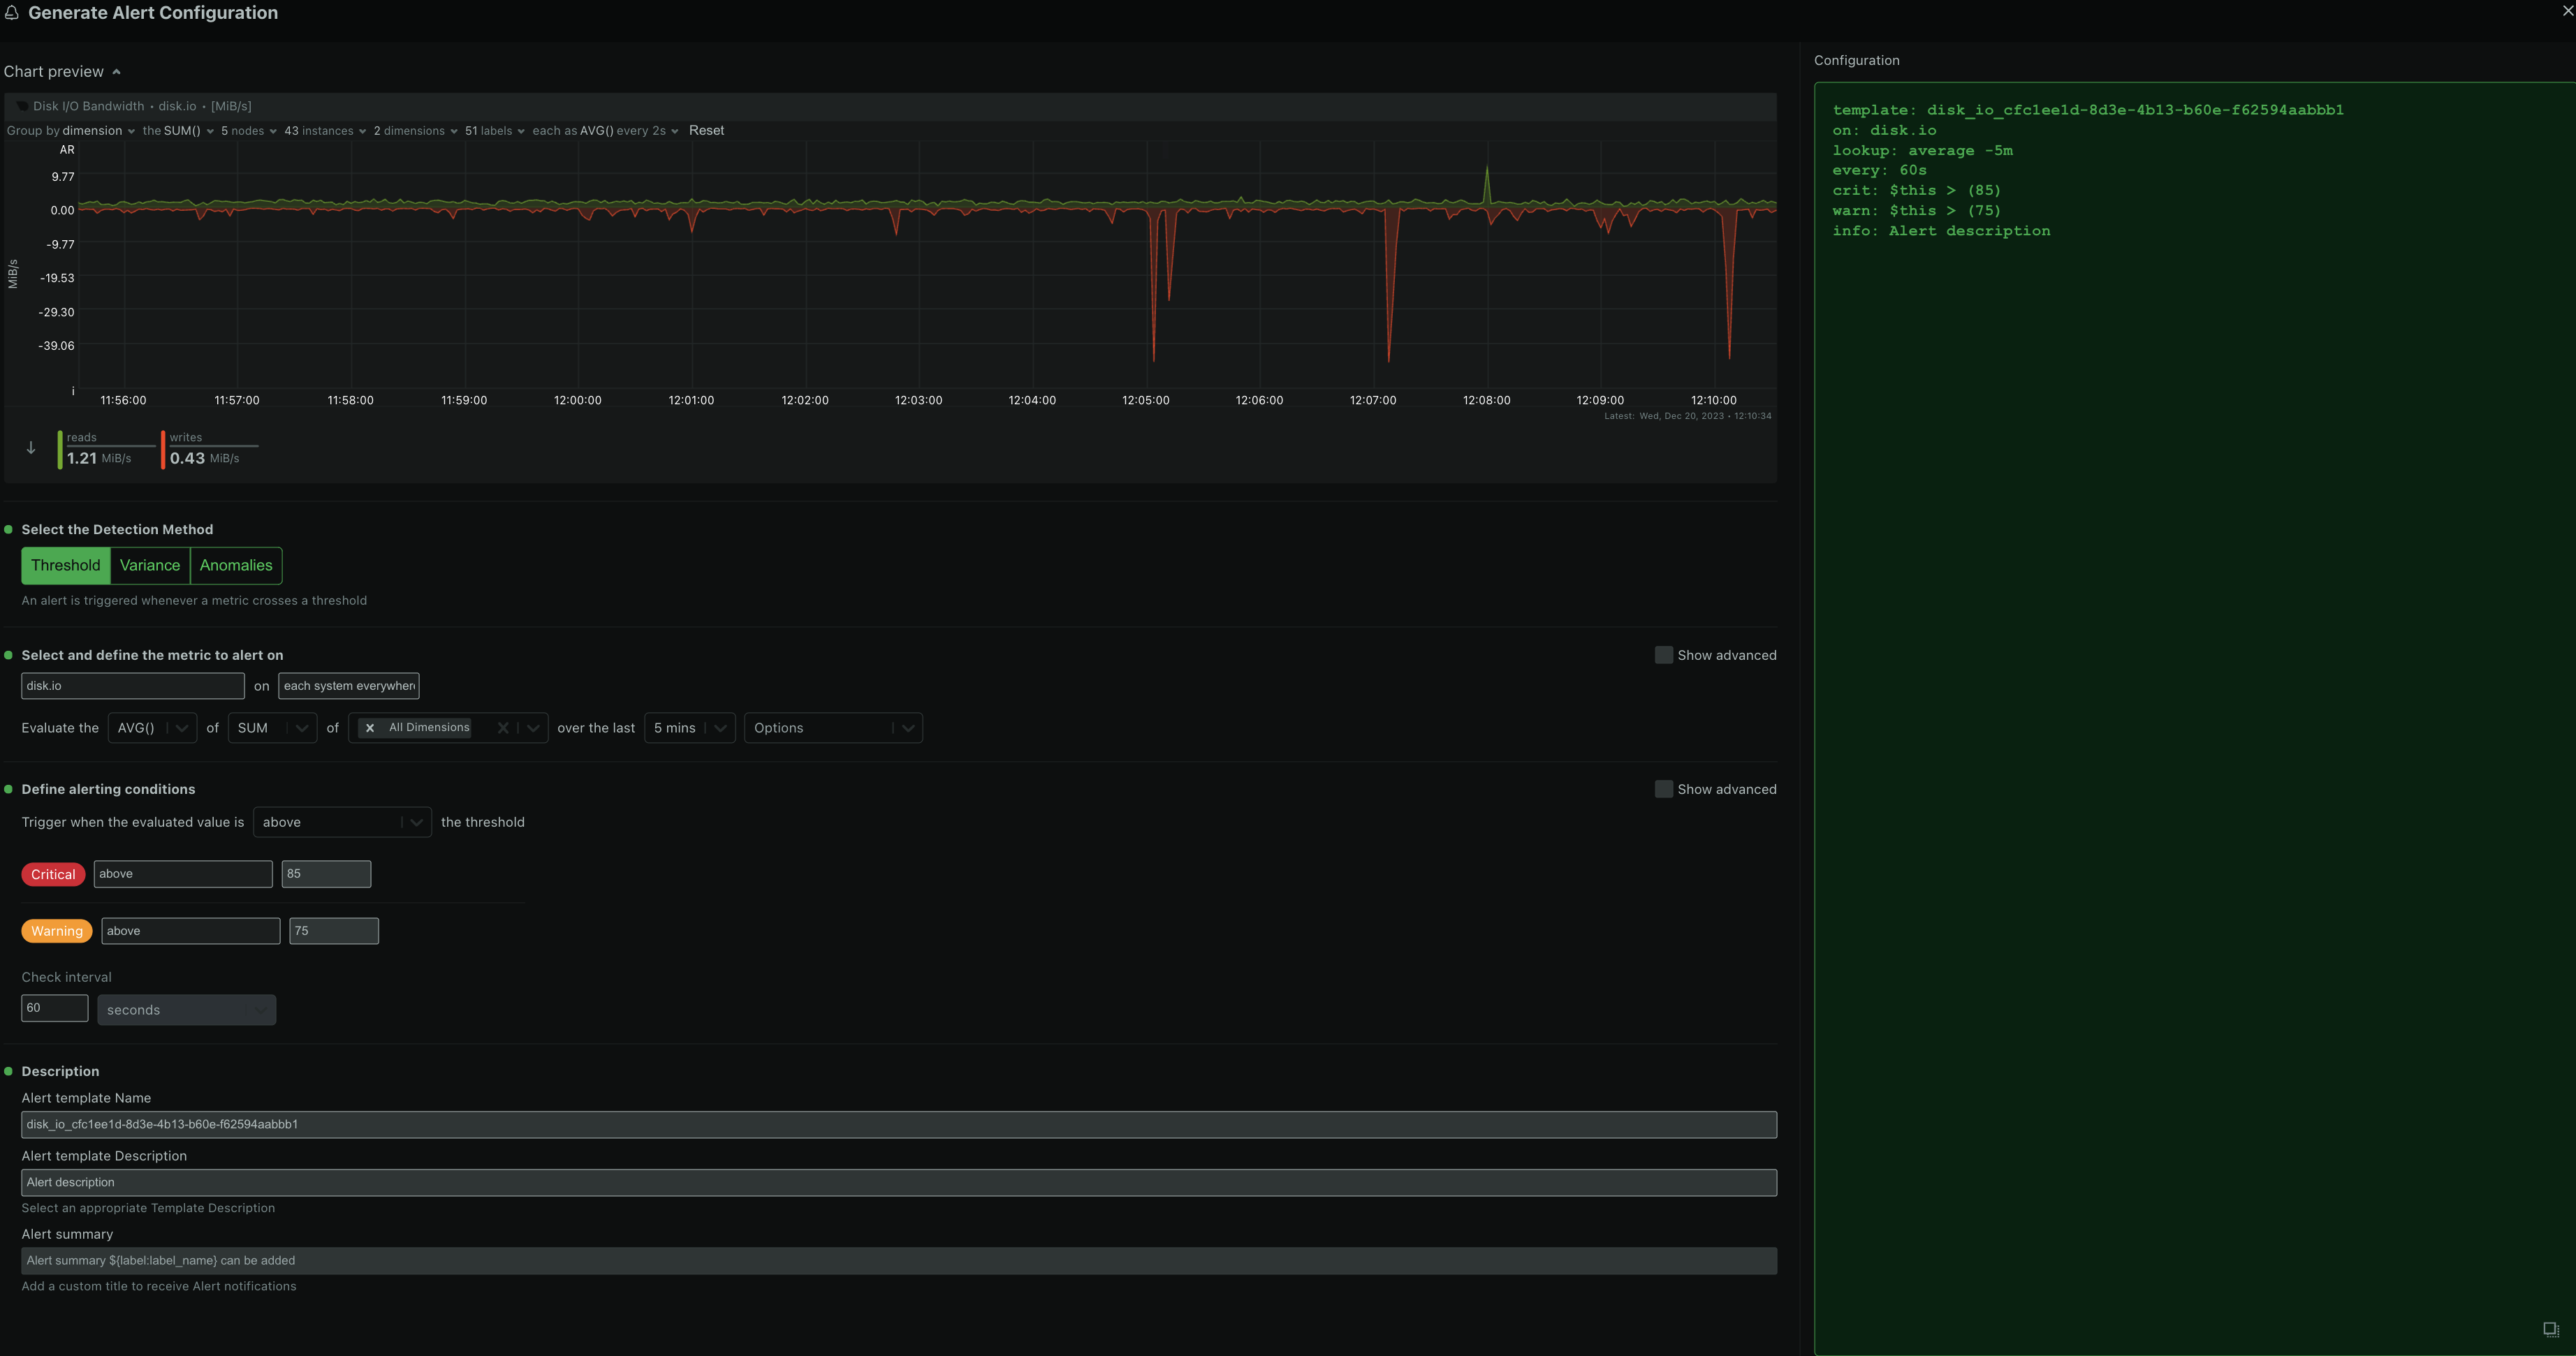--> - -4. If you want more fine-grained control or access to more advanced settings, enable **Show advanced** - <!--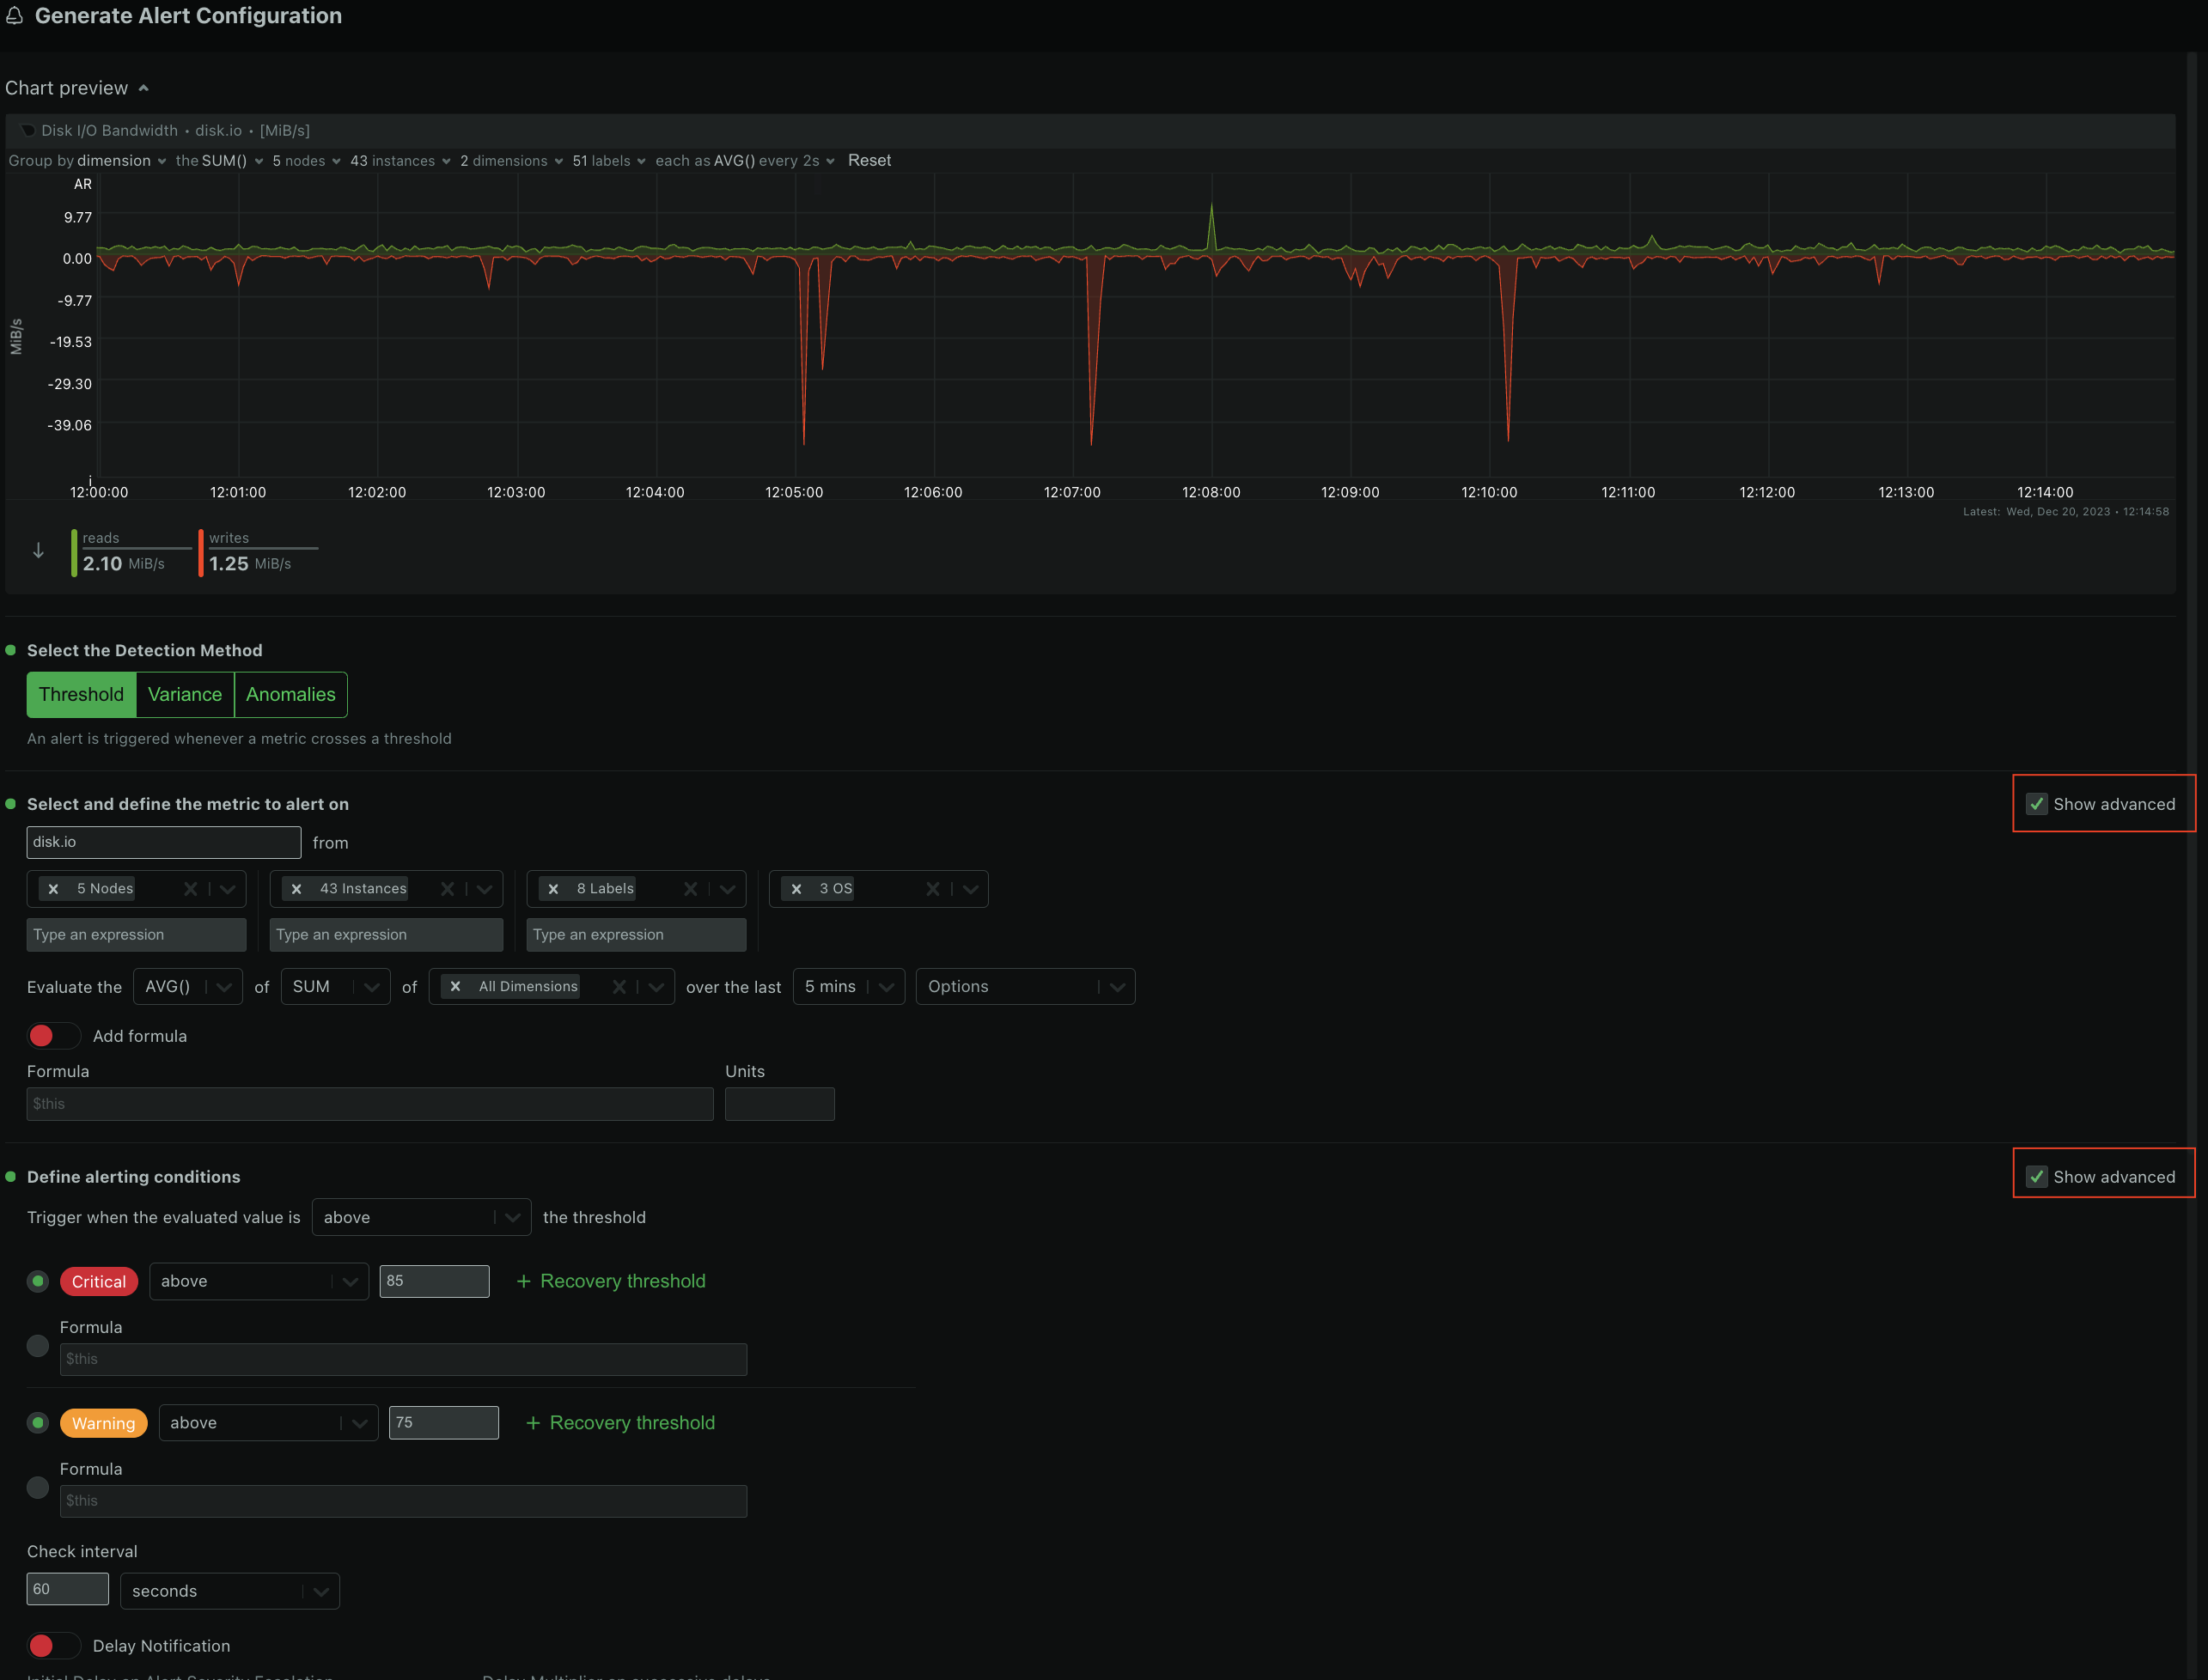--> - -5. Copy the alert definition that is generated in the code box and add it to an existing [health configuration file](https://github.com/netdata/netdata/blob/master/src/health/REFERENCE.md#edit-health-configuration-files) or a new custom file under `<path to netdata install>/etc/netdata/health.d/` on a Parent Agent or a Standalone Child Agent. - <!----> - -6. Reload Netdata Alert Health checks `<path to netdata install>/usr/sbin/netdatacli reload-health` and the new alert is now configured. +## Using the Alerts Configuration Manager +1. Navigate to the **Metrics** tab and select the chart you want to configure for alerts. +2. Click the **Alert icon** in the top right corner of the chart. +3. The Alert Configuration Manager will open, showing the default thresholds. Modify these thresholds as needed, the alert definition on the right will update automatically. +4. For additional settings, toggle **Show advanced**. +5. After configuring the alert, copy the generated alert definition from the code box. Paste this into an existing or new custom health configuration file located at `<path to netdata install>/etc/netdata/health.d/` on a Parent Agent or a Standalone Child Agent. The guide to edit health configuration files is available [here](https://github.com/netdata/netdata/blob/master/src/health/REFERENCE.md#edit-health-configuration-files). +6. To activate the new alert, run the command `<path to netdata install>/usr/sbin/netdatacli reload-health`. ## Alerts Configuration Manager Sections -- **Alert Detection Method** - <!----> - An alert is triggered whenever a metric crosses a threshold: - - Based on a standard `threshold` - - Based on metric `variance` - - Based on the `anomaly rate` of the metric - +### Alert Detection Method + +An alert is triggered whenever a metric crosses a threshold: -- **Metrics Lookup, Filtering and Formula Section** - <!----> +- **Standard Threshold**: Triggered when a metric crosses a predefined value. +- **Metric Variance**: Triggered based on the variance of the metric. +- **Anomaly Rate**: Triggered based on the anomaly rate of the metric. - - **Metrics Lookup**: This is the **Evaluate** line of fields in the modal and it defines the parameters for the database lookup that is needed to get the value that will be compared against the alert definition. It corresponds to the [`lookup`](https://github.com/netdata/netdata/blob/master/src/health/REFERENCE.md#alert-line-lookup) line of the Alert configuration file. The Alerts Configuration Manager provides a default selection for the lookup and can be modified to suit your requirements. The parameters that can be modified are: - - METHOD (`avg`, `sum`, `min`, `max`, `cv`, `stddev`) - - COMPUTATION (sum of all dimensions or individually for each dimension) - - DIMENSIONS (All dimensions, or a selection of dimensions) - - DURATION (the period in time to run the lookup) - - OPTIONS (`absolute`, `unaligned`, `percentage`, `min2max`) +### Metrics Lookup, Filtering and Formula Section - - **Alert Filtering**: This functionality can be accessed through the **Show advanced** checkbox and it allows for filtering the alert health checks to be run only for specific components of the infrastructure. It helps in achieving a fine-grained configuration for any given alert. - - `HOSTS` / `NODES` - By default all hosts are selected. You can pick nodes from the dropdown list, or enter a wildcard matching a list of hosts that you want the alert health check to run on. This field corresponds to the [`hosts`](https://github.com/netdata/netdata/blob/master/src/health/REFERENCE.md#alert-line-hosts) line of the Alert configuration file. - - `INSTANCES` - All instances are selected by default. You can pick instances from the dropdown list, or enter a wildcard matching a list of instances that you want the alert health check to run on. This field corresponds to the [`charts`](https://github.com/netdata/netdata/blob/master/src/health/REFERENCE.md#alert-line-charts) line of the Alert configuration file. - - `CHART LABELS` - All chart labels are selected by default. You can pick a chart label from the dropdown list or enter a wildcard matching a list of chart labels that you want the alert health check to run on. This field corresponds to the [`chart labels`](https://github.com/netdata/netdata/blob/master/src/health/REFERENCE.md#alert-line-chart-labels) line of the Alert configuration file. - - `OS` - All Operating Systems are selected by default. You can choose which OS(s) an alert health check should run on. This field corresponds to the [`os`](https://github.com/netdata/netdata/blob/master/src/health/REFERENCE.md#alert-line-os) line of the Alert configuration file. +You can read more about the different options in the [Alerts reference documentation](https://github.com/netdata/netdata/blob/master/src/health/REFERENCE.md) - - **Formula / Calculation**: This field is available through the **Show advanced** checkbox and it is used to define a formula to be run on top of the `lookup` value. The result of the lookup is available in the `$this` variable, and after the formula is run, the result is also stored in `$this` and can be accessed while setting the alert thresholds. This field corresponds to the [`calc`](https://github.com/netdata/netdata/blob/master/src/health/REFERENCE.md#alert-line-calc) line of the Alert configuration file. +- **Metrics Lookup**: Adjust the database lookup parameters directly in the UI, including method (`avg`, `sum`, `min`, `max`, etc.), computation style, dimensions, duration, and options like `absolute` or `percentage`. +- **Alert Filtering**: The **show advanced** checkbox allows filtering of alert health checks for specific infrastructure components. Options include selecting hosts, nodes, instances, chart labels, and operating systems. +- **Formula / Calculation**: The **show advanced** checkbox allows defining a formula for the metric value, which is then used to set alert thresholds. -- **Alerting conditions** - <!----> - - **Warning and Critical Thresholds**: These fields are used to set the thresholds for the `Warning` and `Critical` alert states, while also having the option to set the condition for the alert to be raised if it is `above` or `below` the given threshold. If the advanced settings are selected, a **formula** option can also be used, to define a custom formula instead of a threshold. These fields correspond to the [`warn` and `crit`](https://github.com/netdata/netdata/blob/master/src/health/REFERENCE.md#alert-lines-warn-and-crit) lines of the Alert configuration file. - - **Recovery Thresholds**: This field is available through the **Show advanced** checkbox, and it is used to set the threshold that the metric value needs to meet to de-escalate from a given severity status, like `Critical to Warning` and from `Warning to Clear`. The logic is appended to the `warn` and `crit` lines of the Alert configuration file and resembles a one-line `IF-THEN-ELSE` clause. - - **Check Interval**: This field is used to define the frequency of the health check for the alert and corresponds to the [`every`](https://github.com/netdata/netdata/blob/master/src/health/REFERENCE.md#alert-line-every) line of the Alert configuration file. - - **Delay Notifications**: This field is available through the **Show advanced** checkbox and it is used to set delay parameters on notifications for an alert severity `escalation` or `de-escalation`. It corresponds to the [`delay`](https://github.com/netdata/netdata/blob/master/src/health/REFERENCE.md#alert-line-delay) line of the Alert configuration file. +### Alerting Conditions - - **Agent Specific Options**: These options are only available on the `Netdata Agent` and not honored on `Netdata Cloud`. They can be accessed through the **Show advanced** checkbox. - <!----> - - **Repeat Notifications**: This field defines the repeat frequency for the alert notification when the alert is in either `warning` or `critical` status and corresponds to the [`repeat`](https://github.com/netdata/netdata/blob/master/src/health/REFERENCE.md#alert-line-repeat) line of the Alert configuration file. - - **Send to**: This field is used to define a user role to which the alert notifications will be sent. If set to `silent`, then the alert won't be sent to any role. It corresponds to the [`to`](https://github.com/netdata/netdata/blob/master/src/health/REFERENCE.md#alert-line-to) line of the Alert configuration file. - - **Custom Exec Script**: This field is used to define a custom script that will be executed when the alert is triggered (but needs to be carefully designed as it needs to call the `health_alarm_notify.sh` module) and corresponds to the [`exec`](https://github.com/netdata/netdata/blob/master/src/health/REFERENCE.md#alert-line-exec) line of the Alert configuration file. +- **Thresholds**: Set thresholds for warning and critical alert states, specifying whether the alert should trigger above or below these thresholds. Advanced settings allow for custom formulas. + - **Recovery Thresholds**: Set thresholds for downgrading the alert from critical to warning or from warning to clear. +- **Check Interval**: Define how frequently the health check should run. +- **Delay Notifications**: Manage notification delays for alert escalations or de-escalations. +- **Agent Specific Options**: Options exclusive to the Netdata Agent, like repeat notification frequencies and notification recipients. + - **Custom Exec Script**: Define custom scripts to execute when an alert triggers. -- **Alert Name, Description and Summary Section** - <!----> +### Alert Name, Description and Summary Section - - **Alert Template Name**: This field uniquely identifies an alert and corresponds to the [`template`](https://github.com/netdata/netdata/blob/master/src/health/REFERENCE.md#alert-line-alarm-or-template) field of the Alert configuration file. - The Alerts Configuration Manager provides a default name for an Alert template but we recommend you modify this to have a meaningful name for your configured alert. - - **Alert Template Description**: This field provides a brief explanation of the alert and corresponds to the [`info`](https://github.com/netdata/netdata/blob/master/src/health/REFERENCE.md#alert-line-info) line of the Alert configuration file. - - **Alert Summary**: This field enables the users to create a custom title for the alert notification (via [Notification integrations](https://learn.netdata.cloud/docs/alerting/notifications/centralized-cloud-notifications)) and corresponds to the [`summary`](https://github.com/netdata/netdata/blob/master/src/health/REFERENCE.md#alert-line-summary) line of the Alert configuration file. +- **Alert Template Name**: Provide a unique name for the alert. +- **Alert Template Description**: Offer a brief explanation of what the alert monitors. +- **Alert Summary**: Create a custom title for alert notifications, which can be integrated with centralized notification systems available [here](https://learn.netdata.cloud/docs/alerting/notifications/centralized-cloud-notifications). |