
diff options
| -rw-r--r-- | DOCUMENTATION.md | 87 | ||||
| -rw-r--r-- | README.md | 28 | ||||
| -rw-r--r-- | daemon/config/README.md | 4 | ||||
| -rw-r--r-- | docs/agent-cloud.md | 79 | ||||
| -rw-r--r-- | docs/getting-started.md | 62 | ||||
| -rw-r--r-- | docs/netdata-cloud/README.md | 55 | ||||
| -rw-r--r-- | docs/netdata-cloud/nodes-view.md | 215 | ||||
| -rw-r--r-- | docs/netdata-cloud/signing-in.md | 175 | ||||
| -rw-r--r-- | docs/step-by-step/step-02.md | 73 | ||||
| -rw-r--r-- | docs/step-by-step/step-03.md | 169 | ||||
| -rw-r--r-- | docs/step-by-step/step-04.md | 8 | ||||
| -rw-r--r-- | docs/step-by-step/step-07.md | 15 | ||||
| -rw-r--r-- | docs/what-is-netdata.md | 49 | ||||
| -rw-r--r-- | packaging/installer/UPDATE.md | 3 | ||||
| -rw-r--r-- | web/README.md | 20 | ||||
| -rw-r--r-- | web/gui/README.md | 88 |
16 files changed, 279 insertions, 851 deletions
diff --git a/DOCUMENTATION.md b/DOCUMENTATION.md deleted file mode 100644 index 779de10b4c..0000000000 --- a/DOCUMENTATION.md +++ /dev/null @@ -1,87 +0,0 @@ -# Netdata Documentation - -**Netdata is real-time health monitoring and performance troubleshooting for systems and applications.** It helps you -instantly diagnose slowdowns and anomalies in your infrastructure with thousands of metrics, interactive visualizations, -and insightful health alarms. Plus, long-term storage comes ready out-of-the-box, so can collect, monitor, and maintain -your metrics in one insightful place. - -## Navigating the Netdata documentation - -Welcome! You've arrived at the documentation for Netdata. Use the links below to find answers to the most common -questions about Netdata, such as how to install it, getting started guides, basic configuration, and adding more charts. -Or, explore all of Netdata's documentation using the table of contents to your left. - -<div class="homepage-nav"> - <a class="nav-page" href="packaging/installer/"> - <div class="button-header"> - <h3>Installation guide</h3> - <svg stroke="currentColor" fill="currentColor" stroke-width="0" viewBox="0 0 448 512" height="1em" width="1em" xmlns="http://www.w3.org/2000/svg"><path d="M224.3 273l-136 136c-9.4 9.4-24.6 9.4-33.9 0l-22.6-22.6c-9.4-9.4-9.4-24.6 0-33.9l96.4-96.4-96.4-96.4c-9.4-9.4-9.4-24.6 0-33.9L54.3 103c9.4-9.4 24.6-9.4 33.9 0l136 136c9.5 9.4 9.5 24.6.1 34zm192-34l-136-136c-9.4-9.4-24.6-9.4-33.9 0l-22.6 22.6c-9.4 9.4-9.4 24.6 0 33.9l96.4 96.4-96.4 96.4c-9.4 9.4-9.4 24.6 0 33.9l22.6 22.6c9.4 9.4 24.6 9.4 33.9 0l136-136c9.4-9.2 9.4-24.4 0-33.8z"></path></svg> - </div> - <div class="button-text"> - <p>Use our automated one-line installation script to install Netdata on Linux systems or find detailed instructions for binary packages, Kubernetes, Docker, macOS, and more.</p> - </div> - </a> - <a class="nav-page" href="docs/step-by-step/step-00/"> - <div class="button-header"> - <h3>Step-by-step tutorial</h3> - <svg stroke="currentColor" fill="currentColor" stroke-width="0" viewBox="0 0 448 512" height="1em" width="1em" xmlns="http://www.w3.org/2000/svg"><path d="M224.3 273l-136 136c-9.4 9.4-24.6 9.4-33.9 0l-22.6-22.6c-9.4-9.4-9.4-24.6 0-33.9l96.4-96.4-96.4-96.4c-9.4-9.4-9.4-24.6 0-33.9L54.3 103c9.4-9.4 24.6-9.4 33.9 0l136 136c9.5 9.4 9.5 24.6.1 34zm192-34l-136-136c-9.4-9.4-24.6-9.4-33.9 0l-22.6 22.6c-9.4 9.4-9.4 24.6 0 33.9l96.4 96.4-96.4 96.4c-9.4 9.4-9.4 24.6 0 33.9l22.6 22.6c9.4 9.4 24.6 9.4 33.9 0l136-136c9.4-9.2 9.4-24.4 0-33.8z"></path></svg> - </div> - <div class="button-text"> - <p>Take a guided tour through each of Netdata's core features—perfect for beginners. Follow detailed instructions to monitor your systems and apps, and start your journey into performance troubleshooting.</p> - </div> - </a> - <a class="nav-page" href="docs/getting-started/"> - <div class="button-header"> - <h3>Getting started guide</h3> - <svg stroke="currentColor" fill="currentColor" stroke-width="0" viewBox="0 0 448 512" height="1em" width="1em" xmlns="http://www.w3.org/2000/svg"><path d="M224.3 273l-136 136c-9.4 9.4-24.6 9.4-33.9 0l-22.6-22.6c-9.4-9.4-9.4-24.6 0-33.9l96.4-96.4-96.4-96.4c-9.4-9.4-9.4-24.6 0-33.9L54.3 103c9.4-9.4 24.6-9.4 33.9 0l136 136c9.5 9.4 9.5 24.6.1 34zm192-34l-136-136c-9.4-9.4-24.6-9.4-33.9 0l-22.6 22.6c-9.4 9.4-9.4 24.6 0 33.9l96.4 96.4-96.4 96.4c-9.4 9.4-9.4 24.6 0 33.9l22.6 22.6c9.4 9.4 24.6 9.4 33.9 0l136-136c9.4-9.2 9.4-24.4 0-33.8z"></path></svg> - </div> - <div class="button-text"> - <p>Have some monitoring and system administration experience? Dive right into configuring Netdata, accessing the dashboard, working with the daemon, and changing how Netdata stores metrics.</p> - </div> - </a> - <a class="nav-page" href="docs/configuration-guide/"> - <div class="button-header"> - <h3>Configuration guide</h3> - <svg stroke="currentColor" fill="currentColor" stroke-width="0" viewBox="0 0 448 512" height="1em" width="1em" xmlns="http://www.w3.org/2000/svg"><path d="M224.3 273l-136 136c-9.4 9.4-24.6 9.4-33.9 0l-22.6-22.6c-9.4-9.4-9.4-24.6 0-33.9l96.4-96.4-96.4-96.4c-9.4-9.4-9.4-24.6 0-33.9L54.3 103c9.4-9.4 24.6-9.4 33.9 0l136 136c9.5 9.4 9.5 24.6.1 34zm192-34l-136-136c-9.4-9.4-24.6-9.4-33.9 0l-22.6 22.6c-9.4 9.4-9.4 24.6 0 33.9l96.4 96.4-96.4 96.4c-9.4 9.4-9.4 24.6 0 33.9l22.6 22.6c9.4 9.4 24.6 9.4 33.9 0l136-136c9.4-9.2 9.4-24.4 0-33.8z"></path></svg> - </div> - <div class="button-text"> - <p>Take your configuration options from the <em>getting started guide</em> to the next level. Increase metrics retention, modify how charts are displayed, disable collectors, and modify alarms.</p> - </div> - </a> -</div> - -**Netdata Cloud**: Use [Netdata Cloud](docs/netdata-cloud/) and the [Nodes View](docs/netdata-cloud/nodes-view.md) to -view real-time, distributed health monitoring and performance troubleshooting data for all your systems in one place. -Add as many nodes as you'd like! - -**Advanced users**: For those who already understand how to access a Netdata dashboard and perform basic configuration, -feel free to see what's behind any of these other doors. - -- [Tutorial: Change how long Netdata stores metrics](docs/tutorials/longer-metrics-storage.md): Extend Netdata's - long-term metrics storage database by allowing Netdata to use more of your system's RAM and disk. -- [Netdata Behind Nginx](docs/Running-behind-nginx.md): Use an Nginx web server instead of Netdata's built-in server - to enable TLS, HTTPS, and basic authentication. -- [Collect more metrics](collectors/README.md) from other services and applications: Enable new internal - or external plugins and understand when auto-detection works. -- [Performance](docs/Performance.md): Tips on running Netdata on devices with limited CPU and RAM resources, such as - embedded devices, IoT, and edge devices. -- [Streaming](streaming/): Information for those who want to centralize Netdata metrics from any number of distributed - agents. -- [Backends](backends/): Learn how to archive Netdata's real-time metrics to a time series database (like Prometheus) - for long-term archiving. - -Visit the [contributing guide](CONTRIBUTING.md), [contributing to documentation -guide](docs/contributing/contributing-documentation.md), and [documentation style -guide](docs/contributing/style-guide.md) to learn more about our community and how you can get started contributing to -Netdata. - -**Want to get news, how-tos, and heaps of monitoring savvy straight from Netdata? Subscribe to our newsletter to monitor -our team of monitoring pros.** - -<script charset="utf-8" type="text/javascript" src="//js.hsforms.net/forms/shell.js"></script> -<script> - hbspt.forms.create({ - portalId: "4567453", - formId: "6a20deb5-a1e6-4312-9c4d-f6862f947fe0" - }); -</script> @@ -1,7 +1,7 @@ <!-- --- title: "Netdata" -date: 2020-04-06 +date: 2020-05-01 custom_edit_url: https://github.com/netdata/netdata/edit/master/README.md --- --> @@ -72,7 +72,7 @@ Netdata!](https://img.shields.io/twitter/url/http/shields.io.svg?style=social&la The following animated GIF shows the top part of a typical Netdata dashboard.  +action](https://user-images.githubusercontent.com/1153921/80827388-b9fee100-8b98-11ea-8f60-0d7824667cd3.gif) > A typical Netdata dashboard, in 1:1 timing. Charts can be panned by dragging them, zoomed in/out with `SHIFT` + `mouse > wheel`, an area can be selected for zoom-in with `SHIFT` + `mouse selection`. Netdata is highly interactive, @@ -175,7 +175,7 @@ For more information about running Netdata in Docker, check the [docker installa From Netdata v1.12 and above, anonymous usage information is collected by default and sent to Google Analytics. To read more about the information collected and how to opt-out, check the [anonymous statistics -page](docs/anonymous-statistics.md). +page](/docs/anonymous-statistics.md). ## Why Netdata @@ -304,8 +304,8 @@ This is what you should expect from Netdata: [flock.com](/health/notifications/flock/), [hangouts](/health/notifications/hangouts/), [irc](/health/notifications/irc/), [kavenegar.com](/health/notifications/kavenegar/), [messagebird.com](/health/notifications/messagebird/), [pagerduty.com](/health/notifications/pagerduty/), - [prowl](health/notifications/prowl/), [pushbullet.com](/health/notifications/pushbullet/), - [pushover.net](health/notifications/pushover/), [rocket.chat](/health/notifications/rocketchat/), + [prowl](/health/notifications/prowl/), [pushbullet.com](/health/notifications/pushbullet/), + [pushover.net](/health/notifications/pushover/), [rocket.chat](/health/notifications/rocketchat/), [slack.com](/health/notifications/slack/), [smstools3](/health/notifications/smstools3/), [syslog](/health/notifications/syslog/), [telegram.org](/health/notifications/telegram/), [twilio.com](/health/notifications/twilio/), [web](/health/notifications/web/) and [custom @@ -337,7 +337,8 @@ This is what you should expect from Netdata: To improve clarity on charts, Netdata dashboards present **positive** values for metrics representing `read`, `input`, `inbound`, `received` and **negative** values for metrics representing `write`, `output`, `outbound`, `sent`. - + _Netdata charts showing the bandwidth and packets of a network interface. `received` is positive and `sent` is negative._ @@ -346,7 +347,8 @@ negative._ Netdata charts automatically zoom vertically, to visualize the variation of each metric within the visible time-frame. - + _A zero-based `stacked` chart, automatically switches to an auto-scaled `area` chart when a single dimension is selected._ @@ -356,27 +358,23 @@ selected._ Charts on Netdata dashboards are synchronized to each other. There is no master chart. Any chart can be panned or zoomed at any time, and all other charts will follow. - + _Charts are panned by dragging them with the mouse. Charts can be zoomed in/out with`SHIFT` + `mouse wheel` while the mouse pointer is over a chart._ -> The visible time-frame (pan and zoom) is propagated from Netdata server to Netdata server when navigating via the -> [My nodes menu](/registry/README.md). - ### Highlighted time-frame To improve visual anomaly detection across charts, the user can highlight a time-frame (by pressing `Alt` + `mouse selection`) on all charts. - + _A highlighted time-frame can be given by pressing `Alt` + `mouse selection` on any chart. Netdata will highlight the same range on all charts._ -> Highlighted ranges are propagated from Netdata server to Netdata server, when navigating via the [My nodes -> menu](/registry/README.md). - ## What Netdata monitors Netdata can collect metrics from 200+ popular services and applications, on top of dozens of system-related metrics diff --git a/daemon/config/README.md b/daemon/config/README.md index 6c9806cbb1..de8ed684f9 100644 --- a/daemon/config/README.md +++ b/daemon/config/README.md @@ -161,7 +161,7 @@ In this area of `netdata.conf` you can find configuration options for individual following the pattern `[NAME]`. Using the settings and values under these sections, you can control all aspects of a specific chart. You can change its -title, make it appear higher in Netdata's [menu](/web/gui/README.md#menus), tweak its dimensions, and much more. +title, make it appear higher in Netdata's [menu](/web/gui/README.md#metrics-menus), tweak its dimensions, and much more. To find the name of a given chart, and thus the name of its section in `netdata.conf`, look at the top-left corner of a chart: @@ -178,7 +178,7 @@ that is information about lines that begin with `dim`, which affect a chart's di | `enabled` | A boolean (`yes` or `no`) that explicitly enables or disables the chart in question. | | `cache directory` | The directory where cache files for this plugin, if needed, are stored. | | `chart type` | Defines what type of chart to display. It can be `line`, `area`, or `stacked`. If empty or missing, `line` will be used. | -| `type` | Uniquely identify which [menu](/web/gui/README.md#menus) on the Netdata dashboard this chart should appear under. Some examples include `system` (**System**), `disk` (**Disks**), `net` (**Network Interfaces**), and `netdata` (**Netdata Monitoring**). | +| `type` | Uniquely identify which [metrics menu](/web/gui/README.md#metrics-menus) on the Netdata dashboard this chart should appear under. Some examples include `system` (**System**), `disk` (**Disks**), `net` (**Network Interfaces**), and `netdata` (**Netdata Monitoring**). | | `family` | Change the chart's [family](/web/README.md#families) from its default. For example, you could force a disk space chart to collect metrics for family `sdb` instead of family `sda`. | | `units` | Text for the label of the vertical axis of the chart. This means all dimensions should have the same unit of measurement. | | `context` | Change the default [context](/web/README.md#contexts) of the chart. Changing this setting will affect what metrics and metrics the chart displays, and which alarms are attached to it. | diff --git a/docs/agent-cloud.md b/docs/agent-cloud.md new file mode 100644 index 0000000000..2a03582c2b --- /dev/null +++ b/docs/agent-cloud.md @@ -0,0 +1,79 @@ +<!-- +--- +title: "Use the Agent with Netdata Cloud" +date: 2020-05-04 +custom_edit_url: https://github.com/netdata/netdata/edit/master/docs/agent-cloud.md +--- +--> + +# Use the Agent with Netdata Cloud + +While the Netdata Agent is an enormously powerful _distributed_ health monitoring and performance troubleshooting tool, +many of its users need to monitor dozens or hundreds of systems at the same time. That's why we built Netdata Cloud, a +hosted web interface that gives you real-time visibility into your entire infrastructure. + +There are two main ways to use your Agent(s) with Netdata Cloud. You can use both these methods simultaneously, or just +one, based on your needs: + +- Use Netdata Cloud's web interface for monitoring an entire infrastructure, with any number of Agents, in one + centralized dashboard. +- Use **Visited nodes** to quickly navigate between the dashboards of nodes you've recently visited. + +## Monitor an infrastructure with Netdata Cloud + +We designed Netdata Cloud to help you see health and performance metrics, plus active alarms, in a single interface. +Here's what a small infrastructure might look like: + + + +[Read more about Netdata Cloud](https://learn.netdata.cloud/docs/cloud/) to better understand how it gives you real-time +visibility into your entire infrastructure, and why you might consider using it. + +Next, [get started in 5 minutes](https://learn.netdata.cloud/docs/cloud/get-started/), or read our [claiming +reference](/claim/README.md) for a complete investigation of Cloud's security and encryption features, plus instructions +for Docker containers. + +## Navigate between dashboards with Visited nodes + +If you don't want to use Netdata Cloud's web interface, you can still connect multiple nodes through the **Visited +nodes** menu, which appears on the left-hand side of the dashboard. + +You can use the Visited nodes menu to navigate between the dashboards of many different Agent-monitored systems quickly. + +To add nodes to your Visited nodes menu, you first need to navigate to that node's dashboard, then click the **Sign in** +button at the top of the dashboard. On the screen that appears, which states your node is requesting access to your +Netdata Cloud account, sign in with your preferred method. + +Cloud redirects you back to your node's dashboard, which is now connected to your Netdata Cloud account. You can now see +the Visited nodes menu, which is populated by a single node. + +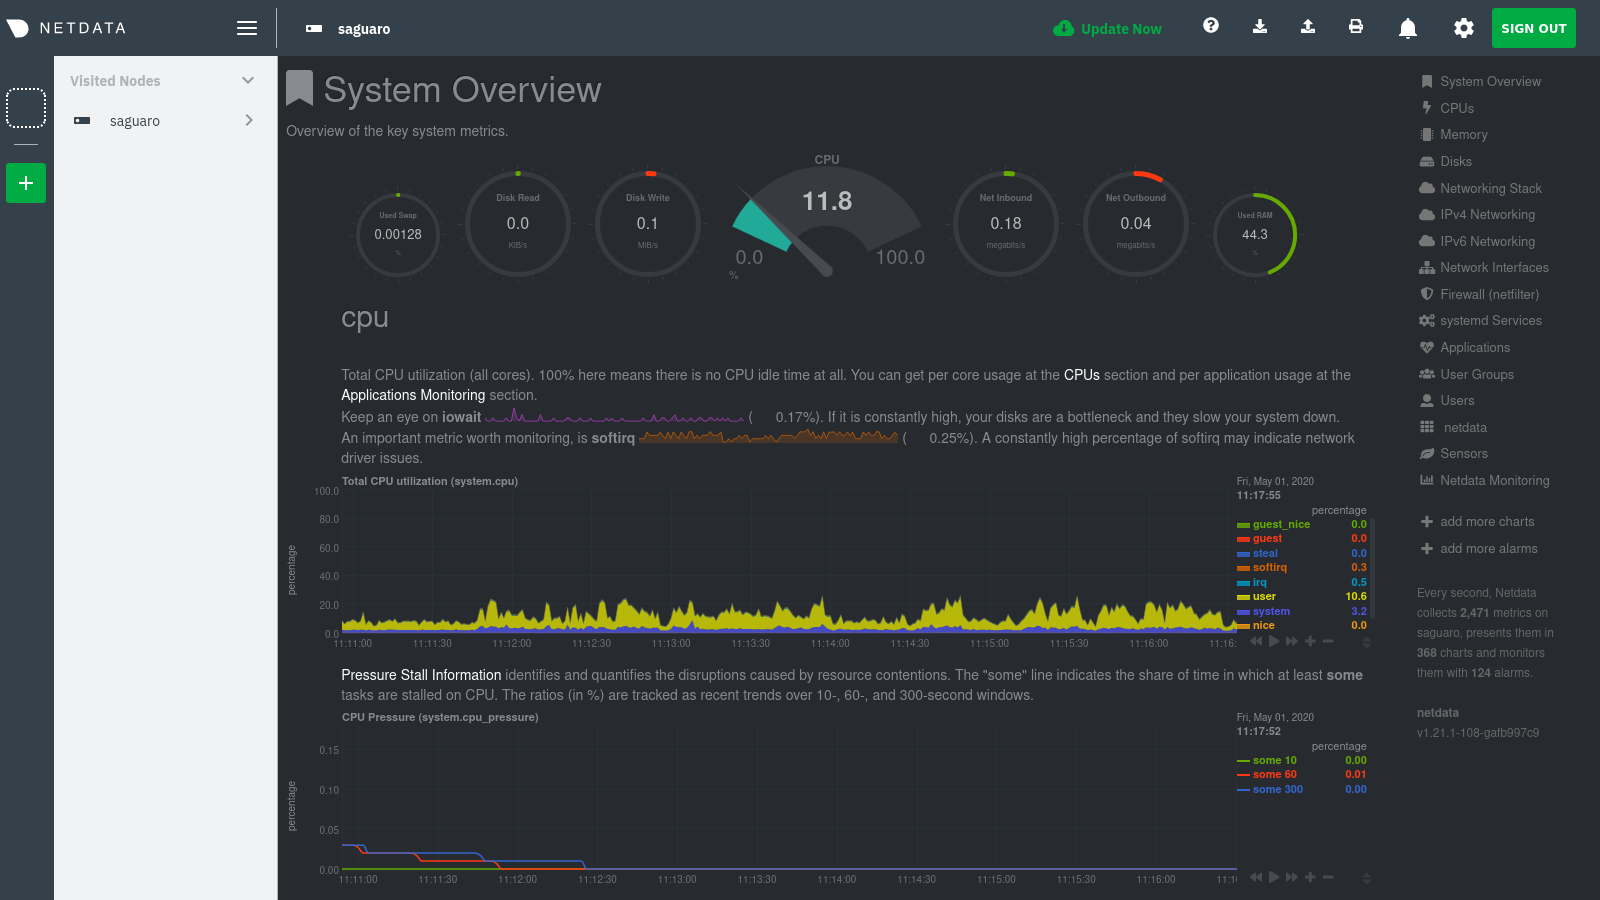 + +If you previously went through the Cloud onboarding process to create a Space and War Room, you will also see these in +the Visited Nodes menu. You can click on your Space or any of your War Rooms to navigate to Netdata Cloud and continue +monitoring your infrastructure from there. + +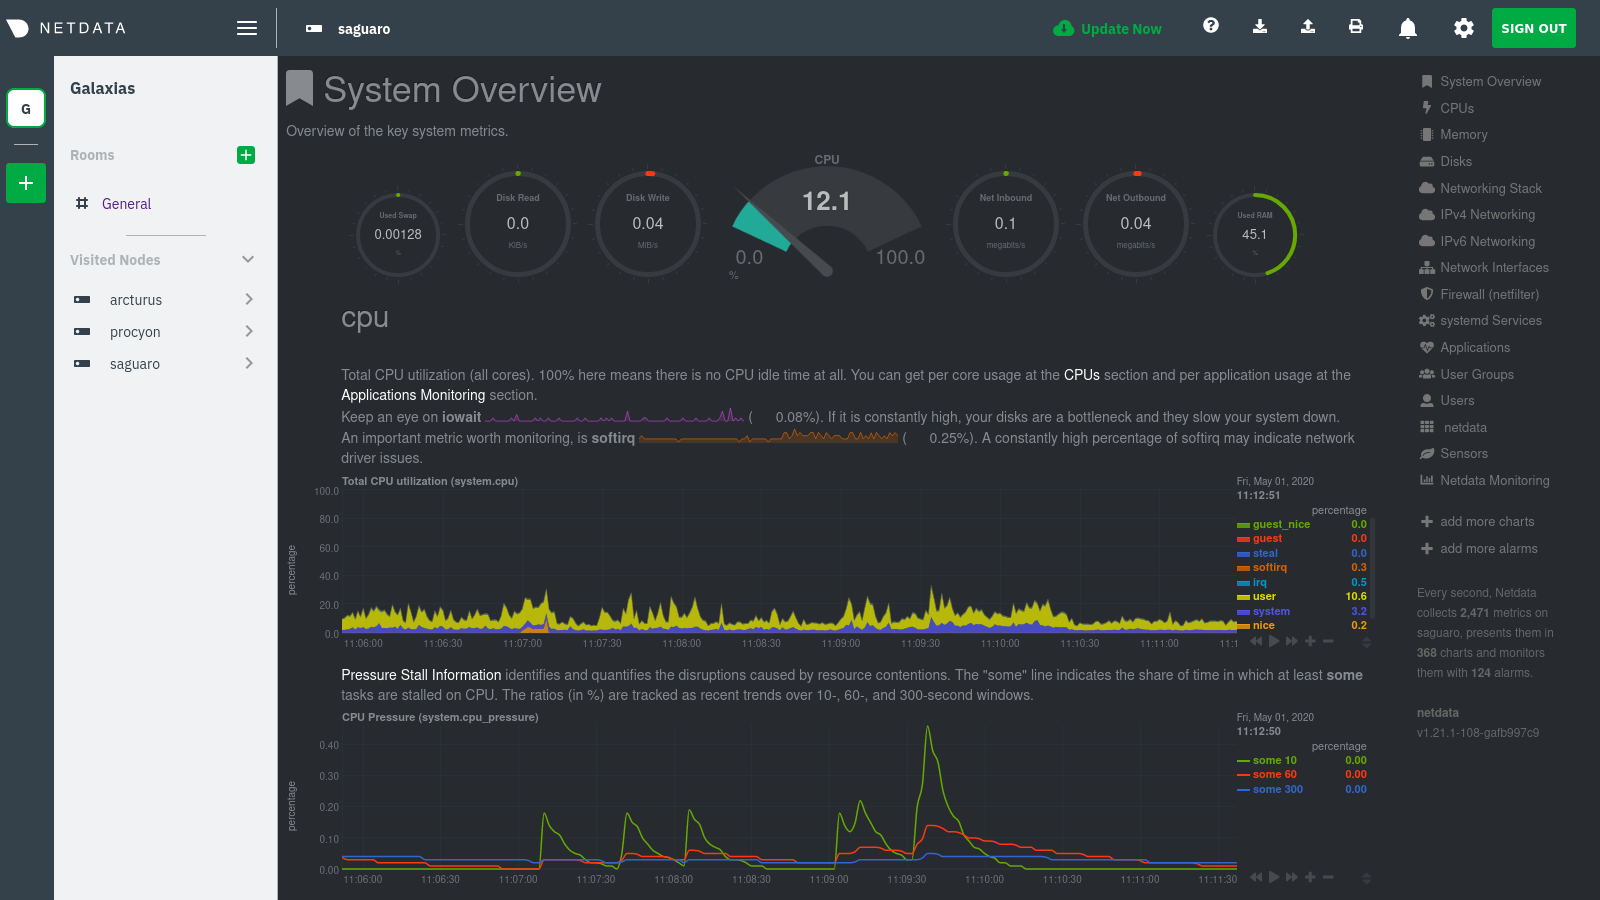 + +To add more Agents to your Visited nodes menu, visit them and sign in again. This process connects that node to your +Cloud account and further populates the menu. + +Once you've added more than one node, you can use the menu to switch between various dashboards without remembering IP +addresses or hostnames or saving bookmarks for every node you want to monitor. + + + +## What's next? + +The Agent-Cloud integration is highly adaptable to the needs of any infrastructure or user. If you want to learn more +about how you might want to use or configure Cloud, we recommend the following: + +- Get an overview of Cloud's features by reading [Cloud documentation](https://learn.netdata.cloud/docs/cloud/). +- Follow the 5-minute [get started with Cloud](https://learn.netdata.cloud/docs/cloud/get-started/) guide to finish + onboarding and claim your first nodes. +- Better understand how agents connect securely to the Cloud with [claiming](/claim/README.md) and [Agent-Cloud + link](/aclk/README.md) documentation.
\ No newline at end of file diff --git a/docs/getting-started.md b/docs/getting-started.md index ca0f27422c..6a3e9ca633 100644 --- a/docs/getting-started.md +++ b/docs/getting-started.md @@ -1,17 +1,17 @@ <!-- --- -title: "Getting started guide" -date: 2020-04-06 +title: "Get started guide" +date: 2020-05-04 custom_edit_url: https://github.com/netdata/netdata/edit/master/docs/getting-started.md --- --> -# Getting started guide +# Get started guide -Thanks for trying Netdata! In this getting started guide, we'll quickly walk you through the first steps you should take -after getting Netdata installed. +Thanks for trying the Netdata Agent! In this getting started guide, we'll quickly walk you through the first steps you +should take after installing the Agent. -Netdata can collect thousands of metrics in real-time and use its database for long-term metrics storage without any +The Agent can collect thousands of metrics in real-time and use its database for long-term metrics storage without any configuration, but there are some valuable things to know to get the most out of Netdata based on your needs. We'll skip right into some technical details, so if you're brand-new to monitoring the health and performance of systems @@ -22,14 +22,11 @@ and applications, our [**step-by-step tutorial**](/docs/step-by-step/step-00.md) ## Access the dashboard -Open up your web browser of choice and navigate to `http://YOUR-HOST:19999`. Welcome to Netdata! +Open up your web browser of choice and navigate to `http://NODE:19999`, replacing `NODE` with the IP address or hostname +of your Agent. Hit **Enter**. Welcome to Netdata!  - -<details markdown="1"><summary>Want to see the dashboard and its features in action? Check out our video.</summary> -<iframe width="720" height="405" src="https://www.youtube.com/embed/Ob6-Wkb6ZBA" frameborder="0" allow="accelerometer; autoplay; encrypted-media; gyroscope; picture-in-picture" allowfullscreen></iframe> -</details> +dashboard](https://user-images.githubusercontent.com/1153921/80825153-abaec600-8b94-11ea-8b17-1b770a2abaa9.gif) **What's next?**: @@ -97,9 +94,9 @@ Some modules, like `chrony`, are disabled by default and must be enabled manuall Once Netdata detects a valid source of data, it will continue trying to collect data from it. For example, if Netdata is collecting data from an Nginx web server, and you shut Nginx down, Netdata will collect new data as soon as -you start the web server back up—no restart necessary. +you start the web server back up—no restart necessary. -### Configuring plugins +### Configure plugins Even if Netdata auto-detects your service/application, you might want to configure what, or how often, Netdata is collecting data. @@ -192,29 +189,33 @@ Find the `SEND_EMAIL="YES"` line and change it to `SEND_EMAIL="NO"`. - See all the alarm options via the [health configuration reference](/health/REFERENCE.md). - Add a new notification method, like [Slack](/health/notifications/slack/). -## Monitoring multiple systems with Netdata +## Monitor multiple systems with Netdata Cloud + +If you have the Agent installed on multiple nodes, you can use Netdata Cloud in two ways: Monitor the health and +performance of an entire infrastructure via the Cloud web interface, or use the Visited Nodes menu that's built into +every dashboard. -If you have Netdata installed on multiple systems, you can have them all appear in the **My nodes** menu at the top-left -corner of the dashboard. +For example, a small infrastructure monitored via Netdata Cloud: -To show all your servers in that menu, you need to [register for or sign in](/docs/netdata-cloud/signing-in.md) to -[Netdata Cloud](/docs/netdata-cloud/README.md) from each system. Each system will then appear in the **My nodes** menu, which you -can use to navigate between your systems quickly. + - +And the process of using the Visited nodes menu to move between Agent dashboards running on various systems, both local +and remote: -Whenever you pan, zoom, highlight, select, or pause a chart, Netdata will synchronize those settings with any other -agent you visit via the My nodes menu. Even your scroll position is synchronized, so you'll see the same charts and -respective data for easy comparisons or root cause analysis. + -You can now seamlessly track performance anomalies across your entire infrastructure! +You can use these features together or separately—the decision is up to you and the needs of your infrastructure. **What's next?**: -- Read up on how the [Netdata Cloud registry works](/registry/), and what kind of data it stores and sends to - your web browser. -- Familiarize yourself with the [Nodes View](/docs/netdata-cloud/nodes-view.md) +- Read about the [Agent-Cloud integration](). +- Get an overview of Cloud's features by reading [Cloud documentation](https://learn.netdata.cloud/docs/cloud/). +- Follow the 5-minute [get started with Cloud](https://learn.netdata.cloud/docs/cloud/get-started/) guide to finish + onboarding and claim your first nodes. +- Better understand how agents connect securely to the Cloud with [claiming](/claim/README.md) and [Agent-Cloud + link](/aclk/README.md) documentation. ## Start, stop, and restart Netdata @@ -235,7 +236,8 @@ and `init.d`: ## What's next? Even after you've configured `netdata.conf`, tweaked alarms, learned the basics of performance troubleshooting, and -added all your systems to the **My nodes** menu, you've just gotten started with Netdata. +claimed all your systems in Netdata Cloud or added them to the Visited nodes menu, you've just gotten started with +Netdata. Take a look at some more advanced features and configurations: diff --git a/docs/netdata-cloud/README.md b/docs/netdata-cloud/README.md deleted file mode 100644 index 6e38c9997f..0000000000 --- a/docs/netdata-cloud/README.md +++ /dev/null @@ -1,55 +0,0 @@ -<!-- ---- -title: "Netdata Cloud" -custom_edit_url: https://github.com/netdata/netdata/edit/master/docs/netdata-cloud/README.md ---- ---> - -# Netdata Cloud - -Netdata Cloud is core to our ongoing mission to provide real-time, distributed health monitoring and performance troubleshooting. It's the foundation of an ecosystem of tools that will help you build more extraordinary infrastructures. - -Netdata Cloud is also the next iteration of our global Netdata registry. For technical information about how our registries work, what information they store, and how your web browser "talks" to both, visit our [registry documentation](/registry/README.md). - -Learn more about the future of Netdata Cloud on our [announcement post](https://blog.netdata.cloud/posts/netdata-cloud-announcement/). - -## Registering for or signing in to Netdata Cloud - -**If you're ready to register for a new Netdata Cloud account, or sign in to your existing Netdata Cloud account, visit our [signing in guide](/docs/netdata-cloud/signing-in.md) for details.** - -> If you're running a private registry and are interested in trying out Netdata Cloud as a replacement for your private -> registry, read [our notice](/docs/netdata-cloud/signing-in.md#private-registries-and-netdata-cloud) about -> transitioning from a private registry to our Netdata Cloud registry. - -## Netdata Cloud features - -Netdata Cloud currently enables two features: the **My nodes** in the top-left corner of the Netdata dashboard, and the -[**Nodes View**](/docs/netdata-cloud/nodes-view.md). - -We have an aggressive roadmap of new features, such as Workspaces for different parts of your infrastructure, Rooms to collaborate with colleagues, and the ability to receive alarms from any number of distributed Netdata agents in a single place. Read more about our proposed features [here](https://blog.netdata.cloud/posts/netdata-cloud-announcement/#what-features-will-netdata-cloud-offer). - -### Planned enterprise features (paid) - -Large enterprises have unique real-time monitoring needs. They have thousands of servers and applications running concurrently, and are willing to pay for the complex features that help them make smarter, faster decisions about their infrastructure. We expect to create a paid tier of Netdata Cloud with a recurring, per-user pricing model that will unlock enterprise-focused features. - -A few of these planned features include: - -- Long-term storage of Netdata UI snapshots -- Active Directory integration for single sign-on -- Private service status pages -- Extended retention of alarms timelines -- Incident response toolkits -- Additional enterprise plugins and integrations -- Extended retention of chat messages - -Again, we expect that the vast majority of Netdata's users won't need these features. Creating these two tiers will help us further fund the company's efforts to deploy Netdata's open-source agent on a massive scale and entirely for free. - -## Running Netdata without Netdata Cloud - -Netdata Cloud is entirely optional. The application will never force you to create a Netdata Cloud account or associate nodes with the public registries. But, if you choose not to use Netdata Cloud, you will be missing out on the [Nodes View](/docs/netdata-cloud/nodes-view.md) and other upcoming features. - -## Running Netdata Cloud on-premises or as a hosted instance - -We plan on making both on-premises and hosted instances of Netdata Cloud available to enterprises. Until then, we are creating a list of people and businesses interested in either of these options. To add yourself or your organization to this list, email us at [info@netdata.cloud](mailto:info@netdata.cloud). - -[](<>) diff --git a/docs/netdata-cloud/nodes-view.md b/docs/netdata-cloud/nodes-view.md deleted file mode 100644 index e6971a1d9e..0000000000 --- a/docs/netdata-cloud/nodes-view.md +++ /dev/null @@ -1,215 +0,0 @@ -<!-- ---- -title: "Using the Nodes View" -custom_edit_url: https://github.com/netdata/netdata/edit/master/docs/netdata-cloud/nodes-view.md ---- ---> - -# Using the Nodes View - -## Introduction - -As of v1.15.0 of Netdata, and in conjunction with our announcement post about the [future of Netdata](https://blog.netdata.cloud/posts/netdata-cloud-announcement/), we have enabled an entirely new way to view your infrastructure using the open-source Netdata agent in conjunction with Netdata Cloud: the **Nodes View**. - -This view, powered by Netdata Cloud, provides an aggregated view of the Netdata agents that you have associated with your Netdata Cloud account. The main benefit of Nodes View is seeing the health of your infrastructure from a single interface, especially if you have many systems running Netdata. With Nodes View, you can monitor the health status of your nodes via active alarms and view a subset of real-time performance metrics the agent is collecting every second. - -!!! attention "Nodes View is beta software!" - The Nodes View is currently in beta, so all typical warnings about beta software apply. You may come across bugs or inconsistencies. - -``` -The current version of Nodes uses the API available on each Netdata agent to check for new alarms and the machine's overall health/availability. In the future, we will offer both polling via the API and real-time streaming of health status/metrics. -``` - -## The Nodes View - -To access the Nodes View, you must first be signed in to Netdata Cloud. To register for an account, or sign in to an existing account, visit our [signing in guide](signing-in.md) for details. - -Once you're signed in to Netdata Cloud, clicking on any of the **Nodes Beta** buttons in the node's web dashboard will lead you to the Nodes View. Find one (`1`) in the dropdown menu in the upper-right corner, a second (`2`) in the top navigation bar, and a third (`3`) in the dropdown menu in the top-left corner of the Netdata dashboard. - -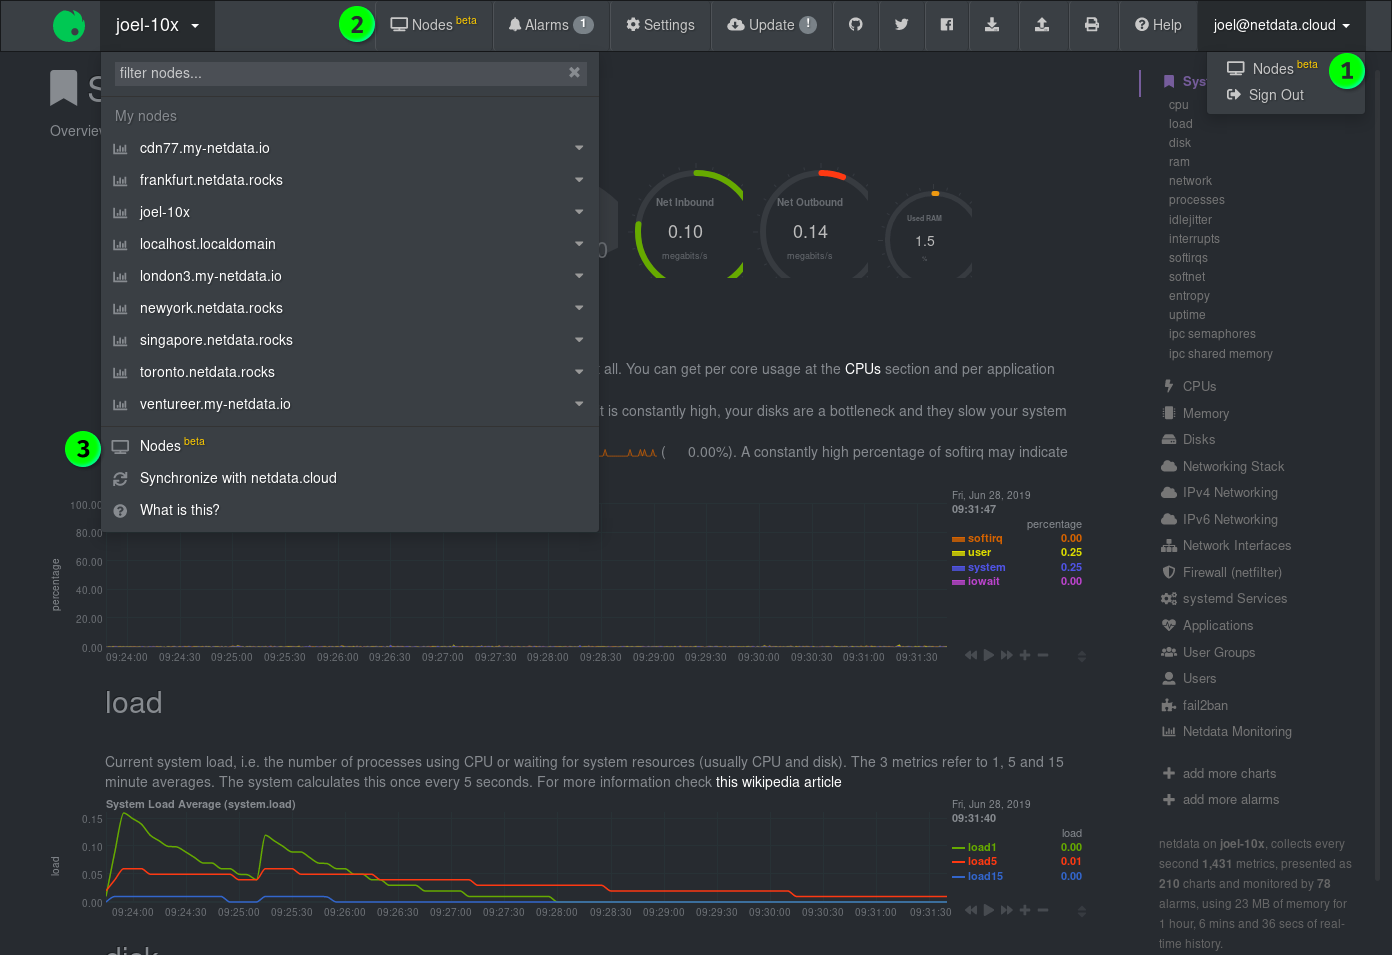 - -### Nodes - -The primary component of the Nodes View is a list of all the nodes with Netdata agents you have associated with your Netdata Cloud account via the Netdata Cloud registry. - -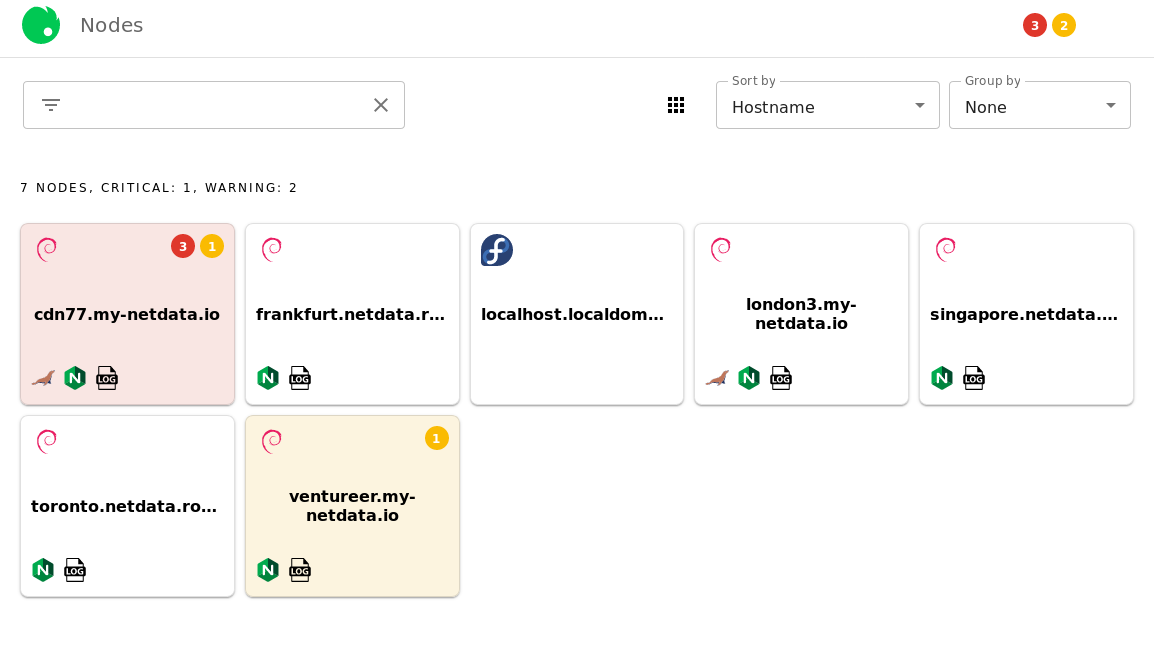 - -Depending on which [view mode](#view-modes) you're using, Nodes View will present you with information about that node, such as its hostname, operating system, warnings/critical alerts, and any [supported services](#Services-available-in-the-Nodes-View) that are running on that node. Here is an example of the **full** view mode: - -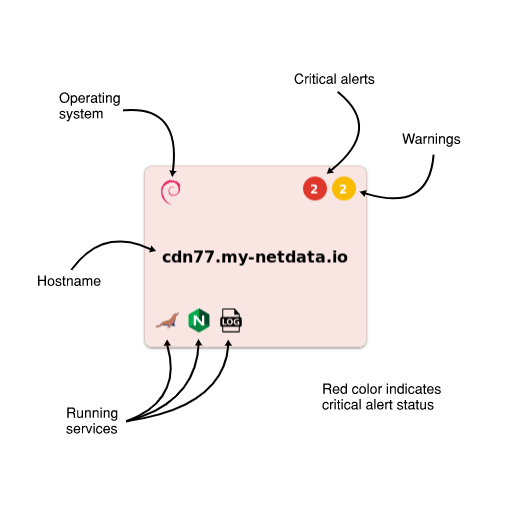 - -The background color of each Node entry is an indication of its health status: - -| Health status | Background color | -| ------------- | ------------------------------------------------------------------------------------------------- | -| **White** | Normal status, no alarms | -| **Yellow** | 1 or more active warnings | -| **Red** | 1 or more active critical alerts | -| **Grey** | Node is unreachable (server unreachable [due to network conditions], server down, or changed URL) | - -### Node overview - -When you click on any of the Nodes, an overview sidebar will appear on the right-hand side of the Nodes View. - -This overview contains the following: - -- An icon (`1`) representing the operating system installed on that machine -- The hostname (`2`) of the machine -- A link (`3`) to the URL at which the web dashboard is available -- Three tabs (`4`) for **System** metrics, **Services** metrics, and **Alarms** -- A number of selectors (`5`) to choose which metrics/alarms are shown in the overview - - **System** tab: _Overview_, _Disks_, and _Network_ selectors - - **Services** tab: _Databases_, _Web_, and _Messaging_ selectors - - **Alarms** tab: _Critical_ and _Warning_ selectors -- The visualizations and/or alarms (`6`) supported under the chosen tab and selector -- Any other available URLS (`7`) associated with that node under the **Node URLs** header. - -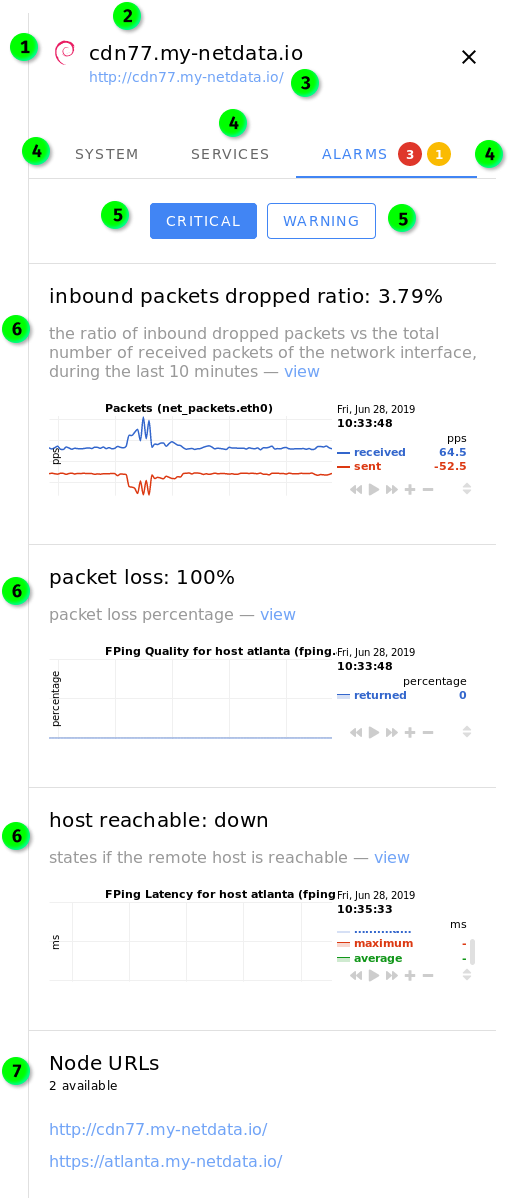 - -By default, clicking on a Node will display the sidebar with the **System** tab enabled. If there are warnings or alarms active for that Node, the **Alarms** tab will be displayed by default. - -**The visualizations in the overview sidebar are live!** As with all of Netdata's visualizations, you can scrub forward and backward in time, zoom, pause, and pinpoint anomalies down to the second. - -#### System tab - -The **System** tab has three sections: *Overview*, *Disks*, and *Network*. - -_Overview_ displays visualizations for `CPU`, `System Load Average` `Disk I/O`, `System RAM`, `System Swap`, `Physical Network Interfaces Aggregated Bandwidth`, and the URL of the node. - -_Disks_ displays visualizations for `Disk Utilization Time`, and `Disk Space Usage` for every available disk. - -_Network_ displays visualizations for `Bandwidth` for every available networking device. - -#### Services tab - -The **Services** tab will show visualizations for any [supported services](#Services-available-in-the-Nodes-View) that are running on that node. Three selectors are available: _Databases_, _Web_, and _Messaging_. If there are no services under any of these categories, the selector will not be clickable. - -#### Alarms tab - -The **Alarms** tab contains two selectors: _Critical_ and _Warning_. If there are no alarms under either of these categories, the selector will not be clickable. - -Both of these tabs will display alarms information when available, along with the relevant visualization with metrics from your Netdata agent. The `view` link redirects you to the web dashboard for the selected node and automatically shows the appropriate visualization and timeframe. - -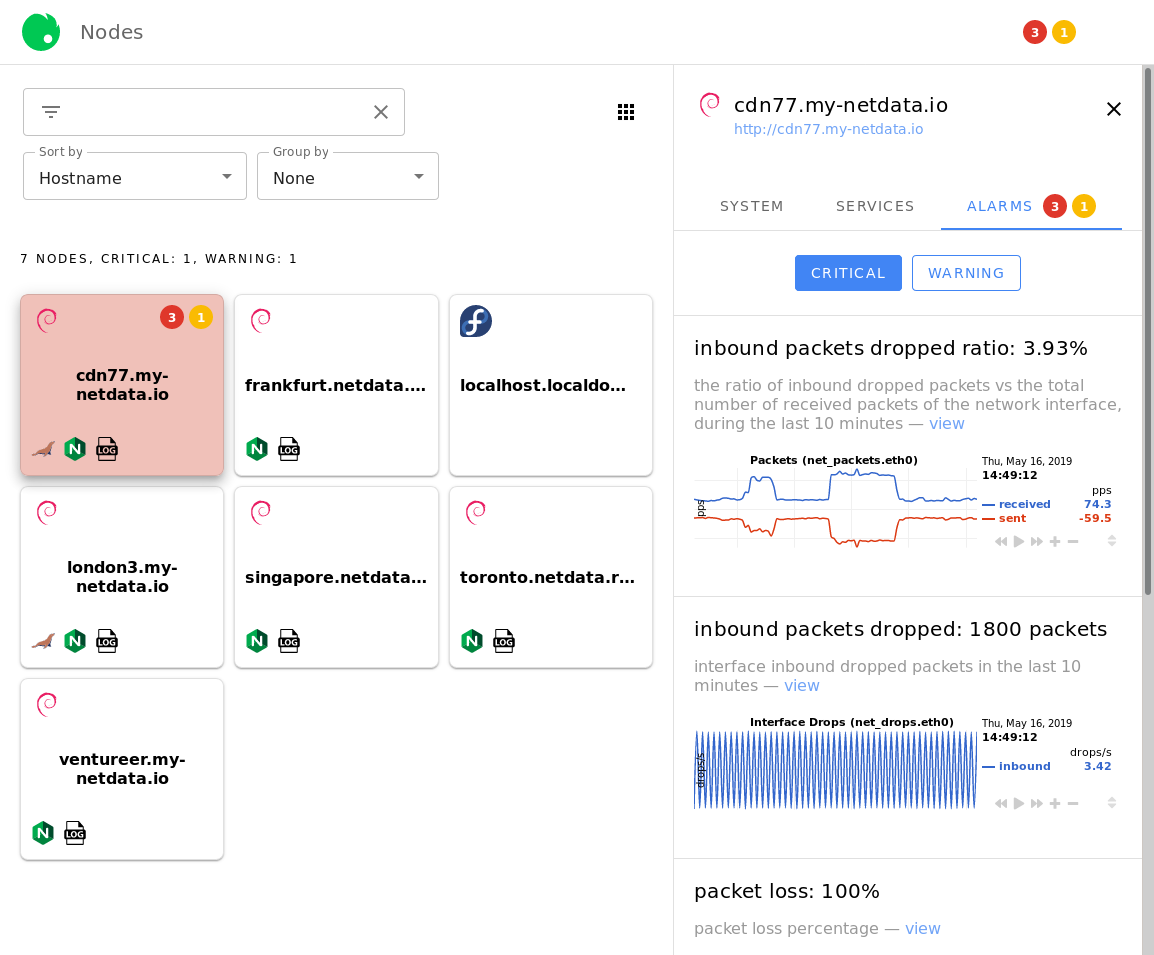 |