
diff options
| author | Joel Hans <joel@netdata.cloud> | 2020-04-14 10:26:13 -0700 |
|---|---|---|
| committer | GitHub <noreply@github.com> | 2020-04-14 10:26:13 -0700 |
| commit | e99692f145f710930723081d2e5bbf8868be2080 (patch) | |
| tree | 468157463f0f133d927019e6826a9559dd989b9b /web | |
| parent | 59916b01b83026d6e6caf59f4efb67b7d428b70d (diff) | |
Docs: Standardize links between documentation (#8638)
* Trying out some absolute-ish links
* Try one out on installer
* Testing logic
* Trying out some more links
* Fixing links
* Fix links in python collectors
* Changed a bunch more links
* Fix build errors
* Another push of links
* Fix build error and add more links
* Complete first pass
* Fix final broken links
* Fix links to files
* Fix for Netlify
* Two more fixes
Diffstat (limited to 'web')
| -rw-r--r-- | web/README.md | 24 | ||||
| -rw-r--r-- | web/api/badges/README.md | 4 | ||||
| -rw-r--r-- | web/api/exporters/prometheus/README.md | 2 | ||||
| -rw-r--r-- | web/api/formatters/README.md | 24 | ||||
| -rw-r--r-- | web/api/formatters/csv/README.md | 2 | ||||
| -rw-r--r-- | web/api/formatters/json/README.md | 2 | ||||
| -rw-r--r-- | web/api/formatters/ssv/README.md | 2 | ||||
| -rw-r--r-- | web/api/formatters/value/README.md | 6 | ||||
| -rw-r--r-- | web/api/health/README.md | 6 | ||||
| -rw-r--r-- | web/api/queries/README.md | 2 | ||||
| -rw-r--r-- | web/gui/README.md | 27 | ||||
| -rw-r--r-- | web/gui/confluence/README.md | 4 | ||||
| -rw-r--r-- | web/gui/custom/README.md | 21 | ||||
| -rw-r--r-- | web/server/README.md | 16 |
14 files changed, 70 insertions, 72 deletions
diff --git a/web/README.md b/web/README.md index 7c4b8aea2d..59c90c6ff6 100644 --- a/web/README.md +++ b/web/README.md @@ -16,18 +16,18 @@ team and the community, but you can also customize them yourself. There are two primary ways to view Netdata's dashboards: -1. The [standard web dashboard](gui/) that comes pre-configured with every +1. The [standard web dashboard](/web/gui/README.md) that comes pre-configured with every Netdata installation. You can see it at `http://SERVER-IP:19999`, or `http://localhost:19999` on `localhost`. You can customize the contents and colors of the standard dashboard [using - JavaScript](gui/#customizing-the-standard-dashboard). + JavaScript](/web/gui/README.md#customizing-the-standard-dashboard). 2. The [`dashboard.js` JavaScript library](#dashboardjs), which helps you - [customize the standard dashboards](gui/#customizing-the-standard-dashboard) - using JavaScript, or create entirely new [custom dashboards](gui/custom/) or - [Atlassian Confluence dashboards](gui/confluence/). + [customize the standard dashboards](/web/gui/README.md#customizing-the-standard-dashboard) + using JavaScript, or create entirely new [custom dashboards](/web/gui/custom/README.md) or + [Atlassian Confluence dashboards](/web/gui/confluence/README.md). -You can also view all the data Netdata collects through the [REST API v1](api/). +You can also view all the data Netdata collects through the [REST API v1](/web/api/). No matter where you use Netdata's charts, you'll want to know how to [use](#using-charts) them. You'll also want to understand how Netdata defines @@ -51,7 +51,7 @@ analysis. Whenever you use a chart in this way, Netdata synchronizes all the other charts to match it. Chart synchronization even works between separate Netdata agents if you connect -them using the [**My nodes** menu](../registry)! +them using the [**My nodes** menu](/registry/README.md)! You can change how charts show their metrics in a few different ways, each of which have a few methods: @@ -84,7 +84,7 @@ Netdata organizes metrics into charts, dimensions, families, and contexts. A **chart** is an individual, interactive, always-updating graphic displaying one or more collected/calculated metrics. Charts are generated by -[collectors](../collectors/). +[collectors](/collectors/README.md). Here's the system CPU chart, the first chart displayed on the standard dashboard: @@ -182,10 +182,8 @@ hover over the date above the list of dimensions. A tooltip will appear that shows you two pieces of information: the collector that produces the chart, and the chart's context. -Netdata also uses [contexts for alarm -templates](../health/REFERENCE.md#alarm-line-on). You can create an -alarm for the `net.packets` context to receive alerts for any chart with that -context, no matter which family it's attached to. +Netdata also uses [contexts for alarm templates](/health/REFERENCE.md#alarm-line-on). You can create an alarm for the +`net.packets` context to receive alerts for any chart with that context, no matter which family it's attached to. ## Positive and negative values on charts @@ -215,7 +213,7 @@ all the charts and other visualizations that appear on any Netdata dashboard. You need to put `dashboard.js` on any HTML page that's going to render Netdata charts. -The [custom dashboards documentation](gui/custom/) contains examples of such +The [custom dashboards documentation](/web/gui/custom/README.md) contains examples of such custom HTML pages. ### Generating dashboard.js diff --git a/web/api/badges/README.md b/web/api/badges/README.md index 3f71005010..a6c63e26b9 100644 --- a/web/api/badges/README.md +++ b/web/api/badges/README.md @@ -27,7 +27,7 @@ Similarly, there is [a chart that shows outbound bandwidth per class](http://lon The right one is a **volume** calculation. Netdata calculated the total of the last 86.400 seconds (a day) which gives `kilobits`, then divided it by 8 to make it KB, then by 1024 to make it MB and then by 1024 to make it GB. Calculations like this are quite accurate, since for every value collected, every second, Netdata interpolates it to second boundary using microsecond calculations. -Let's see a few more badge examples (they come from the [Netdata registry](../../../registry/)): +Let's see a few more badge examples (they come from the [Netdata registry](/registry/README.md)): - **cpu usage of user `root`** (you can pick any user; 100% = 1 core). This will be `green <10%`, `yellow <20%`, `orange <50%`, `blue <100%` (1 core), `red` otherwise (you define thresholds and colors on the URL). @@ -300,7 +300,7 @@ These are options dedicated to badges: </script> ``` -A more advanced badges refresh method is to include `http://your.netdata.ip:19999/refresh-badges.js` in your page. For more information and use example, [check this](../../gui/refresh-badges.js). +A more advanced badges refresh method is to include `http://your.netdata.ip:19999/refresh-badges.js` in your page. --- diff --git a/web/api/exporters/prometheus/README.md b/web/api/exporters/prometheus/README.md index 81ecac0891..30d93815fa 100644 --- a/web/api/exporters/prometheus/README.md +++ b/web/api/exporters/prometheus/README.md @@ -7,6 +7,6 @@ custom_edit_url: https://github.com/netdata/netdata/edit/master/web/api/exporter # prometheus exporter -The prometheus exporter for Netdata is located at the [backends section for prometheus](../../../../backends/prometheus). +The prometheus exporter for Netdata is located at the [backends section for prometheus](/backends/prometheus/README.md). [](<>) diff --git a/web/api/formatters/README.md b/web/api/formatters/README.md index 9d58347439..c6d21214d9 100644 --- a/web/api/formatters/README.md +++ b/web/api/formatters/README.md @@ -14,18 +14,18 @@ The following formats are supported: | format|module|content type|description| |:----:|:----:|:----------:|:----------| -| `array`|[ssv](ssv)|application/json|a JSON array| -| `csv`|[csv](csv)|text/plain|a text table, comma separated, with a header line (dimension names) and `\r\n` at the end of the lines| -| `csvjsonarray`|[csv](csv)|application/json|a JSON array, with each row as another array (the first row has the dimension names)| -| `datasource`|[json](json)|application/json|a Google Visualization Provider `datasource` javascript callback| -| `datatable`|[json](json)|application/json|a Google `datatable`| -| `html`|[csv](csv)|text/html|an html table| -| `json`|[json](json)|application/json|a JSON object| -| `jsonp`|[json](json)|application/json|a JSONP javascript callback| -| `markdown`|[csv](csv)|text/plain|a markdown table| -| `ssv`|[ssv](ssv)|text/plain|a space separated list of values| -| `ssvcomma`|[ssv](ssv)|text/plain|a comma separated list of values| -| `tsv`|[csv](csv)|text/plain|a TAB delimited `csv` (MS Excel flavor)| +| `array`|[ssv](/web/api/formatters/ssv/README.md)|application/json|a JSON array| +| `csv`|[csv](/web/api/formatters/csv/README.md)|text/plain|a text table, comma separated, with a header line (dimension names) and `\r\n` at the end of the lines| +| `csvjsonarray`|[csv](/web/api/formatters/csv/README.md)|application/json|a JSON array, with each row as another array (the first row has the dimension names)| +| `datasource`|[json](/web/api/formatters/json/README.md)|application/json|a Google Visualization Provider `datasource` javascript callback| +| `datatable`|[json](/web/api/formatters/json/README.md)|application/json|a Google `datatable`| +| `html`|[csv](/web/api/formatters/csv/README.md)|text/html|an html table| +| `json`|[json](/web/api/formatters/json/README.md)|application/json|a JSON object| +| `jsonp`|[json](/web/api/formatters/json/README.md)|application/json|a JSONP javascript callback| +| `markdown`|[csv](/web/api/formatters/csv/README.md)|text/plain|a markdown table| +| `ssv`|[ssv](/web/api/formatters/ssv/README.md)|text/plain|a space separated list of values| +| `ssvcomma`|[ssv](/web/api/formatters/ssv/README.md)|text/plain|a comma separated list of values| +| `tsv`|[csv](/web/api/formatters/csv/README.md)|text/plain|a TAB delimited `csv` (MS Excel flavor)| For examples of each format, check the relative module documentation. diff --git a/web/api/formatters/csv/README.md b/web/api/formatters/csv/README.md index 1f36d77ef3..8a166333bc 100644 --- a/web/api/formatters/csv/README.md +++ b/web/api/formatters/csv/README.md @@ -7,7 +7,7 @@ custom_edit_url: https://github.com/netdata/netdata/edit/master/web/api/formatte # CSV formatter -The CSV formatter presents [results of database queries](../../queries) in the following formats: +The CSV formatter presents [results of database queries](/web/api/queries/README.md) in the following formats: | format|content type|description| | :----:|:----------:|:----------| diff --git a/web/api/formatters/json/README.md b/web/api/formatters/json/README.md index 5aa2bbeca5..b0a76bf58c 100644 --- a/web/api/formatters/json/README.md +++ b/web/api/formatters/json/README.md @@ -7,7 +7,7 @@ custom_edit_url: https://github.com/netdata/netdata/edit/master/web/api/formatte # JSON formatter -The CSV formatter presents [results of database queries](../../queries) in the following formats: +The CSV formatter presents [results of database queries](/web/api/queries/README.md) in the following formats: | format | content type | description| |:----:|:----------:|:----------| diff --git a/web/api/formatters/ssv/README.md b/web/api/formatters/ssv/README.md index 46bcdf5e40..c2f373321b 100644 --- a/web/api/formatters/ssv/README.md +++ b/web/api/formatters/ssv/README.md @@ -7,7 +7,7 @@ custom_edit_url: https://github.com/netdata/netdata/edit/master/web/api/formatte # SSV formatter -The SSV formatter sums all dimensions in [results of database queries](../../queries) +The SSV formatter sums all dimensions in [results of database queries](/web/api/queries/README.md) to a single value and returns a list of such values showing how it changes through time. It supports the following formats: diff --git a/web/api/formatters/value/README.md b/web/api/formatters/value/README.md index cb3c455daf..3e4d2ab838 100644 --- a/web/api/formatters/value/README.md +++ b/web/api/formatters/value/README.md @@ -7,7 +7,7 @@ custom_edit_url: https://github.com/netdata/netdata/edit/master/web/api/formatte # Value formatter -The Value formatter presents [results of database queries](../../queries) as a single value. +The Value formatter presents [results of database queries](/web/api/queries/README.md) as a single value. To calculate the single value to be returned, it sums the values of all dimensions. @@ -20,7 +20,7 @@ The Value formatter respects the following API `&options=`: | `min2max` | yes | to return the delta from the minimum value to the maximum value (across dimensions)| The Value formatter is not exposed by the API by itself. -Instead it is used by the [`ssv`](../ssv) formatter -and [health monitoring queries](../../../../health). +Instead it is used by the [`ssv`](/web/api/formatters/ssv/README.md) formatter +and [health monitoring queries](/health/README.md). [](<>) diff --git a/web/api/health/README.md b/web/api/health/README.md index f195e09fd0..5f65fcba8b 100644 --- a/web/api/health/README.md +++ b/web/api/health/README.md @@ -73,7 +73,7 @@ You can access the API via GET requests, by adding the bearer token to an `Autho curl "http://myserver/api/v1/manage/health?cmd=RESET" -H "X-Auth-Token: Mytoken" ``` -By default access to the health management API is only allowed from `localhost`. Accessing the API from anything else will return a 403 error with the message `You are not allowed to access this resource.`. You can change permissions by editing the `allow management from` variable in `netdata.conf` within the [web] section. See [web server access lists](../../server/#access-lists) for more information. +By default access to the health management API is only allowed from `localhost`. Accessing the API from anything else will return a 403 error with the message `You are not allowed to access this resource.`. You can change permissions by editing the `allow management from` variable in `netdata.conf` within the [web] section. See [web server access lists](/web/server/README.md#access-lists) for more information. The command `RESET` just returns Netdata to the default operation, with all health checks and notifications enabled. If you've configured and entered your token correclty, you should see the plain text response `All health checks and notifications are enabled`. @@ -127,7 +127,7 @@ curl "http://myserver/api/v1/manage/health?cmd=SILENCE&context=load" -H "X-Auth- #### Selection criteria -The `selection criteria` are key/value pairs, in the format `key : value`, where value is a Netdata [simple pattern](../../../libnetdata/simple_pattern/). This means that you can create very powerful selectors (you will rarely need more than one or two). +The `selection criteria` are key/value pairs, in the format `key : value`, where value is a Netdata [simple pattern](/libnetdata/simple_pattern/README.md). This means that you can create very powerful selectors (you will rarely need more than one or two). The accepted keys for the `selection criteria` are the following: @@ -221,6 +221,6 @@ The file's location is configurable in `netdata.conf`. The default is shown belo ### Further reading -The test script under [tests/health_mgmtapi](../../../tests/health_mgmtapi) contains a series of tests that you can either run or read through to understand the various calls and responses better. +The test script under [tests/health_mgmtapi](/tests/health_mgmtapi/README.md) contains a series of tests that you can either run or read through to understand the various calls and responses better. [](<>) diff --git a/web/api/queries/README.md b/web/api/queries/README.md index bcf127b6c5..4565abaa80 100644 --- a/web/api/queries/README.md +++ b/web/api/queries/README.md @@ -90,7 +90,7 @@ To disable alignment, pass `&options=unaligned` to the query. To execute the query, the engine evaluates all dimensions of the chart, one after another. -The engine does not evaluate dimensions that do not match the [simple pattern](../../../libnetdata/simple_pattern) +The engine does not evaluate dimensions that do not match the [simple pattern](/libnetdata/simple_pattern/README.md) given at the `dimensions` parameter, except when `options=percentage` is given (this option requires all the dimensions to be evaluated to find the percentage of each dimension vs to chart total). diff --git a/web/gui/README.md b/web/gui/README.md index 7ae9aa3a9d..3b0eb08977 100644 --- a/web/gui/README.md +++ b/web/gui/README.md @@ -15,16 +15,16 @@ toolkit. You've probably seen it before: dashboard](https://user-images.githubusercontent.com/2662304/48307727-9175c800-e55b-11e8-92d8-a581d60a4889.gif) Learn more about how dashboards work and how they're populated using the -`dashboards.js` file in our [web dashboards overview](../). +`dashboards.js` file in our [web dashboards overview](/web/README.md). By default, Netdata starts a web server for its dashboard at port `19999`. Open up your web browser of choice and navigate to `http://SERVER-IP:19999`, or `http://localhost:19999` on `localhost`. -Netdata uses an [internal, static-threaded web server](../server/) to host the +Netdata uses an [internal, static-threaded web server](/web/server/README.md) to host the HTML, CSS, and JavaScript files that make up the standard dashboard. You don't have to configure anything to access it, although you can adjust [your -settings](../server/#other-netdataconf-web-section-options) in the +settings](/web/server/README.md#other-netdataconf-web-section-options) in the `netdata.conf` file, or run Netdata behind an Nginx proxy, and so on. <details markdown="1"><summary>Want to see the dashboard and its features in action? Check out our video.</summary> @@ -52,8 +52,8 @@ dashboard](https://user-images.githubusercontent.com/1153921/62810777-ef681980-b Netdata is broken up into multiple **sections**, such as **System Overview**, **CPU**, **Disk**, and more. Inside each section you'll find a number of charts, -broken down into [contexts](../#contexts) and -[families](../#families). +broken down into [contexts](/web/README.md#contexts) and +[families](/web/README.md#families). An example of the **Memory** section on a Linux desktop system. @@ -74,7 +74,7 @@ associated with. menu](https://user-images.githubusercontent.com/1153921/62811361-38b96880-bab6-11e9-8d41-4d9b29778e86.png) Most menu items will contain several **submenu** entries, which represent any -[families](../#families) from that section. Netdata automatically +[families](/web/README.md#families) from that section. Netdata automatically generates these submenu entries. Here's a **Disks** menu with several submenu entries for each disk drive and @@ -89,22 +89,22 @@ The nodes menu appears in the top-left corner of the standard dashboard and is labeled with the hostname of the system Netdata is monitoring. Clicking on it will display a drop-down menu of any nodes you might have -connected via the [Netdata registry](../../registry/). By default, you'll find +connected via the [Netdata registry](/registry/README.md). By default, you'll find nothing under the **My nodes** heading, but you can try out any of the demo Netdata nodes to see how the nodes menu works. 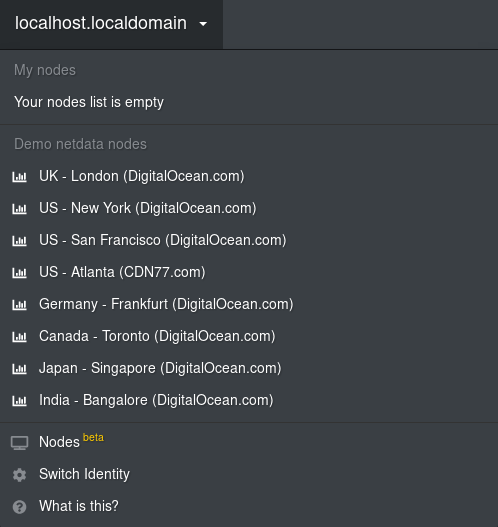 -Once you add nodes via [Netdata Cloud](../../docs/netdata-cloud/) or a [private -registry](../../registry/#run-your-own-registry), you will see them appear under +Once you add nodes via [Netdata Cloud](/docs/netdata-cloud/README.md) or a [private +registry](/registry/README.md#run-your-own-registry), you will see them appear under the **My nodes** heading. 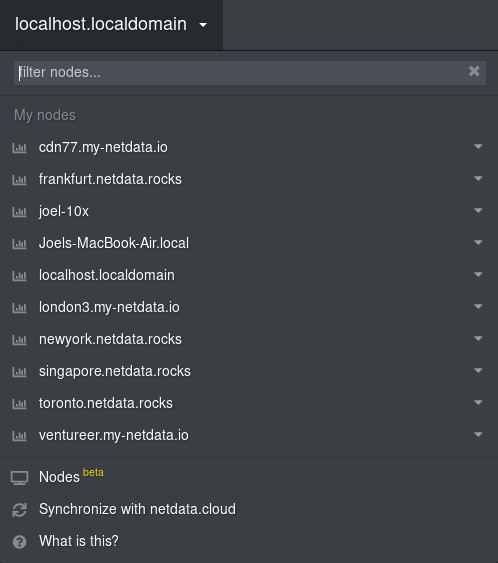 The nodes menu will also show the master netdata node and all slave nodes -streaming to that master, if you have [configured streaming](../../streaming). +streaming to that master, if you have [configured streaming](/streaming/README.md). 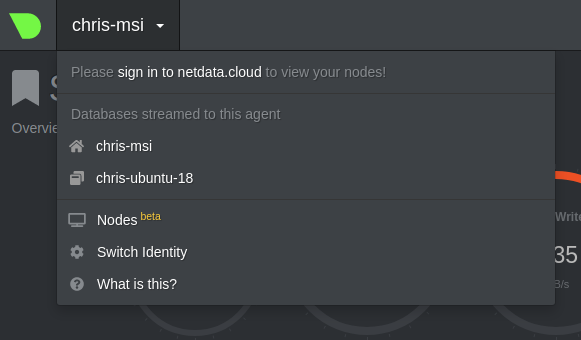 @@ -132,8 +132,7 @@ If you want to customize this information, you should avoid editing overwrite the file when it's updated. Instead, you should create a new file with your customizations. -We created an example file at -[`dashboard_info_custom_example.js`](dashboard_info_custom_example.js). You can +We created an example file at `dashboard_info_custom_example.js`. You can copy this to a new file with a name of your choice in the `web/` directory. This directory changes based on your operating system and installation method. If you're on a Linux system, it should be at `/usr/share/netdata/web/`. @@ -171,7 +170,7 @@ file](https://user-images.githubusercontent.com/1153921/62798924-570e6c80-ba94-1 ## Custom dashboards -For information on creating custom dashboards from scratch, see the [custom -dashboards](custom/) or [Atlassian Confluence dashboards](confluence/) guides. +For information on creating custom dashboards from scratch, see the [custom dashboards](/web/gui/custom/README.md) or +[Atlassian Confluence dashboards](/web/gui/confluence/README.md) guides. []() diff --git a/web/gui/confluence/README.md b/web/gui/confluence/README.md index efddd9f2d6..0547abbfd4 100644 --- a/web/gui/confluence/README.md +++ b/web/gui/confluence/README.md @@ -85,7 +85,9 @@ Hit **update** and you will get this: This badge is now auto-refreshing. It will update itself based on the update frequency of the alarm. -> Keep in mind you can add badges with custom Netdata queries too. Netdata automatically creates badges for all the alarms, but every chart, every dimension on every chart, can be used for a badge. And Netdata badges are quite powerful! Check [Creating Badges](../../api/badges/) for more information on badges. +> Keep in mind you can add badges with custom Netdata queries too. Netdata automatically creates badges for all the +> alarms, but every chart, every dimension on every chart, can be used for a badge. And Netdata badges are quite +> powerful! Check [Creating Badges](/web/api/badges/README.md) for more information on badges. So, let's create a table and add this badge for both our web servers: diff --git a/web/gui/custom/README.md b/web/gui/custom/README.md index 1280730e37..94f2181d32 100644 --- a/web/gui/custom/README.md +++ b/web/gui/custom/README.md @@ -17,16 +17,16 @@ You can: You can also add Netdata charts to existing web pages. -Check this **[very simple working example of a custom -dashboard](http://netdata.firehol.org/demo.html)**, and its **[html -source](../demo.html)**. +Check this **[very simple working example of a custom dashboard](http://netdata.firehol.org/demo.html)**, and its +**[html source](https://raw.githubusercontent.com/netdata/netdata/master/web/gui/demo.html)**. You should also look at the [custom dashboard template](https://my-netdata.io/dashboard.html), which contains samples of all -supported charts. The code is [here](../dashboard.html). +supported charts. The code is [here](https://raw.githubusercontent.com/netdata/netdata/master/web/gui/dashboard.html). -If you plan to put the dashboard on TV, check out [tv.html](../tv.html). Here's -is a screenshot of it, monitoring two servers on the same page: +If you plan to put the dashboard on TV, check out +[tv.html](https://raw.githubusercontent.com/netdata/netdata/master/web/gui/tv.html). Here's is a screenshot of it, +monitoring two servers on the same page:  @@ -301,9 +301,8 @@ Each chart can get data from a different Netdata server. You can specify the Net ></div> ``` -If you have ephemeral monitoring setup ([More info -here](../../../streaming/#monitoring-ephemeral-nodes)) and have no direct access -to the nodes dashboards, you can use the following: +If you have ephemeral monitoring setup ([More info here](/streaming/README.md#monitoring-ephemeral-nodes)) and have no +direct access to the nodes dashboards, you can use the following: ```html <div data-netdata="unique.id" @@ -426,7 +425,7 @@ select specific dimensions using this: ``` Netdata supports coma (`,`) or pipe (`|`) separated [simple -patterns](../../../libnetdata/simple_pattern/) for dimensions. By default it +patterns](/libnetdata/simple_pattern/README.md) for dimensions. By default it searches for both dimension IDs and dimension NAMEs. You can control the target of the match with: `data-append-options="match-ids"` or `data-append-options="match-names"`. Spaces in `data-dimensions=""` are matched @@ -494,7 +493,7 @@ it, using this: ### API options -You can append Netdata **[REST API v1](../../api)** data options, using this: +You can append Netdata **[REST API v1](/web/api/README.md)** data options, using this: ```html <div data-netdata="unique.id" diff --git a/web/server/README.md b/web/server/README.md index 4a41cfdb4f..9c7e8e137f 100644 --- a/web/server/README.md +++ b/web/server/README.md @@ -48,7 +48,7 @@ Using the above, Netdata will bind to: - IPv4 127.0.0.1 at port 19999 (port was used from `default port`). Only the UI (dashboard) and the read API will be accessible on this port. Both HTTP and HTTPS requests will be accepted. - IPv4 10.1.1.1 at port 19998. The management API and `netdata.conf` will be accessible on this port. - All the IPs `hostname` resolves to (both IPv4 and IPv6 depending on the resolved IPs) at port 19997. Only badges will be accessible on this port. -- All IPv6 IPs at port 19996. Only metric streaming requests from other Netdata agents will be accepted on this port. Only encrypted streams will be allowed (i.e. slaves also need to be [configured for TLS](../../streaming). +- All IPv6 IPs at port 19996. Only metric streaming requests from other Netdata agents will be accepted on this port. Only encrypted streams will be allowed (i.e. slaves also need to be [configured for TLS](/streaming/README.md). - All the IPs `localhost` resolves to (both IPv4 and IPv6 depending the resolved IPs) at port 19996. This port will only accept registry API requests. - All IPv4 and IPv6 IPs at port `http` as set in `/etc/services`. Only the UI (dashboard) and the read API will be accessible on this port. - Unix domain socket `/run/netdata/netdata.sock`. All requests are serviceable on this socket. Note that in some OSs like Fedora, every service sees a different `/tmp`, so don't create a Unix socket under `/tmp`. `/run` or `/var/run` is suggested. @@ -132,7 +132,7 @@ Example: bind to = *=dashboard|registry|badges|management|streaming|netdata.conf^SSL=force ``` -For information how to configure the slaves to use TLS, check [securing the communication](../../streaming#securing-streaming-communications) in the streaming documentation. There you will find additional details on the expected behavior for client and server nodes, when their respective TLS options are enabled. +For information how to configure the slaves to use TLS, check [securing the communication](/streaming/README.md#securing-streaming-communications) in the streaming documentation. There you will find additional details on the expected behavior for client and server nodes, when their respective TLS options are enabled. When we define the use of SSL in a Netdata agent for different ports, Netdata will apply the behavior specified on each port. For example, using the configuration line below: @@ -182,13 +182,13 @@ Netdata supports access lists in `netdata.conf`: - `allow badges from` checks if the API request is for a badge. Badges are not matched by `allow dashboard from`. - `allow streaming from` checks if the slave willing to stream metrics to this Netdata is allowed. - This can be controlled per API KEY and MACHINE GUID in [stream.conf](../../streaming/stream.conf). - The setting in `netdata.conf` is checked before the ones in [stream.conf](../../streaming/stream.conf). + This can be controlled per API KEY and MACHINE GUID in `stream.conf`. + The setting in `netdata.conf` is checked before the ones in `stream.conf`. - `allow netdata.conf from` checks the IP to allow `http://netdata.host:19999/netdata.conf`. The IPs listed are all the private IPv4 addresses, including link local IPv6 addresses. Keep in mind that connections to Netdata API ports are filtered by `allow connections from`. So, IPs allowed by `allow netdata.conf from` should also be allowed by `allow connections from`. -- `allow management from` checks the IPs to allow API management calls. Management via the API is currently supported for [health](../api/health/#health-management-api) +- `allow management from` checks the IPs to allow API management calls. Management via the API is currently supported for [health](/web/api/health/README.md#health-management-api) In order to check the FQDN of the connection without opening the Netdata agent to DNS-spoofing, a reverse-dns record must be setup for the connecting host. At connection time the reverse-dns of the peer IP address is resolved, and @@ -214,14 +214,14 @@ present that may match DNS FQDNs. |setting|default|info| |:-----:|:-----:|:---| -|ses max window|`15`|See [single exponential smoothing](../api/queries/des/)| -|des max window|`15`|See [double exponential smoothing](../api/queries/des/)| +|ses max window|`15`|See [single exponential smoothing](/web/api/queries/des/README.md)| +|des max window|`15`|See [double exponential smoothing](/web/api/queries/des/README.md)| |listen backlog|`4096`|The port backlog. Check `man 2 listen`.| |web files owner|`netdata`|The user that owns the web static files. Netdata will refuse to serve a file that is not owned by this user, even if it has read access to that file. If the user given is not found, Netdata will only serve files owned by user given in `run as user`.| |web files group|`netdata`|If this is set, Netdata will check if the file is owned by this group and refuse to serve the file if it's not.| |disconnect idle clients after seconds|`60`|The time in seconds to disconnect web clients after being totally idle.| |timeout for first request|`60`|How long to wait for a client to send a request before closing the socket. Prevents slow request attacks.| -|accept a streaming request every seconds|`0`|Can be used to set a limit on how often a master Netdata server will accept streaming requests from the slaves in a [streaming and replication setup](../../streaming)| +|accept a streaming request every seconds|`0`|Can be used to set a limit on how often a master Netdata server will accept streaming requests from the slaves in a [streaming and replication setup](/streaming/README.md)| |respect do not track policy|`no`|If set to `yes`, will respect the client's browser preferences on storing cookies.| |x-frame-options response header||[Avoid clickjacking attacks, by ensuring that the content is not embedded into other sites](https://developer.mozilla.org/en-US/docs/Web/HTTP/Headers/X-Frame-Options).| |enable gzip compression|`yes`|When set to `yes`, Netdata web responses will be GZIP compressed, if the web client accepts such responses.| |