
diff options
| author | Joel Hans <joel@netdata.cloud> | 2020-05-14 06:50:01 -0700 |
|---|---|---|
| committer | GitHub <noreply@github.com> | 2020-05-14 06:50:01 -0700 |
| commit | 9d712b513566f1f90f6031f16c25953c5d836891 (patch) | |
| tree | 9aa1340a8b3529271941ce7cb809bbc65c42453a /web | |
| parent | 4609d5b3dd1ad4d26daae52aaa5bda1948be288e (diff) | |
Docs: Remove old Cloud/dashboard and replace with new Cloud/dashboard (#8874)
* Add options to daemon, clean up claiming
* Caught one more old conf
* Remove cloud docs
* I did a lot of things
* Rewrite tutorial step 3
* Remove my nodes menu, sync what-is-netdata
* Restore ACLK/claim/daemon docs to be handled by docs-go-live
* Fix up what-is-netdata
* More cleanup of README/what-is-netdata
* Restore daemon/config/README.md
* Fix frontmatter
* Change title, fix broken link
* Copyediting fixes
* Remove symbols
* Add a few more GIFs
* Fix hash
* Fix other hash
* Fix wording in web gui
* Address Andrew's and Jacek's comments
Diffstat (limited to 'web')
| -rw-r--r-- | web/README.md | 20 | ||||
| -rw-r--r-- | web/gui/README.md | 88 |
2 files changed, 47 insertions, 61 deletions
diff --git a/web/README.md b/web/README.md index 59c90c6ff6..fe4be00d0c 100644 --- a/web/README.md +++ b/web/README.md @@ -50,8 +50,7 @@ forward or backward in time, or selecting a specific timeframe for more in-depth analysis. Whenever you use a chart in this way, Netdata synchronizes all the other charts -to match it. Chart synchronization even works between separate Netdata agents if you connect -them using the [**My nodes** menu](/registry/README.md)! +to match it. You can change how charts show their metrics in a few different ways, each of which have a few methods: @@ -66,14 +65,19 @@ which have a few methods: Here's how chart synchronization looks while zooming and panning: - + You can also perform all these actions using the small rewind/play/fast-forward/zoom-in/zoom-out buttons that appear in the bottom-right corner of each chart. +Additionally, resize charts by clicking-and-dragging the icon on the bottom-right corner of any chart. To restore the +chart to its original height, double-click the same icon. + + + ## Charts, contexts, families Before customizing the standard web dashboard, creating a custom dashboard, @@ -191,7 +195,8 @@ To improve clarity on charts, Netdata dashboards present **positive** values for metrics representing `read`, `input`, `inbound`, `received` and **negative** values for metrics representing `write`, `output`, `outbound`, `sent`. - + _Netdata charts showing the bandwidth and packets of a network interface. `received` is positive and `sent` is negative._ @@ -201,7 +206,8 @@ _Netdata charts showing the bandwidth and packets of a network interface. Netdata charts automatically zoom vertically, to visualize the variation of each metric within the visible timeframe. - + _A zero-based `stacked` chart, automatically switches to an auto-scaled `area` chart when a single dimension is selected._ diff --git a/web/gui/README.md b/web/gui/README.md index 3b0eb08977..8e541164bd 100644 --- a/web/gui/README.md +++ b/web/gui/README.md @@ -1,25 +1,30 @@ <!-- --- title: "The standard web dashboard" -date: 2020-03-11 +date: 2020-05-04 custom_edit_url: https://github.com/netdata/netdata/edit/master/web/gui/README.md --- --> # The standard web dashboard -The standard web dashboard is the heart of Netdata's performance troubleshooting -toolkit. You've probably seen it before: +The standard web dashboard is the heart of Netdata's performance troubleshooting toolkit. You've probably seen it +before: - + Learn more about how dashboards work and how they're populated using the `dashboards.js` file in our [web dashboards overview](/web/README.md). -By default, Netdata starts a web server for its dashboard at port `19999`. Open -up your web browser of choice and navigate to `http://SERVER-IP:19999`, or -`http://localhost:19999` on `localhost`. +By default, Netdata starts a web server for its dashboard at port `19999`. Open up your web browser of choice and +navigate to `http://NODE:19999`, replacing `NODE` with the IP address or hostname of your Agent. If you're unsure, try +`http://localhost:19999` first. + +> In v1.21 of the Agent, we replaced the legacy dashboard with a refactored dashboard written in React. By using React, +> we simplify our code and give our engineers better tools to add new features and fix bugs. The only UI change with +> this dashboard is the top navigation and left-hand navigation for [Cloud integration](/docs/agent-cloud.md). The old +> dashboard is still accessible at the `http://NODE:19999/old` subfolder. Netdata uses an [internal, static-threaded web server](/web/server/README.md) to host the HTML, CSS, and JavaScript files that make up the standard dashboard. You don't @@ -27,26 +32,16 @@ have to configure anything to access it, although you can adjust [your settings](/web/server/README.md#other-netdataconf-web-section-options) in the `netdata.conf` file, or run Netdata behind an Nginx proxy, and so on. -<details markdown="1"><summary>Want to see the dashboard and its features in action? Check out our video.</summary> -<iframe width="720" height="405" src="https://www.youtube.com/embed/Ob6-Wkb6ZBA" frameborder="0" allow="accelerometer; autoplay; encrypted-media; gyroscope; picture-in-picture" allowfullscreen></iframe> -</details> - -## New React Dashboard - -We've been working on refactoring the standard dashboard code to simplify the process of adding new features and fixing bugs. - -The new dashboard is added to the codebase, but the old version is still here. If you want to use it, run `/usr/libexec/netdata/netdata-switch-dashboard.sh classic`. To switch back, do `netdata-switch-dashboard.sh react`. Currently, the refactored dashboard doesn't include any noticeable changes in UI. - ## Navigating the standard dashboard Beyond charts, the standard dashboard can be broken down into three key areas: 1. [**Sections**](#sections) -2. [**Menus/submenus**](#menus) -3. [**Nodes menu**](#nodes-menu) +2. [**Metrics menus/submenus**](#metrics-menus) +3. [**Cloud menus: Spaces, War Rooms, and Visited nodes)**](#cloud-menus-spaces-war-rooms-and-visited-nodes) 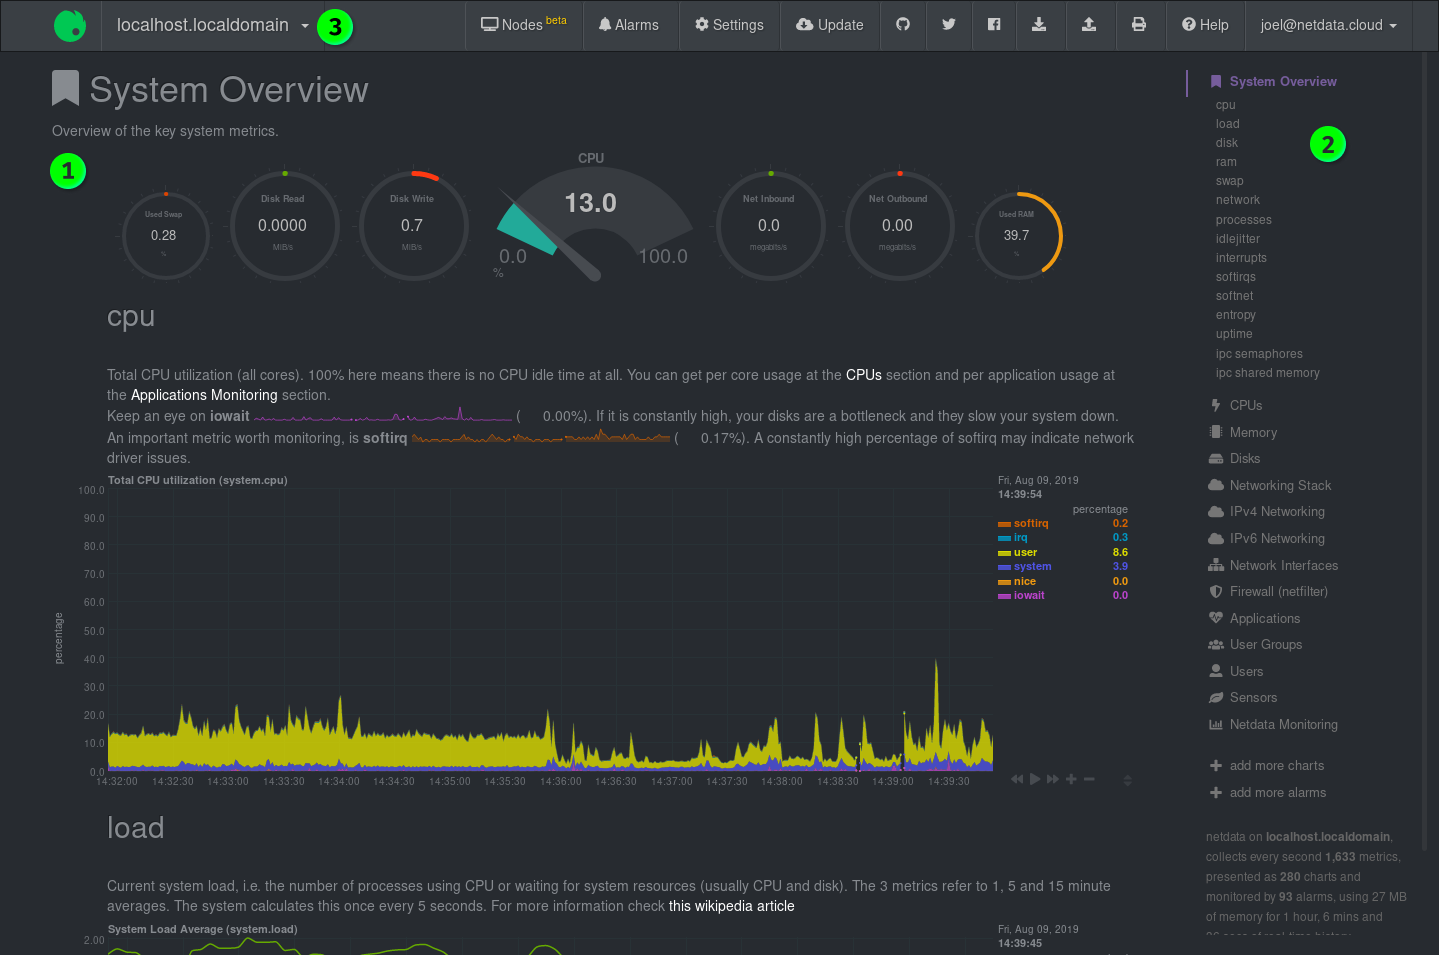 +dashboard](https://user-images.githubusercontent.com/1153921/80834497-ac9c2380-8ba5-11ea-83c4-b323dd89557f.png) ### Sections @@ -58,56 +53,41 @@ broken down into [contexts](/web/README.md#contexts) and An example of the **Memory** section on a Linux desktop system. 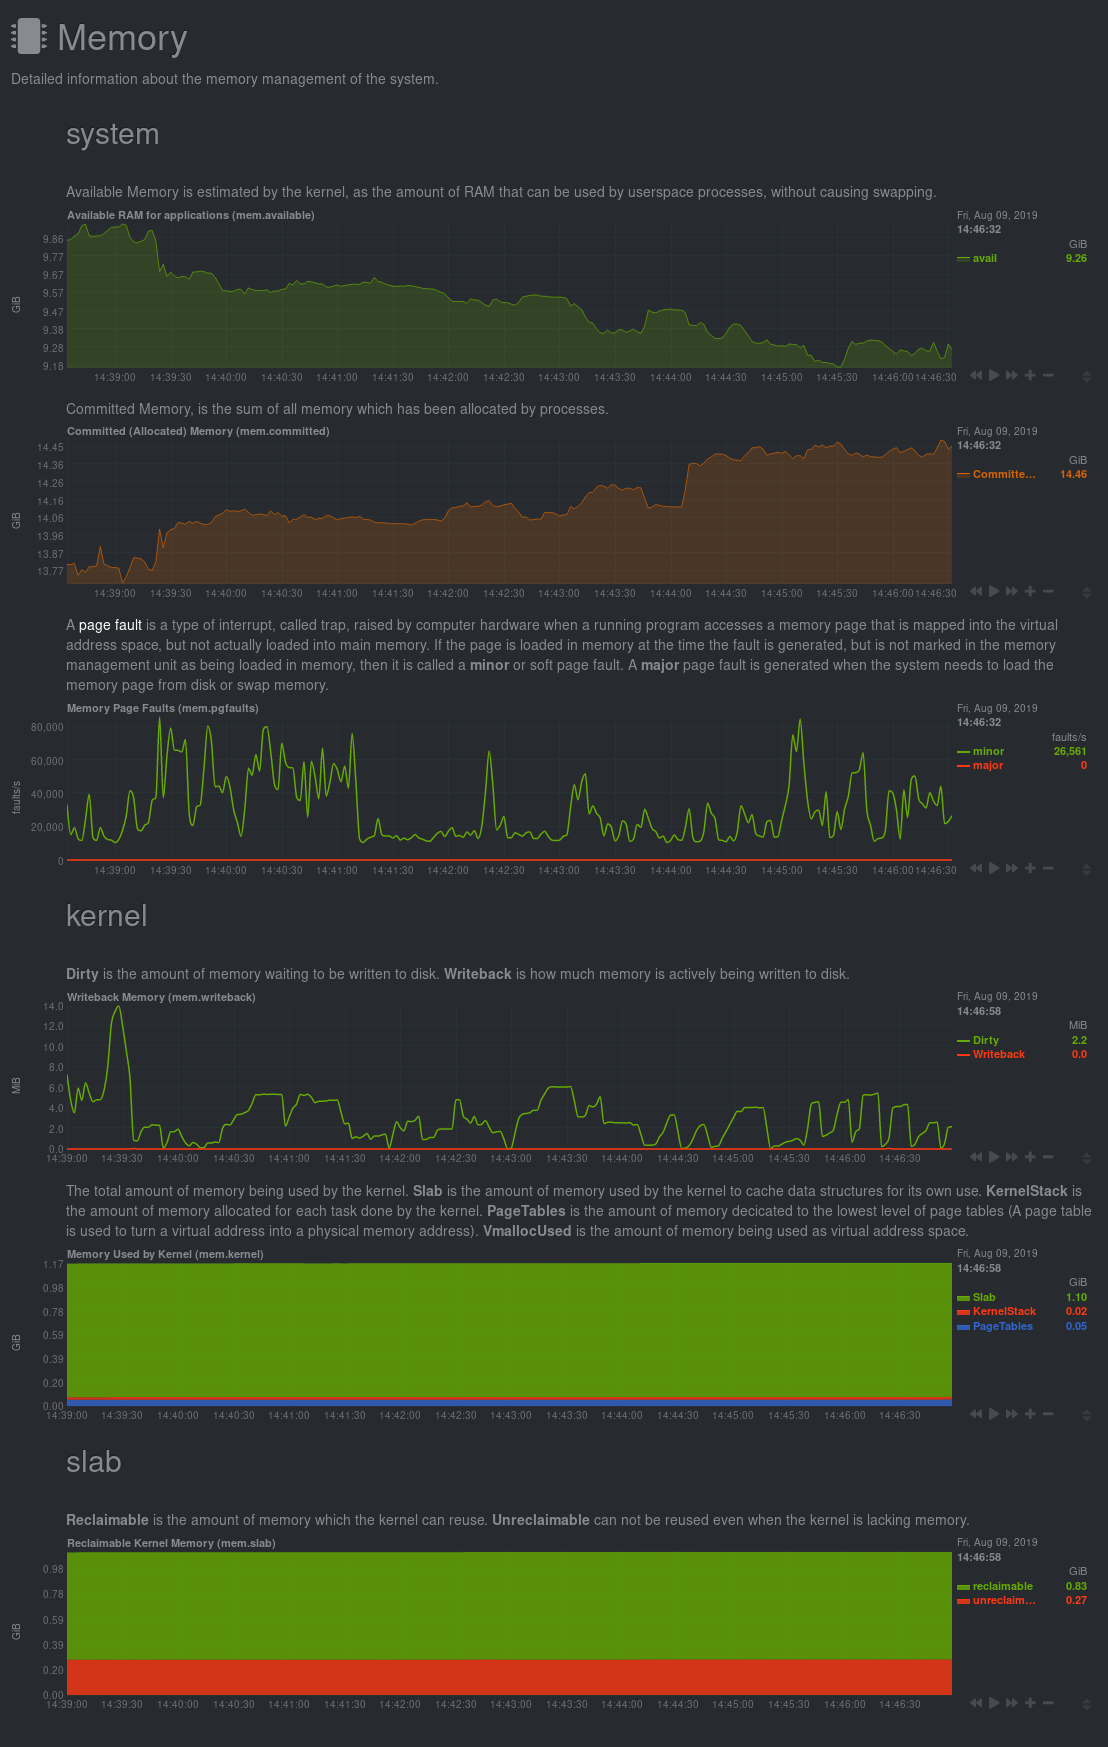 +dashboard](https://user-images.githubusercontent.com/1153921/80834530-bcb40300-8ba5-11ea-9219-cd554577844e.png) All sections and their associated charts appear on a single "page," so all you need to do to view different sections is scroll up and down the page. But it's -usually quicker to use the [menus](#menus). +usually quicker to use the [menus](#metrics-menus). -### Menus +### Metrics menus -**Menus** appears on the right-hand side of the standard dashboard. Netdata -generates a menu for each section, and menus link to the section they're -associated with. +**Metrics menus** appears on the right-hand side of the standard dashboard. Netdata generates a menu for each section, +and menus link to the section they're associated with. -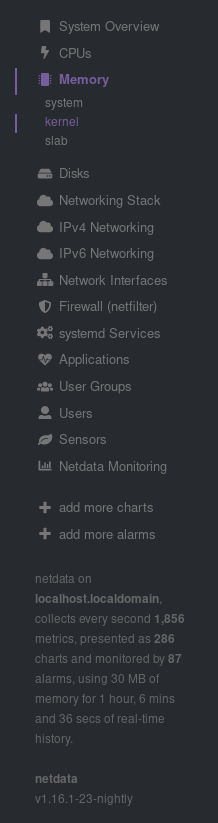 +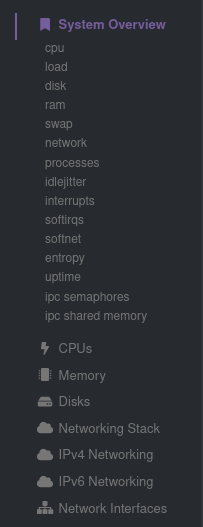 -Most menu items will contain several **submenu** entries, which represent any +Most metrics menu items will contain several **submenu** entries, which represent any [families](/web/README.md#families) from that section. Netdata automatically generates these submenu entries. Here's a **Disks** menu with several submenu entries for each disk drive and partition Netdata recognizes. -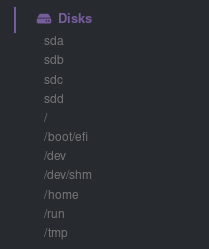 - -### Nodes menu - -The nodes menu appears in the top-left corner of the standard dashboard and is -labeled with the hostname of the system Netdata is monitoring. - -Clicking on it will display a drop-down menu of any nodes you might have -connected via the [Netdata registry](/registry/README.md). By default, you'll find -nothing under the **My nodes** heading, but you can try out any of the demo -Netdata nodes to see how the nodes menu works. - -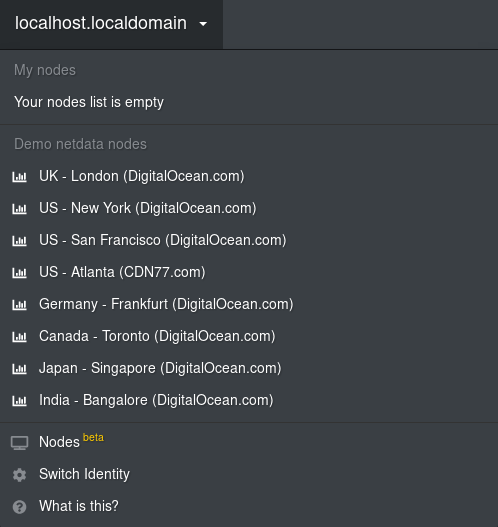 +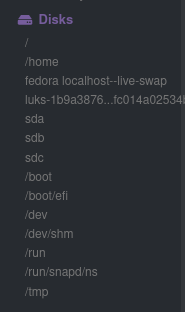 -Once you add nodes via [Netdata Cloud](/docs/netdata-cloud/README.md) or a [private -registry](/registry/README.md#run-your-own-registry), you will see them appear under -the **My nodes** heading. +### Cloud menus (Spaces, War Rooms, and Visited nodes) -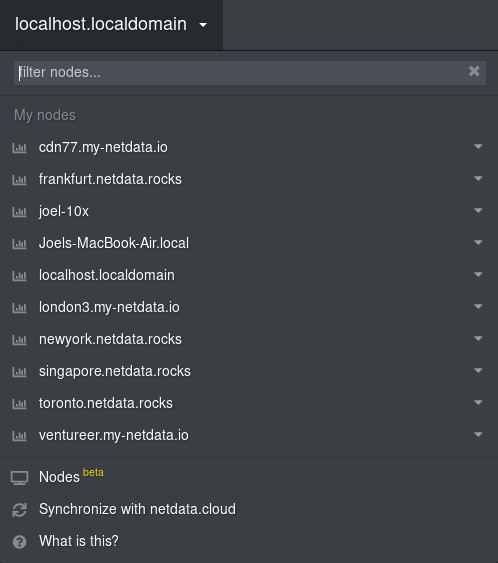 +The dashboard also features a menu related to Cloud functionality. You can view your existing Spaces or create new ones +via the vertical column of boxes. This menu also displays the name of your current Space, shows a list of any War Rooms +you've added you your Space, and lists your Visited nodes. If you click on a War Room's name, the dashboard redirects +you to the Netdata Cloud web interface. -The nodes menu will also show the master netdata node and all slave nodes -streaming to that master, if you have [configured streaming](/streaming/README.md). +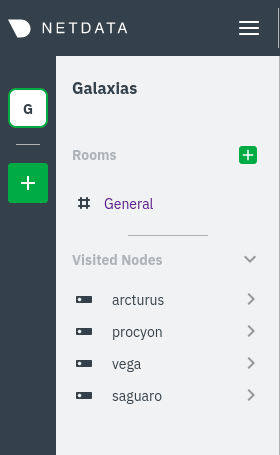 -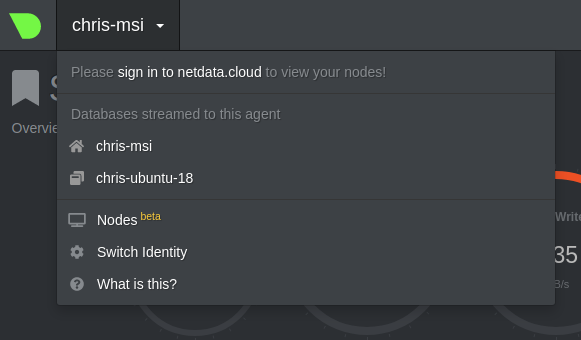 +If you want to know more about how Cloud populates this menu, and the Agent-Cloud integration at a high level, see our +document on [using the Agent with Netdata Cloud](/docs/agent-cloud.md). ## Customizing the standard dashboard |