
diff options
| author | Joel Hans <joel@netdata.cloud> | 2019-09-04 17:04:07 -0700 |
|---|---|---|
| committer | GitHub <noreply@github.com> | 2019-09-04 17:04:07 -0700 |
| commit | 89e71c474c865da29415b68b03795221721c72de (patch) | |
| tree | 9c8d713885cbfc7fb3f621eee53b424229a4de97 /web | |
| parent | 8ece9b0932a9e5ed94581e984e6947378d32b17e (diff) | |
Add high level explanation of dashboard contents (#6648)
* Moved content about charts/families/contexts to web
* Working on dashboard docs
* Working on dashboard docs
* Improvements to charts, families, contexts
* Working more on dashboard overview
* More improvements to web dashboards docs
* Fixing broken links
* More fixes to the dashboard areas
* Grammar check on revised docs
* Fixing broken table
* Addressing Chris' comments
* Addressing Cosmix's comments plus a few additions
* Fixing lint issues
* Fixing linter errors and re-adding lost links
* Addressing Cosmix' requests
* Fixing context issue
Diffstat (limited to 'web')
| -rw-r--r-- | web/README.md | 228 | ||||
| -rw-r--r-- | web/gui/README.md | 207 | ||||
| -rw-r--r-- | web/gui/custom/README.md | 447 |
3 files changed, 651 insertions, 231 deletions
diff --git a/web/README.md b/web/README.md index fc230f51de..2636323afa 100644 --- a/web/README.md +++ b/web/README.md @@ -1,28 +1,228 @@ # Web dashboards overview -The default port is 19999; for example, to access the dashboard on localhost, use: <http://localhost:19999> +Because Netdata is a health monitoring and _performance troubleshooting_ system, +we put a lot of emphasis on real-time, meaningful, and context-aware charts. -To view Netdata collected data you access its **[REST API v1](api/)**. +We bundle Netdata with a dashboard and hundreds of charts, designed by both our +team and the community, but you can also customize them yourself. -For our convenience, Netdata provides 2 more layers: +There are two primary ways to view Netdata's dashboards: -1. The `dashboard.js` javascript library that allows us to design custom dashboards using plain HTML. For information on creating custom dashboards, see **[Custom Dashboards](gui/custom/)** and **[Atlassian Confluence Dashboards](gui/confluence/)** +1. The [standard web dashboard](gui/) that comes pre-configured with every + Netdata installation. You can see it at `http://SERVER-IP:19999`, or + `http://localhost:19999` on `localhost`. You can customize the contents and + colors of the standard dashboard [using + JavaScript](gui/#customizing-the-standard-dashboard). -2. Ready to be used web dashboards that render all the charts a Netdata server maintains. +2. The [`dashboard.js` JavaScript library](#dashboardjs), which helps you + [customize the standard dashboards](gui/#customizing-the-standard-dashboard) + using JavaScript, or create entirely new [custom dashboards](gui/custom/) or + [Atlassian Confluence dashboards](gui/confluence/). -## Customizing the standard dashboards +You can also view all the data Netdata collects through the [REST API v1](api/). -Charts information is stored at /usr/share/netdata/web/[dashboard_info.js](gui/dashboard_info.js). This file includes information that is rendered on the dashboard, controls chart colors, section and subsection heading, titles, etc. +No matter where you use Netdata's charts, you'll want to know how to +[use](#using-charts) them. You'll also want to understand how Netdata defines +[charts](#charts), [dimensions](#dimensions), [families](#families), and +[contexts](#contexts). -If you change that file, your changes will be overwritten when Netdata is updated. You can preserve your settings by creating a new such file (there is /usr/share/netdata/web/[dashboard_info_custom_example.js](gui/dashboard_info_custom_example.js) you can use to start with). +## Using charts -You have to copy the example file under a new name, so that it will not be overwritten with Netdata updates. +Netdata's charts are far from static. They are interactive, real-time, and work +with your mouse, touchpad, or touchscreen! -To configure your info file set in `netdata.conf`: +Hover over any chart to temporarily pause it and see the exact values presented +as different [dimensions](#dimensions). Click or tap stop the chart from automatically updating with new metrics, thereby locking it to a single timeframe. + + +You can change how charts show their metrics by zooming in or out, moving +forward or backward in time, or selecting a specific timeframe for more in-depth +analysis. + +Whenever you use a chart in this way, Netdata synchronizes all the other charts +to match it. Chart synchronization even works between separate Netdata agents if you connect +them using the [node menu](../registry)! + +You can change how charts show their metrics in a few different ways, each of +which have a few methods: + +| Manipulation | Method #1 | Method #2 | Method #3 | +|--- |--- |--- |--- | +| **Reset** charts to default auto-refreshing state | `double click` | `double tap` (touchpad/touchscreen) | | +| **Select** a certain timeframe | `ALT` + `mouse selection` | `⌘` + `mouse selection` (macOS) | | +| **Pan** forward or back in time | `click and drag` | `touch and drag` (touchpad/touchscreen) | | +| **Zoom** to a specific timeframe | `SHIFT` + `mouse selection` | | | +| **Zoom** in/out | `SHIFT`/`ALT` + `mouse scrollwheel` | `SHIFT`/`ALT` + `two-finger pinch` (touchpad/touchscreen) | `SHIFT`/`ALT` + `two-finger scroll` (touchpad/touchscreen) | + +Here's how chart synchronization looks while zooming and panning: + + + +You can also perform all these actions using the small +rewind/play/fast-forward/zoom-in/zoom-out buttons that appear in the +bottom-right corner of each chart. + +## Charts, contexts, families + +Before customizing the standard web dashboard, creating a custom dashboard, +configuring an alarm, or writing a collector, it's crucial to understand how +Netdata organizes metrics into charts, dimensions, families, and contexts. + +### Charts + +A **chart** is an individual, interactive, always-updating graphic displaying +one or more collected/calculated metrics. Charts are generated by +[collectors](../collectors/). + +Here's the system CPU chart, the first chart displayed on the standard +dashboard: + +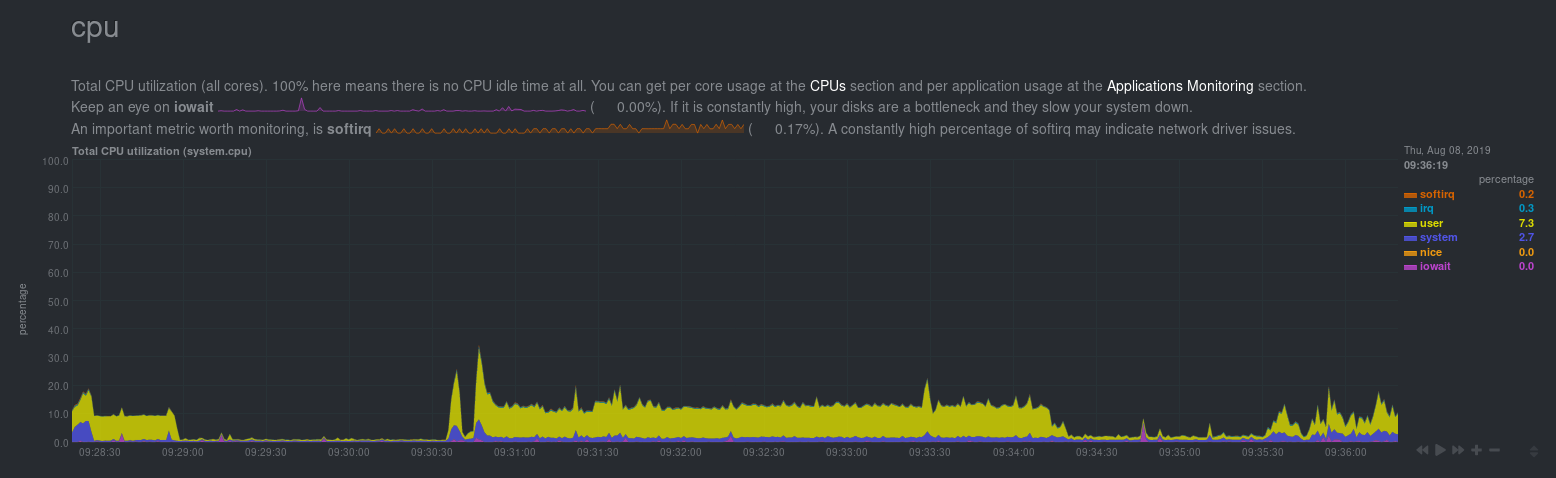 + +Netdata displays a chart's name in parentheses above the chart. For example, if +you navigate to the system CPU chart, you'll see the label: **Total CPU +utilization (system.cpu)**. In this case, the chart's name is `system.cpu`. +Netdata derives the name from the chart's [context](#contexts). + +### Dimensions + +A **dimension** is a value that gets shown on a chart. The value can be raw data +or calculated values, such as percentages, aggregates, and more. + +Charts are capable of showing more than one dimension. Netdata shows these +dimensions on the right side of the chart, beneath the date and time. Again, the +`system.cpu` chart will serve as a good example. + +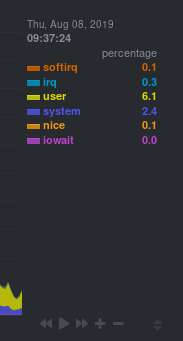 + +Here, the `system.cpu` chart is showing many dimensions, such as `user`, +`system`, `softirq`, `irq`, and more. + +Note that other applications sometimes use the word _series_ instead of +_dimension_. + +### Families + +A **family** is _one_ instance of a monitored hardware or software resource that +needs to be monitored and displayed separately from similar instances. + +For example, if your system has multiple disk drives at `sda` and `sdb`, Netdata +will put each interface into their own family. Same goes for software resources, +like multiple MySQL instances. We call these instances "families" because the +charts associated with a single disk instance, for example, are often related to +each other. Relatives, family... get it? + +When relevant, Netdata prefers to organize charts by family. When you visit the +**Disks** section, you will see your disk drives organized into families, and +each family will have one or more charts: `disk`, `disk_ops`, `disk_backlog`, +`disk_util`, `disk_await`, `disk_avgsz`, `disk_svctm`, `disk_mops`, and +`disk_iotime`. + +In the screenshot below, the disk family `sdb` shows a few gauges, followed by a +few of the associated charts: + +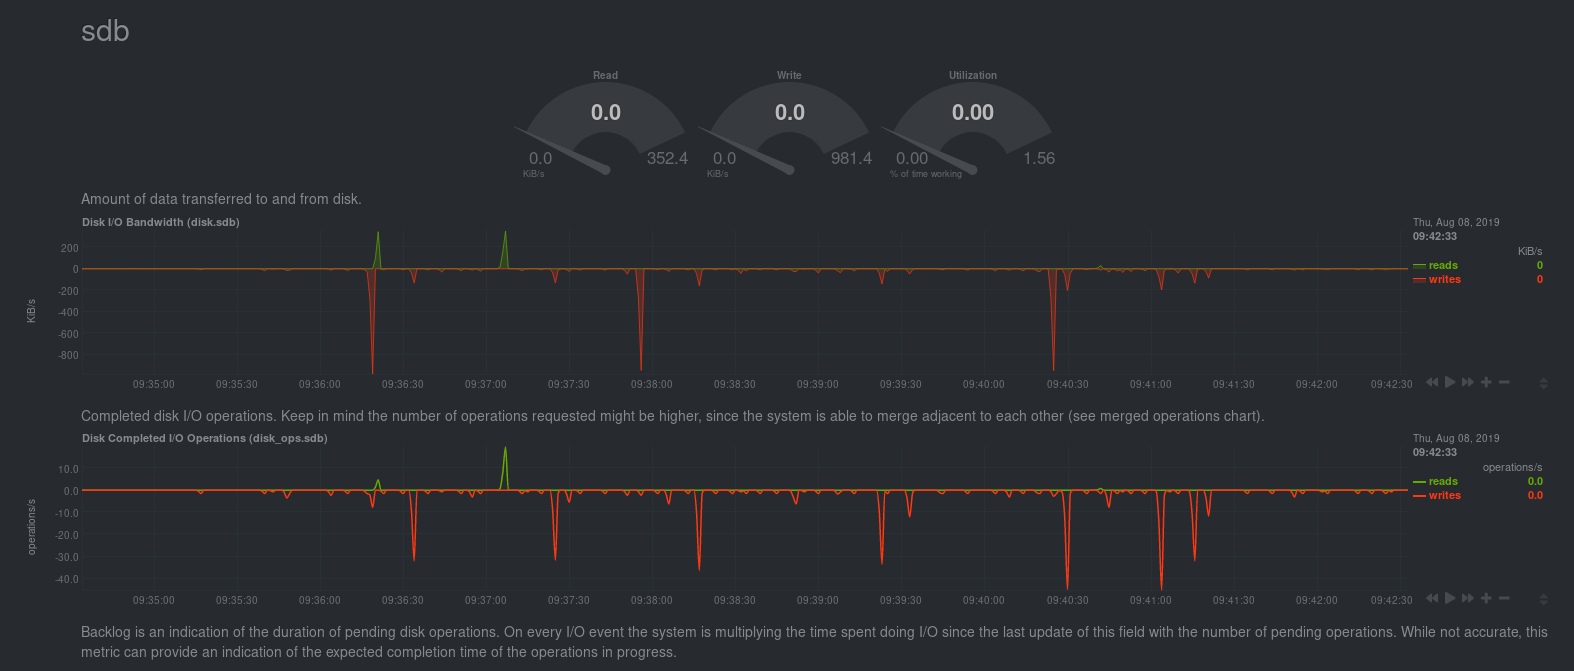 + +Netdata also creates separate submenu entries for each family in the right +navigation page so you can easily navigate to the instance you're interested in. +Here, Netdata has made several submenus under the **Disk** menu. + +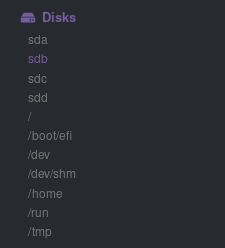 + +### Contexts + +A **context** is a way of grouping charts by the types of metrics collected and +dimensions displayed. Different charts with the same context will show the same +dimensions, but for different instances (families) of hardware/software +resources. + +For example, the **Disks** section will often use many contexts (`disk.io`, +`disk.ops`, `disk.backlog`, `disk.util`, and so on). Netdata then creates an +individual chart for each context, and groups them by family. + +Netdata names charts according to their context according to the following +structure: `[context].[family]`. A chart with the `disk.util` context, in the +`sdb` family, gets the name `disk_util.sdb`. Netdata shows that name in the +top-left corner of a chart. + +Given the four example contexts, and two families of `sdb` and `sdd`, Netdata +will create the following charts and their names: + +Context | `sdb` family | `sdd` family +--- | --- | --- +`disk.io` | `disk_io.sdb` | `disk_io.sdd` +`disk.ops` | `disk_ops.sdb` | `disk_ops.sdd` +`disk.backlog` | `disk_backlog.sdb` | `disk_backlog.sdd` +`disk.util` | `disk_util.sdb` | `disk_util.sdd` + +And here's what two of those charts in the `disk.io` context look like under +`sdb` and `sdd` families: + +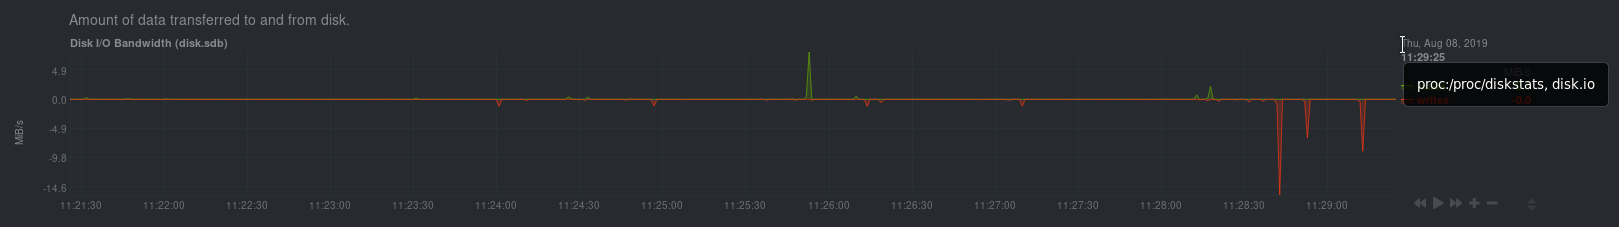 +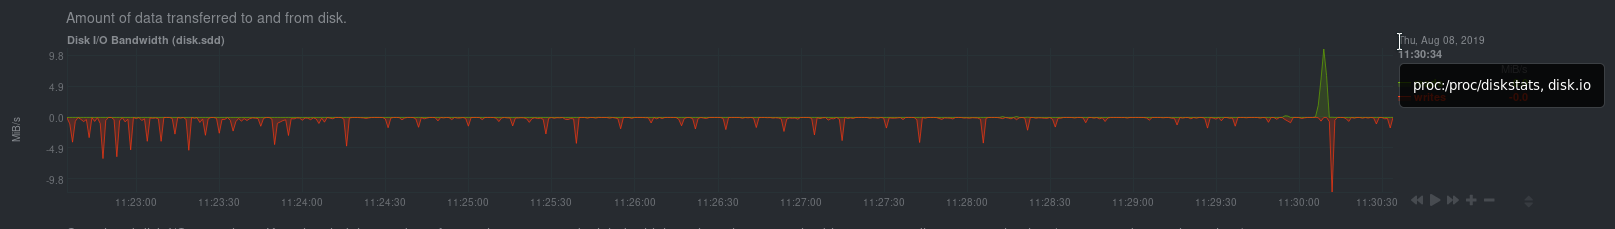 + +As you can see in the screenshot, you can view the context of a chart if you +hover over the date above the list of dimensions. A tooltip will appear that +shows you two pieces of information: the collector that produces the chart, and +the chart's context. + +Netdata also uses [contexts for alarm +templates](../health/#alarm-line-on). You can create an +alarm for the `net.packets` context to receive alerts for any chart with that +context, no matter which family it's attached to. + +## Positive and negative values on charts + +To improve clarity on charts, Netdata dashboards present **positive** values for +metrics representing `read`, `input`, `inbound`, `received` and **negative** +values for metrics representing `write`, `output`, `outbound`, `sent`. + + + +_Netdata charts showing the bandwidth and packets of a network interface. +`received` is positive and `sent` is negative._ + +## Autoscaled y-axis + +Netdata charts automatically zoom vertically, to visualize the variation of each +metric within the visible timeframe. + + + +_A zero-based `stacked` chart, automatically switches to an auto-scaled `area` +chart when a single dimension is selected._ + +## dashboard.js + +Netdata uses the `dashboards.js` file to define, configure, create, and update +all the charts and other visualizations that appear on any Netdata dashboard. +You need to put `dashboard.js` on any HTML page that's going to render Netdata +charts. + +The [custom dashboards documentation](gui/custom/) contains examples of such +custom HTML pages. + +### Generating dashboard.js + +We build the `dashboards.js` file by concatenating all the source files located +in the `web/gui/src/dashboard.js/` directory. That's done using the provided +build script: + +```sh +cd web/gui +make ``` -[web] - custom dashboard_info.js = your_file_name.js -``` -[](<>) +If you make any changes to the `src` directory when developing Netdata, you +should regenerate the `dashboard.js` file before you commit to the Netdata +repository. + +[]() diff --git a/web/gui/README.md b/web/gui/README.md index 26ef59bc54..876d499fc5 100644 --- a/web/gui/README.md +++ b/web/gui/README.md @@ -1,118 +1,159 @@ -# Netdata agent web GUI +# The standard web dashboard -## Generating dashboard.js +The standard web dashboard is the heart of Netdata's performance troubleshooting +toolkit. You've probably seen it before: -The monolithic `dashboards.js` file is automatically generated by concatenating the source files located in the `web/gui/src/dashboard.js/` directory by running the build script: + -```sh -cd web/gui -make -``` +Learn more about how dashboards work and how they're populated using the +`dashboards.js` file in our [web dashboards overview](../README.md). -After every change in the `src` directory, the `dashboard.js` file should be regenerated and commited to the repository. +By default, Netdata starts a web server for its dashboard at port `19999`. Open +up your web browser of choice and navigate to `http://SERVER-IP:19999`, or +`http://localhost:19999` on `localhost`. -## Custom Dashboards +Netdata uses an [internal, static-threaded web server](../server/) to host the +HTML, CSS, and JavaScript files that make up the standard dashboard. You don't +have to configure anything to access it, although you can adjust [your +settings](../server/#other-netdataconf-web-section-options) in the +`netdata.conf` file, or run Netdata behind an Nginx proxy, and so on. -For information on creating custom dashboards, see **[Custom Dashboards](custom/)** and **[Atlassian Confluence Dashboards](confluence/)** +## Navigating the standard dashboard -## Supported chart libraries +Beyond charts, the standard dashboard can be broken down into three key areas: -- Dygraph -- jQuery Sparkline -- Peity -- Google Charts -- Morris -- EasyPieChart -- Gauge.js -- D3 -- C3 +1. [**Sections**](#sections) +2. [**Menus/submenus**](#menus) +3. [**Nodes menu**](#nodes-menu) -### Dygraph +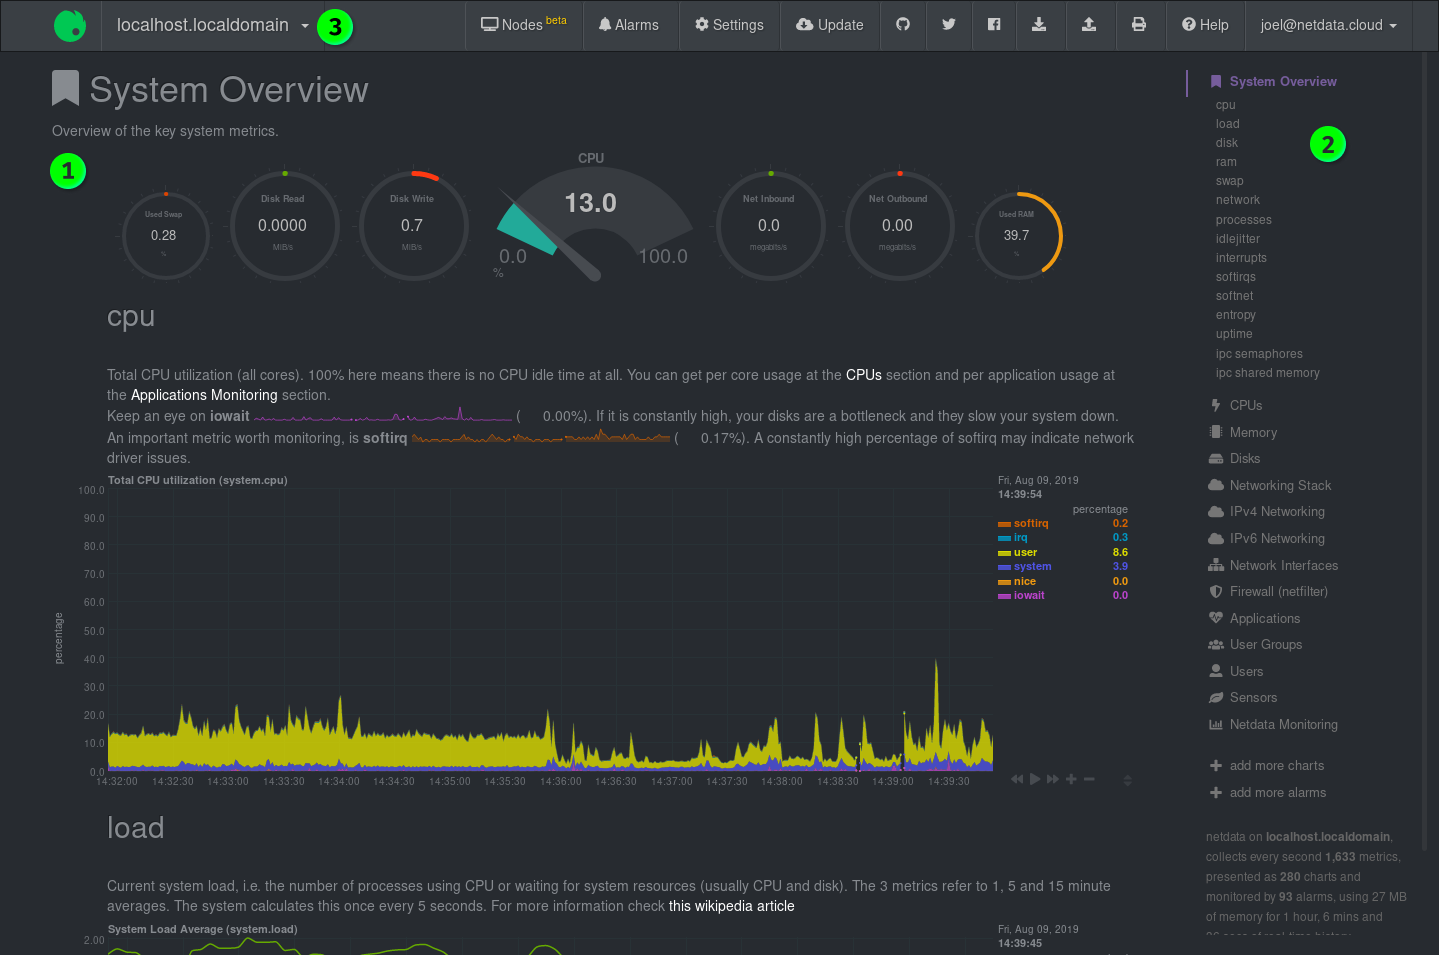 -#### Settings +### Sections -[Example settings here](https://github.com/netdata/netdata/blob/e91f00d99f4965e985981b93fa46ef33f94dd726/web/dashboard.js#L3793) +Netdata is broken up into multiple **sections**, such as **System Overview**, +**CPU**, **Disk**, and more. Inside each section you'll find a number of charts, +broken down into [contexts](../README.md#contexts) and +[families](../README.md#families). -#### Value Range +An example of the **Memory** section on a Linux desktop system. -You can set the min and max values of the y-axis using `data-dygraph-valuerange="[MIN, MAX]"` +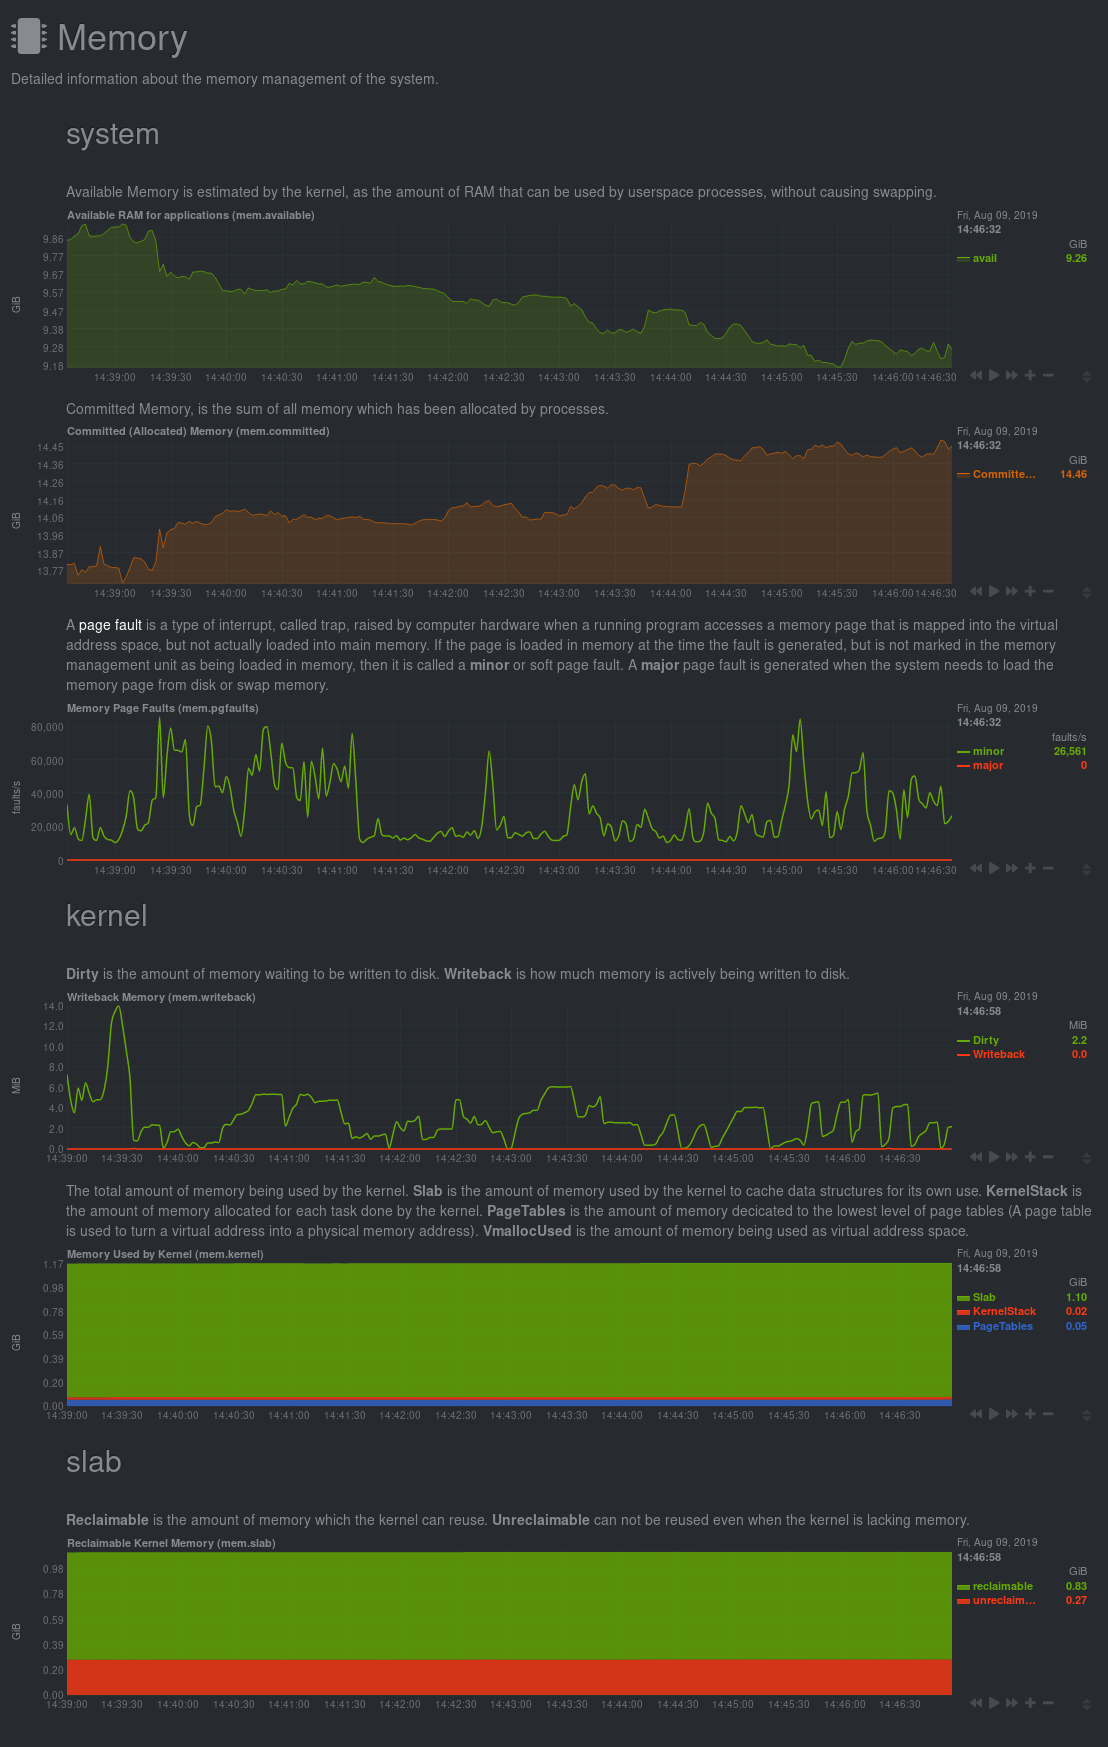 -### EasyPieChart +All sections and their associated charts appear on a single "page," so all you +need to do to view different sections is scroll up and down the page. But it's +usually quicker to use the [menus](#menus). -#### Settings +### Menus -TBD +**Menus** appears on the right-hand side of the standard dashboard. Netdata +generates a menu for each section, and menus link to the section they're +associated with. -#### Value Range +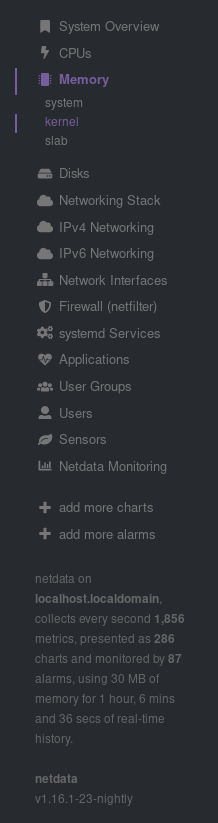 -You can set the max value of the chart using the following snippet: +Most menu items will contain several **submenu** entries, which represent any +[families](../README.md#families) from that section. Netdata automatically +generates these submenu entries. -```html -<div data-netdata="unique.id" - data-chart-library="easypiechart" - data-easypiechart-max-value="40" - ></div> -``` +Here's a **Disks** menu with several submenu entries for each disk drive and +partition Netdata recognizes. -Be aware that values that exceed the max value will get expanded (e.g. "41" is still 100%). Similar for the minimum: +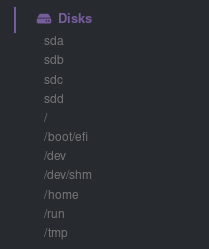 -```html -<div data-netdata="unique.id" - data-chart-library="easypiechart" - data-easypiechart-min-value="20" - ></div> -``` +### Nodes menu + +The nodes menu appears in the top-left corner of the standard dashboard and is +labeled with the hostname of the system Netdata is monitoring. + +Clicking on it will display a drop-down menu of any nodes you might have +connected via the [Netdata registry](../../registry/). By default, you'll find +nothing under the **My nodes** heading, but you can try out any of the demo +Netdata nodes to see how the nodes menu works. + +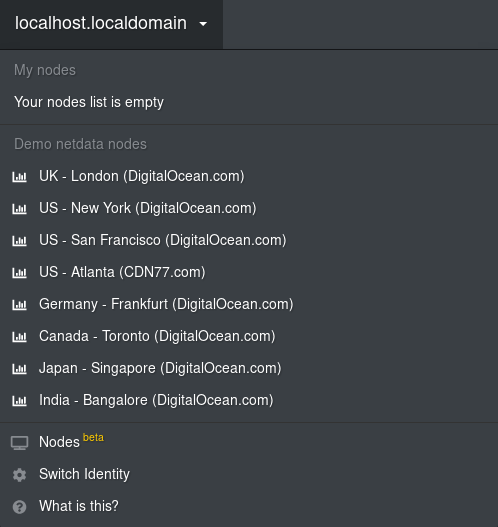 + +Once you add nodes via [Netdata Cloud](../../docs/netdata-cloud/) or a [private +registry](../../registry/#run-your-own-registry), you will see them appear under +the **My nodes** heading. + +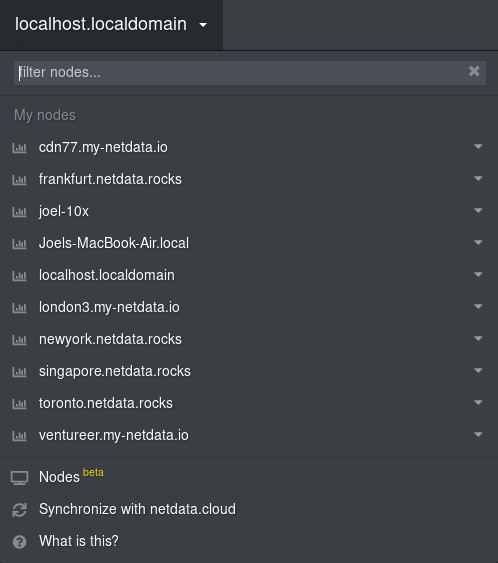 + +The nodes menu will also show the master netdata node and all slave nodes +streaming to that master, if you have [configured streaming](../../streaming). -If you specify both minimum and maximum, the rendering behavior changes. Instead of displaying the `value` based from zero, it is now based on the range that is provided by the snippet: +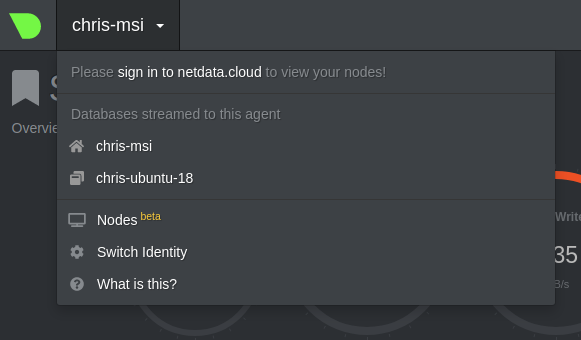 -```html -<div data-netdata="unique.id" - data-chart-library="easypiechart" - data-easypiechart-min-value="20" - data-easypiechart-max-value="40" - ></div> +## Customizing the standard dashboard + +Netdata stores information about individual charts in the `dashboard_info.js` +file. This file includes section and subsection headings, descriptions, colors, +titles, tooltips, and other information for Netdata to render on the dashboard. + +For example, here is how `dashboard_info.js` defines the **System Overview** +section. + +```javascript +netdataDashboard.menu = { + 'system': { + title: 'System Overview', + icon: '<i class="fas fa-bookmark"></i>', + info: 'Overview of the key system metrics.' + }, ``` -In the first example, a value of `30`, without specifying the minimum, fills the chart bar to `75%` (100% / 40 \* 30). However, in this example the range is now `20` (40 - 20 = 20). The value `30` will fill the chart to **`50%`**, since it's in the middle between 20 and 40. +If you want to customize this information, you should avoid editing +`dashboard_info.js` directly. These changes are not persistent; Netdata will +overwrite the file when it's updated. Instead, you should create a new file with +your customizations. -This szenario is useful if you have metrics that change only within a specific range, e.g. temperatures that are very unlikely to fall out of range. In these cases it is more useful to have the chart render the values between the given min and max, to better highlight the changes within them. +We created an example file at +[`dashboard_info_custom_example.js`](dashboard_info_custom_example.js). You can +copy this to a new file with a name of your choice in the `web/` directory. This +directory changes based on your operating system and installation method. If +you're on a Linux system, it should be at `/usr/share/netdata/web/`. -#### Negative Values +```shell +cd /usr/share/netdata/web/ +sudo cp dashboard_info_custom_example.js your_dashboard_info_file.js +``` -EasyPieCharts can render negative values with the following flag: +Edit the file with your customizations. For example: -```html -<div data-netdata="unique.id" - data-chart-library="easypiechart" - data-override-options="signed" - ></div> +```javascript +customDashboard.menu = { + 'system': { + title: 'Testing, testing, 1 2 3', + icon: '<i class="fas fa-thumbs-up"></i>', + info: 'This is overwritten info for the system overview section!' + }, +}; ``` -Negative values are rendered counter-clockwise. - -#### Full example - -This is a chart that displays the hotwater temperature in the given range of 40 to 50. - -```html -<div data-netdata="stiebeleltron_system.hotwater.hotwatertemp" - data-title="Hot Water Temperature" - data-decimal-digits="1" - data-chart-library="easypiechart" - data-colors="#FE3912" - data-width="55%" - data-height="50%" - data-points="1200" - data-after="-1200" - data-dimensions="actual" - data-units="°C" - data-easypiechart-max-value="50" - data-easypiechart-min-value="40" - data-common-max="netdata-hotwater-max" - data-common-min="netdata-hotwater-min" -></div> +Finally, tell Netdata where you placed your customization file by replacing +`your_dashboard_info_file.js` below. + +```conf +[web] + custom dashboard_info.js = your_dashboard_info_file.js ``` -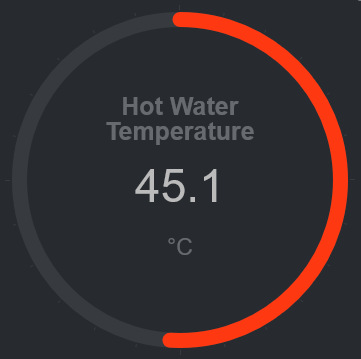 +Once you restart Netdata, refresh the dashboard to find your custom +configuration: + +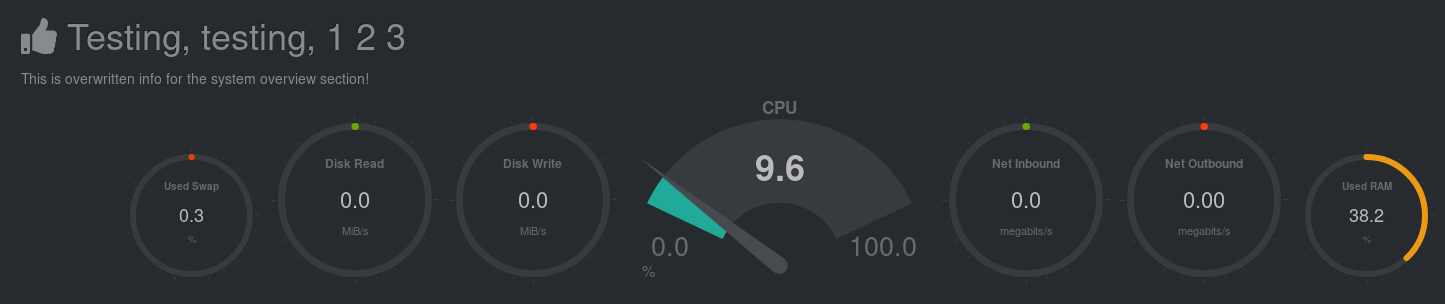 + +## Custom dashboards + +For information on creating custom dashboards from scratch, see the [custom +dashboards](custom/) or [Atlassian Confluence dashboards](confluence/) guides. [](<>) diff --git a/web/gui/custom/README.md b/web/gui/custom/README.md index 69649a3432..c7bb83404c 100644 --- a/web/gui/custom/README.md +++ b/web/gui/custom/README.md @@ -2,18 +2,24 @@ You can: -- create your own dashboards using simple HTML (no javascript is required for basic dashboards) +- create your own dashboards using simple HTML (no javascript is required for + basic dashboards) - utilizing any or all of the available chart libraries, on the same dashboard - using data from one or more Netdata servers, on the same dashboard - host your dashboard HTML page on any web server, anywhere -Netdata charts can also be added to existing web pages. +You can also add Netdata charts to existing web pages. -Check this **[very simple working example of a custom dashboard](http://netdata.firehol.org/demo.html)**, and its **[html source](../demo.html)**. +Check this **[very simple working example of a custom +dashboard](http://netdata.firehol.org/demo.html)**, and its **[html +source](../demo.html)**. -You should also look at the **[custom dashboard template](https://my-netdata.io/dashboard.html)**, that contains samples of all supported charts. The code is [here](../dashboard.html). +You should also look at the [custom dashboard +template](https://my-netdata.io/dashboard.html), which contains samples of all +supported charts. The code is [here](../dashboard.html). -If you plan to put the dashboard on TV, check **[tv.html](../tv.html)**. This is a screenshot of it, monitoring 2 servers on the same page: +If you plan to put the dashboard on TV, check out [tv.html](../tv.html). Here's +is a screenshot of it, monitoring two servers on the same page:  @@ -21,27 +27,32 @@ If you plan to put the dashboard on TV, check **[tv.html](../tv.html)**. This is ## Web directory -All of the mentioned examples are available on your local Netdata installation (e.g. `http://myhost:19999/dashboard.html`). The default web root directory with the HTML and JS code is `/usr/share/netdata/web`. The main dashboard is also in that directory and called `index.html`.\ -Note: index.html has a different syntax. Don't use it as a template for simple custom dashboards. +All of the mentioned examples are available on your local Netdata installation +(e.g. `http://myhost:19999/dashboard.html`). The default web root directory with +the HTML and JS code is `/usr/share/netdata/web`. The main dashboard is also in +that directory and called `index.html`.\ +Note: index.html has a different syntax. Don't use it as a template for simple +custom dashboards. ## Example empty dashboard -If you need to create a new dashboard on an empty page, we suggest the following header: +If you need to create a new dashboard on an empty page, we suggest the following +header: ```html <!DOCTYPE html> <html lang="en"> <head> - <title>Your dashboard</title> + <title>Your dashboard</title> - <meta http-equiv="Content-Type" content="text/html; charset=utf-8" /> - <meta charset="utf-8"> - <meta http-equiv="X-UA-Compatible" content="IE=edge,chrome=1"> - <meta name="viewport" content="width=device-width, initial-scale=1"> - <meta name="apple-mobile-web-app-capable" content="yes"> - <meta name="apple-mobile-web-app-status-bar-style" content="black-translucent"> + <meta http-equiv="Content-Type" content="text/html; charset=utf-8" /> + <meta charset="utf-8"> + <meta http-equiv="X-UA-Compatible" content="IE=edge,chrome=1"> + <meta name="viewport" content="width=device-width, initial-scale=1"> + <meta name="apple-mobile-web-app-capable" content="yes"> + <meta name="apple-mobile-web-app-status-bar-style" content="black-translucent"> - <!-- here we will add dashboard.js --> + <!-- here we will add dashboard.js --> </head> <body> @@ -107,73 +118,88 @@ To change the display order of your hosts, which is saved in localStorage, click ## dashboard.js -To add Netdata charts to any web page (dedicated to Netdata or not), you need to include the `/dashboard.js` file of a Netdata server. +To add Netdata charts to any web page (dedicated to Netdata or not), you need to +include the `/dashboard.js` file of a Netdata server. -For example, if your Netdata server listens at `http://box:19999/`, you will need to add the following to the `head` section of your web page: +For example, if your Netdata server listens at `http://box:19999/`, you will +need to add the following to the `head` section of your web page: ```html <script type="text/javascript" src="http://box:19999/dashboard.js"></script> ``` -### what dashboard.js does? +### What does dashboard.js do? `dashboard.js` will automatically load the following: 1. `dashboard.css`, required for the Netdata charts -2. `jquery.min.js`, (only if jquery is not already loaded for this web page) +2. `jquery.min.js`, (only if jQuery is not already loaded for this web page) -3. `bootstrap.min.js` (only if bootstrap is not already loaded) and `bootstrap.min.css`. +3. `bootstrap.min.js` (only if Bootstrap is not already loaded) and + `bootstrap.min.css`. - You can disable this by adding the following before loading `dashboard.js`: + You can disable this by adding the following before loading `dashboard.js`: ```html <script>var netdataNoBootstrap = true;</script> ``` -4. `jquery.nanoscroller.min.js`, required for the scrollbar of the chart legends. +4. `jquery.nanoscroller.min.js`, required for the scrollbar of the chart + legends. -5. `bootstrap-toggle.min.js` and `bootstrap-toggle.min.css`, required for the settings toggle buttons. +5. `bootstrap-toggle.min.js` and `bootstrap-toggle.min.css`, required for the + settings toggle buttons. 6. `font-awesome.min.css`, for icons. -When `dashboard.js` loads will scan the page for elements that define charts (see below) and immediately start refreshing them. Keep in mind more javascript modules may be loaded (every chart library is a different javascript file, that is loaded on first use). +When `dashboard.js` loads will scan the page for elements that define charts +(see below) and immediately start refreshing them. Keep in mind more javascript +modules may be loaded (every chart library is a different javascript file, that +is loaded on first use). ### Prevent dashboard.js from starting chart refreshes -If your web page is not static and you plan to add charts using javascript, you can tell `dashboard.js` not to start processing charts immediately after loaded, by adding this fragment before loading it: +If your web page is not static and you plan to add charts using JavaScript, you +can tell `dashboard.js` not to start processing charts immediately after loaded, +by adding this fragment before loading it: ```html <script>var netdataDontStart = true;</script> -``` +`" The above, will inform the `dashboard.js` to load everything, but not process the web page until you tell it to. You can tell it to start processing the page, by running this javascript code: ```js NETDATA.start(); -``` +`" -Be careful not to call the `NETDATA.start()` multiple times. Each call to this function will spawn a new thread that will start refreshing the charts. +Be careful not to call the `NETDATA.start()` multiple times. Each call to this +function will spawn a new thread that will start refreshing the charts. -If, after calling `NETDATA.start()` you need to update the page (or even get your javascript code synchronized with `dashboard.js`), you can call (after you loaded `dashboard.js`): +If, after calling `NETDATA.start()` you need to update the page (or even get +your javascript code synchronized with `dashboard.js`), you can call (after you +loaded `dashboard.js`): ```js NETDATA.pause(function() { - // ok, it is paused + // ok, it is paused - // update the DOM as you wish + // update the DOM as you wish - // and then call this to let the charts refresh: - NETDATA.unpause(); + // and then call this to let the charts refresh: + NETDATA.unpause(); }); ``` ### The default Netdata server -`dashboard.js` will attempt to auto-detect the URL of the Netdata server it is loaded from, and set this server as the default Netdata server for all charts. +`dashboard.js` will attempt to auto-detect the URL of the Netdata server it is +loaded from, and set this server as the default Netdata server for all charts. -If you need to set any other URL as the default Netdata server for all charts that do not specify a Netdata server, add this before loading `dashboard.js`: +If you need to set any other URL as the default Netdata server for all charts +that do not specify a Netdata server, add this before loading `dashboard.js`: ```html <script type="text/javascript">var netdataServer = "http://your.netdata.server:19999";</script> @@ -183,11 +209,15 @@ If you need to set any other URL as the default Netdata server for all charts th ## Adding charts -To add charts, you need to add a `div` for each of them. Each of these `div` elements accept a few `data-` attributes: +To add charts, you need to add a `div` for each of them. Each of these `div` +elements accept a few `data-` attributes: ### The chart unique ID -The unique ID of a chart is shown at the title of the chart of the default Netdata dashboard. You can also find all the charts available at your Netdata server with this URL: `http://your.netdata.server:19999/api/v1/charts` ([example](http://netdata.firehol.org/api/v1/charts)). +The unique ID of a chart is shown at the title of the chart of the default +Netdata dashboard. You can also find all the charts available at your Netdata +server with this URL: `http://your.netdata.server:19999/api/v1/charts` +([example](http://netdata.firehol.org/api/v1/charts)). To specify the unique id, use this: @@ -195,26 +225,34 @@ To specify the unique id, use this: <div data-netdata="unique.id"></div> ``` -The above is enough for adding a chart. It most probably have the wrong visual settings though. Keep reading... +The above is enough for adding a chart. It most probably have the wrong visual +settings though. Keep reading... ### The duration of the chart -You can specify the duration of the chart (how much time of data it will show) using: +You can specify the duration of the chart (how much time of data it will show) +using: ```html <div data-netdata="unique.id" - data-after="AFTER_SECONDS" - data-before="BEFORE_SECONDS" - ></div> + data-after="AFTER_SECONDS" + data-before="BEFORE_SECONDS" + ></div> ``` -`AFTER_SECONDS` and `BEFORE_SECONDS` are numbers representing a time-frame in seconds. +`AFTER_SECONDS` and `BEFORE_SECONDS` are numbers representing a time-frame in +seconds. The can be either: -- **absolute** unix timestamps (in javascript terms, they are `new Date().getTime() / 1000`. Using absolute timestamps you can have a chart showing always the same time-frame. +- **absolute** unix timestamps (in javascript terms, they are `new + Date().getTime() / 1000`. Using absolute timestamps you can have a chart + showing always the same time-frame. -- **relative** number of seconds to now. To show the last 10 minutes of data, `AFTER_SECONDS` must be `-600` (relative to now) and `BEFORE_SECONDS` must be `0` (meaning: now). If you want the chart to auto-refresh the current values, you need to specify **relative** values. +- **relative** number of seconds to now. To show the last 10 minutes of data, + `AFTER_SECONDS` must be `-600` (relative to now) and `BEFORE_SECONDS` must + be `0` (meaning: now). If you want the chart to auto-refresh the current + values, you need to specify **relative** values. ### Chart sizes @@ -222,122 +260,160 @@ You can set the size of the chart using this: ```html <div data-netdata="unique.id" - data-width="WIDTH" - data-height="HEIGHT" - ></div> + data-width="WIDTH" + data-height="HEIGHT" + ></div> ``` -`WIDTH` and `HEIGHT` can be anything CSS accepts for width and height (e.g. percentages, pixels, etc). -Keep in mind that for certain chart libraries, `dashboard.js` may apply an aspect ratio to these. +`WIDTH` and `HEIGHT` can be anything CSS accepts for width and height (e.g. +percentages, pixels, etc). Keep in mind that for certain chart libraries, +`dashboard.js` may apply an aspect ratio to these. -If you want `dashboard.js` to remember permanently (browser local storage) the dimensions of the chart (the user may resize it), you can add: `data-id="SETTINGS_ID"`, where `SETTINGS_ID` is anything that will be common for this chart across user sessions. +If you want `dashboard.js` to permanently remember (browser local storage) the +dimensions of the chart (the user may resize it), you can add: `data-id=" +SETTINGS_ID"`, where `SETTINGS_ID` is anything that will be common for this +chart across user sessions. ### Netdata server -Each chart can get data from a different Netdata server. You can give per chart the Netdata server using: +Each chart can get data from a different Netdata server. You can specify the Netdata server to use for each chart using: ```html <div data-netdata="unique.id" - data-host="http://another.netdata.server:19999/" - ></div> + data-host="http://another.netdata.server:19999/" + ></div> ``` -If you have ephemeral monitoring setup ([More info here](../../../streaming/#monitoring-ephemeral-nodes)) and have no direct access to the nodes dash |