
diff options
| author | Tasos Katsoulas <12612986+tkatsoulas@users.noreply.github.com> | 2023-02-02 15:23:54 +0200 |
|---|---|---|
| committer | GitHub <noreply@github.com> | 2023-02-02 15:23:54 +0200 |
| commit | 9f1403de7d3ea2633768d34095afcf880c7c4e2d (patch) | |
| tree | 0c50a1f42b3e182f6cd5de4e92c609cc76fd3cb5 /web | |
| parent | caf18920aac38eed782647957e82c0ab7f64ec17 (diff) | |
Covert our documentation links to GH absolute links (#14344)
Signed-off-by: Tasos Katsoulas <tasos@netdata.cloud>
Diffstat (limited to 'web')
| -rw-r--r-- | web/README.md | 18 | ||||
| -rw-r--r-- | web/api/badges/README.md | 2 | ||||
| -rw-r--r-- | web/api/exporters/prometheus/README.md | 2 | ||||
| -rw-r--r-- | web/api/formatters/README.md | 24 | ||||
| -rw-r--r-- | web/api/formatters/csv/README.md | 2 | ||||
| -rw-r--r-- | web/api/formatters/json/README.md | 2 | ||||
| -rw-r--r-- | web/api/formatters/ssv/README.md | 2 | ||||
| -rw-r--r-- | web/api/formatters/value/README.md | 6 | ||||
| -rw-r--r-- | web/api/health/README.md | 6 | ||||
| -rw-r--r-- | web/api/queries/README.md | 2 | ||||
| -rw-r--r-- | web/gui/README.md | 22 | ||||
| -rw-r--r-- | web/gui/confluence/README.md | 2 | ||||
| -rw-r--r-- | web/gui/custom/README.md | 6 | ||||
| -rw-r--r-- | web/server/README.md | 14 |
14 files changed, 55 insertions, 55 deletions
diff --git a/web/README.md b/web/README.md index 7093ca18f7..eae5793467 100644 --- a/web/README.md +++ b/web/README.md @@ -14,17 +14,17 @@ team and the community, but you can also customize them yourself. There are two primary ways to view Netdata's dashboards: -1. The [local Agent dashboard](/web/gui/README.md) that comes pre-configured with every Netdata installation. You can +1. The [local Agent dashboard](https://github.com/netdata/netdata/blob/master/web/gui/README.md) that comes pre-configured with every Netdata installation. You can see it at `http://NODE:19999`, replacing `NODE` with `localhost`, the hostname of your node, or its IP address. You can customize the contents and colors of the standard dashboard [using - JavaScript](/web/gui/README.md#customizing-the-local-dashboard). + JavaScript](https://github.com/netdata/netdata/blob/master/web/gui/README.md#customizing-the-local-dashboard). 2. The [`dashboard.js` JavaScript library](#dashboardjs), which helps you - [customize the standard dashboards](/web/gui/README.md#customizing-the-local-dashboard) - using JavaScript, or create entirely new [custom dashboards](/web/gui/custom/README.md) or - [Atlassian Confluence dashboards](/web/gui/confluence/README.md). + [customize the standard dashboards](https://github.com/netdata/netdata/blob/master/web/gui/README.md#customizing-the-local-dashboard) + using JavaScript, or create entirely new [custom dashboards](https://github.com/netdata/netdata/blob/master/web/gui/custom/README.md) or + [Atlassian Confluence dashboards](https://github.com/netdata/netdata/blob/master/web/gui/confluence/README.md). -You can also view all the data Netdata collects through the [REST API v1](/web/api/README.md#netdata-rest-api). +You can also view all the data Netdata collects through the [REST API v1](https://github.com/netdata/netdata/blob/master/web/api/README.md#netdata-rest-api). No matter where you use Netdata's charts, you'll want to know how to [use](#using-charts) them. You'll also want to understand how Netdata defines [charts](#charts), [dimensions](#dimensions), [families](#families), and @@ -84,7 +84,7 @@ Netdata organizes metrics into charts, dimensions, families, and contexts. A **chart** is an individual, interactive, always-updating graphic displaying one or more collected/calculated metrics. Charts are generated by -[collectors](/collectors/README.md). +[collectors](https://github.com/netdata/netdata/blob/master/collectors/README.md). Here's the system CPU chart, the first chart displayed on the standard dashboard: @@ -182,7 +182,7 @@ hover over the date above the list of dimensions. A tooltip will appear that shows you two pieces of information: the collector that produces the chart, and the chart's context. -Netdata also uses [contexts for alarm templates](/health/REFERENCE.md#alarm-line-on). You can create an alarm for the +Netdata also uses [contexts for alarm templates](https://github.com/netdata/netdata/blob/master/health/REFERENCE.md#alarm-line-on). You can create an alarm for the `net.packets` context to receive alerts for any chart with that context, no matter which family it's attached to. ## Positive and negative values on charts @@ -215,7 +215,7 @@ all the charts and other visualizations that appear on any Netdata dashboard. You need to put `dashboard.js` on any HTML page that's going to render Netdata charts. -The [custom dashboards documentation](/web/gui/custom/README.md) contains examples of such +The [custom dashboards documentation](https://github.com/netdata/netdata/blob/master/web/gui/custom/README.md) contains examples of such custom HTML pages. ### Generating dashboard.js diff --git a/web/api/badges/README.md b/web/api/badges/README.md index 84409471a4..8f6eca62a0 100644 --- a/web/api/badges/README.md +++ b/web/api/badges/README.md @@ -25,7 +25,7 @@ Similarly, there is [a chart that shows outbound bandwidth per class](http://lon The right one is a **volume** calculation. Netdata calculated the total of the last 86.400 seconds (a day) which gives `kilobits`, then divided it by 8 to make it KB, then by 1024 to make it MB and then by 1024 to make it GB. Calculations like this are quite accurate, since for every value collected, every second, Netdata interpolates it to second boundary using microsecond calculations. -Let's see a few more badge examples (they come from the [Netdata registry](/registry/README.md)): +Let's see a few more badge examples (they come from the [Netdata registry](https://github.com/netdata/netdata/blob/master/registry/README.md)): - **cpu usage of user `root`** (you can pick any user; 100% = 1 core). This will be `green <10%`, `yellow <20%`, `orange <50%`, `blue <100%` (1 core), `red` otherwise (you define thresholds and colors on the URL). diff --git a/web/api/exporters/prometheus/README.md b/web/api/exporters/prometheus/README.md index cf7e2caa8d..1ff86f4e0c 100644 --- a/web/api/exporters/prometheus/README.md +++ b/web/api/exporters/prometheus/README.md @@ -5,6 +5,6 @@ custom_edit_url: https://github.com/netdata/netdata/edit/master/web/api/exporter # Prometheus exporter -Read the Prometheus exporter documentation: [Using Netdata with Prometheus](/exporting/prometheus/README.md). +Read the Prometheus exporter documentation: [Using Netdata with Prometheus](https://github.com/netdata/netdata/blob/master/exporting/prometheus/README.md). diff --git a/web/api/formatters/README.md b/web/api/formatters/README.md index 3e67ac6ee2..4c281f0644 100644 --- a/web/api/formatters/README.md +++ b/web/api/formatters/README.md @@ -12,18 +12,18 @@ The following formats are supported: | format|module|content type|description| |:----:|:----:|:----------:|:----------| -| `array`|[ssv](/web/api/formatters/ssv/README.md)|application/json|a JSON array| -| `csv`|[csv](/web/api/formatters/csv/README.md)|text/plain|a text table, comma separated, with a header line (dimension names) and `\r\n` at the end of the lines| -| `csvjsonarray`|[csv](/web/api/formatters/csv/README.md)|application/json|a JSON array, with each row as another array (the first row has the dimension names)| -| `datasource`|[json](/web/api/formatters/json/README.md)|application/json|a Google Visualization Provider `datasource` javascript callback| -| `datatable`|[json](/web/api/formatters/json/README.md)|application/json|a Google `datatable`| -| `html`|[csv](/web/api/formatters/csv/README.md)|text/html|an html table| -| `json`|[json](/web/api/formatters/json/README.md)|application/json|a JSON object| -| `jsonp`|[json](/web/api/formatters/json/README.md)|application/json|a JSONP javascript callback| -| `markdown`|[csv](/web/api/formatters/csv/README.md)|text/plain|a markdown table| -| `ssv`|[ssv](/web/api/formatters/ssv/README.md)|text/plain|a space separated list of values| -| `ssvcomma`|[ssv](/web/api/formatters/ssv/README.md)|text/plain|a comma separated list of values| -| `tsv`|[csv](/web/api/formatters/csv/README.md)|text/plain|a TAB delimited `csv` (MS Excel flavor)| +| `array`|[ssv](https://github.com/netdata/netdata/blob/master/web/api/formatters/ssv/README.md)|application/json|a JSON array| +| `csv`|[csv](https://github.com/netdata/netdata/blob/master/web/api/formatters/csv/README.md)|text/plain|a text table, comma separated, with a header line (dimension names) and `\r\n` at the end of the lines| +| `csvjsonarray`|[csv](https://github.com/netdata/netdata/blob/master/web/api/formatters/csv/README.md)|application/json|a JSON array, with each row as another array (the first row has the dimension names)| +| `datasource`|[json](https://github.com/netdata/netdata/blob/master/web/api/formatters/json/README.md)|application/json|a Google Visualization Provider `datasource` javascript callback| +| `datatable`|[json](https://github.com/netdata/netdata/blob/master/web/api/formatters/json/README.md)|application/json|a Google `datatable`| +| `html`|[csv](https://github.com/netdata/netdata/blob/master/web/api/formatters/csv/README.md)|text/html|an html table| +| `json`|[json](https://github.com/netdata/netdata/blob/master/web/api/formatters/json/README.md)|application/json|a JSON object| +| `jsonp`|[json](https://github.com/netdata/netdata/blob/master/web/api/formatters/json/README.md)|application/json|a JSONP javascript callback| +| `markdown`|[csv](https://github.com/netdata/netdata/blob/master/web/api/formatters/csv/README.md)|text/plain|a markdown table| +| `ssv`|[ssv](https://github.com/netdata/netdata/blob/master/web/api/formatters/ssv/README.md)|text/plain|a space separated list of values| +| `ssvcomma`|[ssv](https://github.com/netdata/netdata/blob/master/web/api/formatters/ssv/README.md)|text/plain|a comma separated list of values| +| `tsv`|[csv](https://github.com/netdata/netdata/blob/master/web/api/formatters/csv/README.md)|text/plain|a TAB delimited `csv` (MS Excel flavor)| For examples of each format, check the relative module documentation. diff --git a/web/api/formatters/csv/README.md b/web/api/formatters/csv/README.md index df7c11efa6..fc5ffec1b8 100644 --- a/web/api/formatters/csv/README.md +++ b/web/api/formatters/csv/README.md @@ -5,7 +5,7 @@ custom_edit_url: https://github.com/netdata/netdata/edit/master/web/api/formatte # CSV formatter -The CSV formatter presents [results of database queries](/web/api/queries/README.md) in the following formats: +The CSV formatter presents [results of database queries](https://github.com/netdata/netdata/blob/master/web/api/queries/README.md) in the following formats: | format|content type|description| | :----:|:----------:|:----------| diff --git a/web/api/formatters/json/README.md b/web/api/formatters/json/README.md index a0f8108e73..75f729adab 100644 --- a/web/api/formatters/json/README.md +++ b/web/api/formatters/json/README.md @@ -5,7 +5,7 @@ custom_edit_url: https://github.com/netdata/netdata/edit/master/web/api/formatte # JSON formatter -The CSV formatter presents [results of database queries](/web/api/queries/README.md) in the following formats: +The CSV formatter presents [results of database queries](https://github.com/netdata/netdata/blob/master/web/api/queries/README.md) in the following formats: | format | content type | description| |:----:|:----------:|:----------| diff --git a/web/api/formatters/ssv/README.md b/web/api/formatters/ssv/README.md index d9e193d66e..4ca2a64caa 100644 --- a/web/api/formatters/ssv/README.md +++ b/web/api/formatters/ssv/README.md @@ -5,7 +5,7 @@ custom_edit_url: https://github.com/netdata/netdata/edit/master/web/api/formatte # SSV formatter -The SSV formatter sums all dimensions in [results of database queries](/web/api/queries/README.md) +The SSV formatter sums all dimensions in [results of database queries](https://github.com/netdata/netdata/blob/master/web/api/queries/README.md) to a single value and returns a list of such values showing how it changes through time. It supports the following formats: diff --git a/web/api/formatters/value/README.md b/web/api/formatters/value/README.md index a51e32de76..5b75ded7cf 100644 --- a/web/api/formatters/value/README.md +++ b/web/api/formatters/value/README.md @@ -5,7 +5,7 @@ custom_edit_url: https://github.com/netdata/netdata/edit/master/web/api/formatte # Value formatter -The Value formatter presents [results of database queries](/web/api/queries/README.md) as a single value. +The Value formatter presents [results of database queries](https://github.com/netdata/netdata/blob/master/web/api/queries/README.md) as a single value. To calculate the single value to be returned, it sums the values of all dimensions. @@ -18,7 +18,7 @@ The Value formatter respects the following API `&options=`: | `min2max` | yes | to return the delta from the minimum value to the maximum value (across dimensions)| The Value formatter is not exposed by the API by itself. -Instead it is used by the [`ssv`](/web/api/formatters/ssv/README.md) formatter -and [health monitoring queries](/health/README.md). +Instead it is used by the [`ssv`](https://github.com/netdata/netdata/blob/master/web/api/formatters/ssv/README.md) formatter +and [health monitoring queries](https://github.com/netdata/netdata/blob/master/health/README.md). diff --git a/web/api/health/README.md b/web/api/health/README.md index 9ec8f31c01..bfdd0ac682 100644 --- a/web/api/health/README.md +++ b/web/api/health/README.md @@ -72,7 +72,7 @@ You can access the API via GET requests, by adding the bearer token to an `Autho curl "http://NODE:19999/api/v1/manage/health?cmd=RESET" -H "X-Auth-Token: Mytoken" ``` -By default access to the health management API is only allowed from `localhost`. Accessing the API from anything else will return a 403 error with the message `You are not allowed to access this resource.`. You can change permissions by editing the `allow management from` variable in `netdata.conf` within the [web] section. See [web server access lists](/web/server/README.md#access-lists) for more information. +By default access to the health management API is only allowed from `localhost`. Accessing the API from anything else will return a 403 error with the message `You are not allowed to access this resource.`. You can change permissions by editing the `allow management from` variable in `netdata.conf` within the [web] section. See [web server access lists](https://github.com/netdata/netdata/blob/master/web/server/README.md#access-lists) for more information. The command `RESET` just returns Netdata to the default operation, with all health checks and notifications enabled. If you've configured and entered your token correctly, you should see the plain text response `All health checks and notifications are enabled`. @@ -126,7 +126,7 @@ curl "http://NODE:19999/api/v1/manage/health?cmd=SILENCE&context=load" -H "X-Aut #### Selection criteria -The `selection criteria` are key/value pairs, in the format `key : value`, where value is a Netdata [simple pattern](/libnetdata/simple_pattern/README.md). This means that you can create very powerful selectors (you will rarely need more than one or two). +The `selection criteria` are key/value pairs, in the format `key : value`, where value is a Netdata [simple pattern](https://github.com/netdata/netdata/blob/master/libnetdata/simple_pattern/README.md). This means that you can create very powerful selectors (you will rarely need more than one or two). The accepted keys for the `selection criteria` are the following: @@ -220,6 +220,6 @@ The file's location is configurable in `netdata.conf`. The default is shown belo ### Further reading -The test script under [tests/health_mgmtapi](/tests/health_mgmtapi/README.md) contains a series of tests that you can either run or read through to understand the various calls and responses better. +The test script under [tests/health_mgmtapi](https://github.com/netdata/netdata/blob/master/tests/health_mgmtapi/README.md) contains a series of tests that you can either run or read through to understand the various calls and responses better. diff --git a/web/api/queries/README.md b/web/api/queries/README.md index 44cdd05b41..2a17ac7840 100644 --- a/web/api/queries/README.md +++ b/web/api/queries/README.md @@ -88,7 +88,7 @@ To disable alignment, pass `&options=unaligned` to the query. To execute the query, the engine evaluates all dimensions of the chart, one after another. -The engine does not evaluate dimensions that do not match the [simple pattern](/libnetdata/simple_pattern/README.md) +The engine does not evaluate dimensions that do not match the [simple pattern](https://github.com/netdata/netdata/blob/master/libnetdata/simple_pattern/README.md) given at the `dimensions` parameter, except when `options=percentage` is given (this option requires all the dimensions to be evaluated to find the percentage of each dimension vs to chart total). diff --git a/web/gui/README.md b/web/gui/README.md index 69db6becbc..fbd7da4df9 100644 --- a/web/gui/README.md +++ b/web/gui/README.md @@ -13,16 +13,16 @@ before: action](https://user-images.githubusercontent.com/1153921/101513938-fae28380-3939-11eb-9434-8ad86a39be62.gif) Learn more about how dashboards work and how they're populated using the `dashboards.js` file in our [web dashboards -overview](/web/README.md). +overview](https://github.com/netdata/netdata/blob/master/web/README.md). By default, Netdata starts a web server for its dashboard at port `19999`. Open up your web browser of choice and navigate to `http://NODE:19999`, replacing `NODE` with the IP address or hostname of your Agent. If you're unsure, try `http://localhost:19999` first. -Netdata uses an [internal, static-threaded web server](/web/server/README.md) to host the HTML, CSS, and JavaScript +Netdata uses an [internal, static-threaded web server](https://github.com/netdata/netdata/blob/master/web/server/README.md) to host the HTML, CSS, and JavaScript files that make up the local Agent dashboard. You don't have to configure anything to access it, although you can adjust -[your settings](/web/server/README.md#other-netdataconf-web-section-options) in the `netdata.conf` file, or run Netdata -behind an [Nginx proxy](https://learn.netdata.cloud/docs/agent/running-behind-nginx), and so on. +[your settings](https://github.com/netdata/netdata/blob/master/web/server/README.md#other-netdataconf-web-section-options) in the `netdata.conf` file, or run Netdata +behind an [Nginx proxy](https://github.com/netdata/netdata/blob/master/docs/Running-behind-nginx.md), and so on. ## Navigating the local dashboard @@ -40,8 +40,8 @@ dashboard](https://user-images.githubusercontent.com/1153921/101509403-f7e59400- Netdata is broken up into multiple **sections**, such as **System Overview**, **CPU**, **Disk**, and more. Inside each section you'll find a number of charts, -broken down into [contexts](/web/README.md#contexts) and -[families](/web/README.md#families). +broken down into [contexts](https://github.com/netdata/netdata/blob/master/web/README.md#contexts) and +[families](https://github.com/netdata/netdata/blob/master/web/README.md#families). An example of the **Memory** section on a Linux desktop system. @@ -69,7 +69,7 @@ Use the calendar to select multiple days. Click on a date to begin the timeframe Click **Apply** to re-render all visualizations with new metrics data, or **Clear** to restore the default timeframe. -[Increase the metrics retention policy](/docs/store/change-metrics-storage.md) for your node to see more historical +[Increase the metrics retention policy](https://github.com/netdata/netdata/blob/master/docs/store/change-metrics-storage.md) for your node to see more historical timeframes. ### Metrics menus @@ -80,7 +80,7 @@ section, and menus link to the section they're associated with. 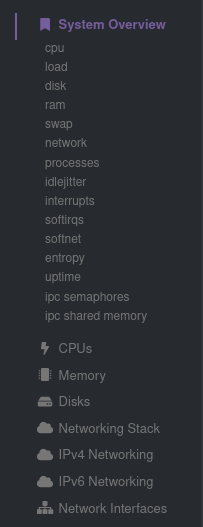 Most metrics menu items will contain several **submenu** entries, which represent any -[families](/web/README.md#families) from that section. Netdata automatically +[families](https://github.com/netdata/netdata/blob/master/web/README.md#families) from that section. Netdata automatically generates these submenu entries. Here's a **Disks** menu with several submenu entries for each disk drive and @@ -100,7 +100,7 @@ a War Room's name to jump to the Netdata Cloud web interface. menus](https://user-images.githubusercontent.com/1153921/80837210-3f8b8c80-8bab-11ea-9c75-128c2d823ef8.png) If you want to know more about how Cloud populates this menu, and the Agent-Cloud integration at a high level, see our -document on [using the Agent with Netdata Cloud](/docs/agent-cloud.md). +document on [using the Agent with Netdata Cloud](https://github.com/netdata/netdata/blob/master/docs/agent-cloud.md). ## Customizing the local dashboard @@ -163,5 +163,5 @@ file](https://user-images.githubusercontent.com/1153921/62798924-570e6c80-ba94-1 ## Custom dashboards -For information on creating custom dashboards from scratch, see the [custom dashboards](/web/gui/custom/README.md) or -[Atlassian Confluence dashboards](/web/gui/confluence/README.md) guides. +For information on creating custom dashboards from scratch, see the [custom dashboards](https://github.com/netdata/netdata/blob/master/web/gui/custom/README.md) or +[Atlassian Confluence dashboards](https://github.com/netdata/netdata/blob/master/web/gui/confluence/README.md) guides. diff --git a/web/gui/confluence/README.md b/web/gui/confluence/README.md index 64dacdf38d..9e7b8025f4 100644 --- a/web/gui/confluence/README.md +++ b/web/gui/confluence/README.md @@ -85,7 +85,7 @@ This badge is now auto-refreshing. It will update itself based on the update fre > Keep in mind you can add badges with custom Netdata queries too. Netdata automatically creates badges for all the > alarms, but every chart, every dimension on every chart, can be used for a badge. And Netdata badges are quite -> powerful! Check [Creating Badges](/web/api/badges/README.md) for more information on badges. +> powerful! Check [Creating Badges](https://github.com/netdata/netdata/blob/master/web/api/badges/README.md) for more information on badges. So, let's create a table and add this badge for both our web servers: diff --git a/web/gui/custom/README.md b/web/gui/custom/README.md index 23cd924ead..0751f20874 100644 --- a/web/gui/custom/README.md +++ b/web/gui/custom/README.md @@ -245,7 +245,7 @@ Each chart can get data from a different Netdata server. You can specify the Net ></div> ``` -If you have ephemeral monitoring setup ([More info here](/streaming/README.md#monitoring-ephemeral-nodes)) and have no +If you have ephemeral monitoring setup ([More info here](https://github.com/netdata/netdata/blob/master/streaming/README.md#monitoring-ephemeral-nodes)) and have no direct access to the nodes dashboards, you can use the following: ```html @@ -369,7 +369,7 @@ select specific dimensions using this: ``` Netdata supports coma (`,`) or pipe (`|`) separated [simple -patterns](/libnetdata/simple_pattern/README.md) for dimensions. By default it +patterns](https://github.com/netdata/netdata/blob/master/libnetdata/simple_pattern/README.md) for dimensions. By default it searches for both dimension IDs and dimension NAMEs. You can control the target of the match with: `data-append-options="match-ids"` or `data-append-options="match-names"`. Spaces in `data-dimensions=""` are matched @@ -437,7 +437,7 @@ it, using this: ### API options -You can append Netdata **[REST API v1](/web/api/README.md)** data options, using this: +You can append Netdata **[REST API v1](https://github.com/netdata/netdata/blob/master/web/api/README.md)** data options, using this: ```html <div data-netdata="unique.id" diff --git a/web/server/README.md b/web/server/README.md index 6a0fa940a8..407df6c038 100644 --- a/web/server/README.md +++ b/web/server/README.md @@ -51,7 +51,7 @@ Using the above, Netdata will bind to: - IPv4 127.0.0.1 at port 19999 (port was used from `default port`). Only the UI (dashboard) and the read API will be accessible on this port. Both HTTP and HTTPS requests will be accepted. - IPv4 10.1.1.1 at port 19998. The management API and `netdata.conf` will be accessible on this port. - All the IPs `hostname` resolves to (both IPv4 and IPv6 depending on the resolved IPs) at port 19997. Only badges will be accessible on this port. -- All IPv6 IPs at port 19996. Only metric streaming requests from other Netdata agents will be accepted on this port. Only encrypted streams will be allowed (i.e. child nodes also need to be [configured for TLS](/streaming/README.md). +- All IPv6 IPs at port 19996. Only metric streaming requests from other Netdata agents will be accepted on this port. Only encrypted streams will be allowed (i.e. child nodes also need to be [configured for TLS](https://github.com/netdata/netdata/blob/master/streaming/README.md). - All the IPs `localhost` resolves to (both IPv4 and IPv6 depending the resolved IPs) at port 19996. This port will only accept registry API requests. - All IPv4 and IPv6 IPs at port `http` as set in `/etc/services`. Only the UI (dashboard) and the read API will be accessible on this port. - Unix domain socket `/run/netdata/netdata.sock`. All requests are serviceable on this socket. Note that in some OSs like Fedora, every service sees a different `/tmp`, so don't create a Unix socket under `/tmp`. `/run` or `/var/run` is suggested. @@ -140,7 +140,7 @@ Example: bind to = *=dashboard|registry|badges|management|streaming|netdata.conf^SSL=force ``` -For information how to configure the child to use TLS, check [securing the communication](/streaming/README.md#securing-streaming-communications) in the streaming documentation. There you will find additional details on the expected behavior for client and server nodes, when their respective TLS options are enabled. +For information how to configure the child to use TLS, check [securing the communication](https://github.com/netdata/netdata/blob/master/streaming/README.md#securing-streaming-communications) in the streaming documentation. There you will find additional details on the expected behavior for client and server nodes, when their respective TLS options are enabled. When we define the use of SSL in a Netdata agent for different ports, Netdata will apply the behavior specified on each port. For example, using the configuration line below: @@ -196,7 +196,7 @@ Netdata supports access lists in `netdata.conf`: - `allow netdata.conf from` checks the IP to allow `http://netdata.host:19999/netdata.conf`. The IPs listed are all the private IPv4 addresses, including link local IPv6 addresses. Keep in mind that connections to Netdata API ports are filtered by `allow connections from`. So, IPs allowed by `allow netdata.conf from` should also be allowed by `allow connections from`. -- `allow management from` checks the IPs to allow API management calls. Management via the API is currently supported for [health](/web/api/health/README.md#health-management-api) +- `allow management from` checks the IPs to allow API management calls. Management via the API is currently supported for [health](https://github.com/netdata/netdata/blob/master/web/api/health/README.md#health-management-api) In order to check the FQDN of the connection without opening the Netdata agent to DNS-spoofing, a reverse-dns record must be setup for the connecting host. At connection time the reverse-dns of the peer IP address is resolved, and @@ -222,13 +222,13 @@ present that may match DNS FQDNs. |setting|default|info| |:-----:|:-----:|:---| -|ses max window|`15`|See [single exponential smoothing](/web/api/queries/des/README.md)| -|des max window|`15`|See [double exponential smoothing](/web/api/queries/des/README.md)| +|ses max window|`15`|See [single exponential smoothing](https://github.com/netdata/netdata/blob/master/web/api/queries/des/README.md)| +|des max window|`15`|See [double exponential smoothing](https://github.com/netdata/netdata/blob/master/web/api/queries/des/README.md)| |listen backlog|`4096`|The port backlog. Check `man 2 listen`.| |disconnect idle clients after seconds|`60`|The time in seconds to disconnect web clients after being totally idle.| |timeout for first request|`60`|How long to wait for a client to send a request before closing the socket. Prevents slow request attacks.| -|accept a streaming request every seconds|`0`|Can be used to set a limit on how often a parent node will accept streaming requests from child nodes in a [streaming and replication setup](/streaming/README.md)| -|respect do not track policy|`no`|If set to `yes`, Netdata will respect the user's browser preferences for [Do Not Track](https://www.eff.org/issues/do-not-track) (DNT) and storing cookies. If DNT is _enabled_ in the browser, and this option is set to `yes`, users will not be able to sign in to Netdata Cloud via their local Agent dashboard, and their node will not connect to any [registry](/registry/README.md). For certain browsers, users must disable DNT and change this option to `yes` for full functionality.| +|accept a streaming request every seconds|`0`|Can be used to set a limit on how often a parent node will accept streaming requests from child nodes in a [streaming and replication setup](https://github.com/netdata/netdata/blob/master/streaming/README.md)| +|respect do not track policy|`no`|If set to `yes`, Netdata will respect the user's browser preferences for [Do Not Track](https://www.eff.org/issues/do-not-track) (DNT) and storing cookies. If DNT is _enabled_ in the browser, and this option is set to `yes`, users will not be able to sign in to Netdata Cloud via their local Agent dashboard, and their node will not connect to any [registry](https://github.com/netdata/netdata/blob/master/registry/README.md). For certain browsers, users must disable DNT and change this option to `yes` for full functionality.| |x-frame-options response header||[Avoid clickjacking attacks, by ensuring that the content is not embedded into other sites](https://developer.mozilla.org/en-US/docs/Web/HTTP/Headers/X-Frame-Options).| |enable gzip compression|`yes`|When set to `yes`, Netdata web responses will be GZIP compressed, if the web client accepts such responses.| |gzip compression strategy|`default`|Valid strategies are `default`, `filtered`, `huffman only`, `rle` and `fixed`| |