
diff options
| author | Joel Hans <joel@netdata.cloud> | 2021-02-23 09:39:28 -0700 |
|---|---|---|
| committer | GitHub <noreply@github.com> | 2021-02-23 09:39:28 -0700 |
| commit | b3eb8f41332aeb098495985bbf7c69c58cc18a24 (patch) | |
| tree | 57842d64821239133256ae7a8a2b5814d2a5adb0 /docs | |
| parent | 39612243910bf7b87eb6f6c3a69639ea5bd42046 (diff) | |
Update screenshots and text for new Cloud nav (#10664)
* Update screenshots and text for new Cloud nav
* Update screenshots with new sidebar
* Fix broken link
* alerts -> alarms
Diffstat (limited to 'docs')
| -rw-r--r-- | docs/configure/nodes.md | 2 | ||||
| -rw-r--r-- | docs/monitor/view-active-alarms.md | 19 | ||||
| -rw-r--r-- | docs/quickstart/infrastructure.md | 8 | ||||
| -rw-r--r-- | docs/visualize/overview-infrastructure.md | 15 |
4 files changed, 17 insertions, 27 deletions
diff --git a/docs/configure/nodes.md b/docs/configure/nodes.md index d0a6fd7a77..c6e58cd8bb 100644 --- a/docs/configure/nodes.md +++ b/docs/configure/nodes.md @@ -158,7 +158,7 @@ You can also take what you've learned about node configuration to enable or enha ### Related reference documentation -- [Netdata Agent · Daemon](docs/agent/daemon) +- [Netdata Agent · Daemon](/daemon/README.md) - [Netdata Agent · Health monitoring](/health/README.md) - [Netdata Agent · Notifications](/health/notifications/README.md) diff --git a/docs/monitor/view-active-alarms.md b/docs/monitor/view-active-alarms.md index 8837e48adb..9a1e59497f 100644 --- a/docs/monitor/view-active-alarms.md +++ b/docs/monitor/view-active-alarms.md @@ -9,17 +9,14 @@ custom_edit_url: https://github.com/netdata/netdata/edit/master/docs/monitor/vie Every Netdata Agent comes with hundreds of pre-installed health alarms designed to notify you when an anomaly or performance issue affects your node or the applications it runs. -As soon as you launch a Netdata Agent and [claim it](/docs/get/README.md#claim-your-node-on-netdata-cloud), you can view -active alarms in both the local dashboard and Netdata Cloud. +## Netdata Cloud -## View active alarms in Netdata Cloud - -You can see active alarms from any node in your infrastructure in two ways: Click on the bell 🔔 icon in the top -navigation, or click on the first column of any node's row in Nodes. This column's color changes based on the node's -[health status](/health/REFERENCE.md#alarm-statuses): gray is `CLEAR`, yellow is `WARNING`, and red is `CRITICAL`. +A War Room's [alarms indicator](/docs/cloud/war-rooms#indicators) displays the number of active `critical` (red) and +`warning` (yellow) alerts for the nodes in this War Room. Click on either the critical or warning badges to open a +pre-filtered modal displaying only those types of [active alarms](/docs/cloud/monitoring/alarms). 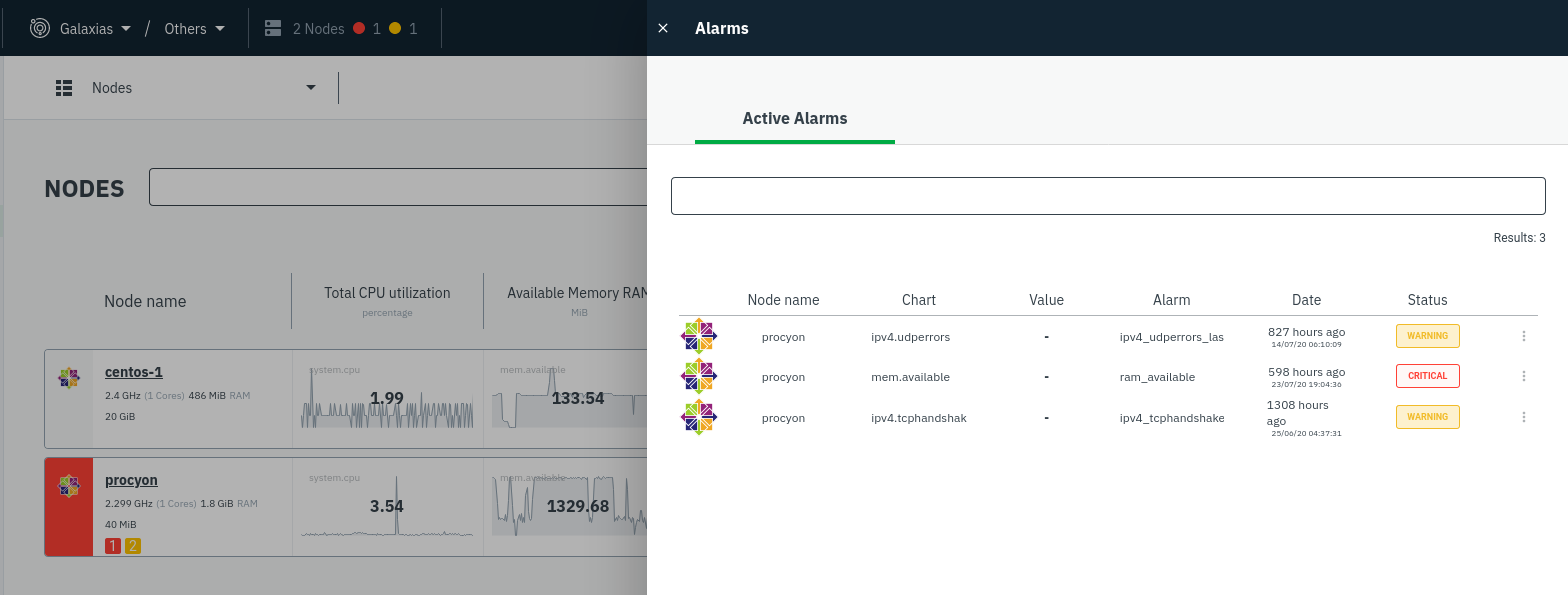 +Cloud](https://user-images.githubusercontent.com/1153921/108564747-d2bfbb00-72c0-11eb-97b9-5863ad3324eb.png) The Alarms panel lists all active alarms for nodes within that War Room, and tells you which chart triggered the alarm, what that chart's current value is, the alarm that triggered it, and when the alarm status first began. @@ -35,10 +32,10 @@ The active alarm information gives you details about the alarm that's been trigg configuration, how it calculates warning or critical alarms, and which configuration file you could edit on that node if you want to tweak or disable the alarm to better suit your needs. -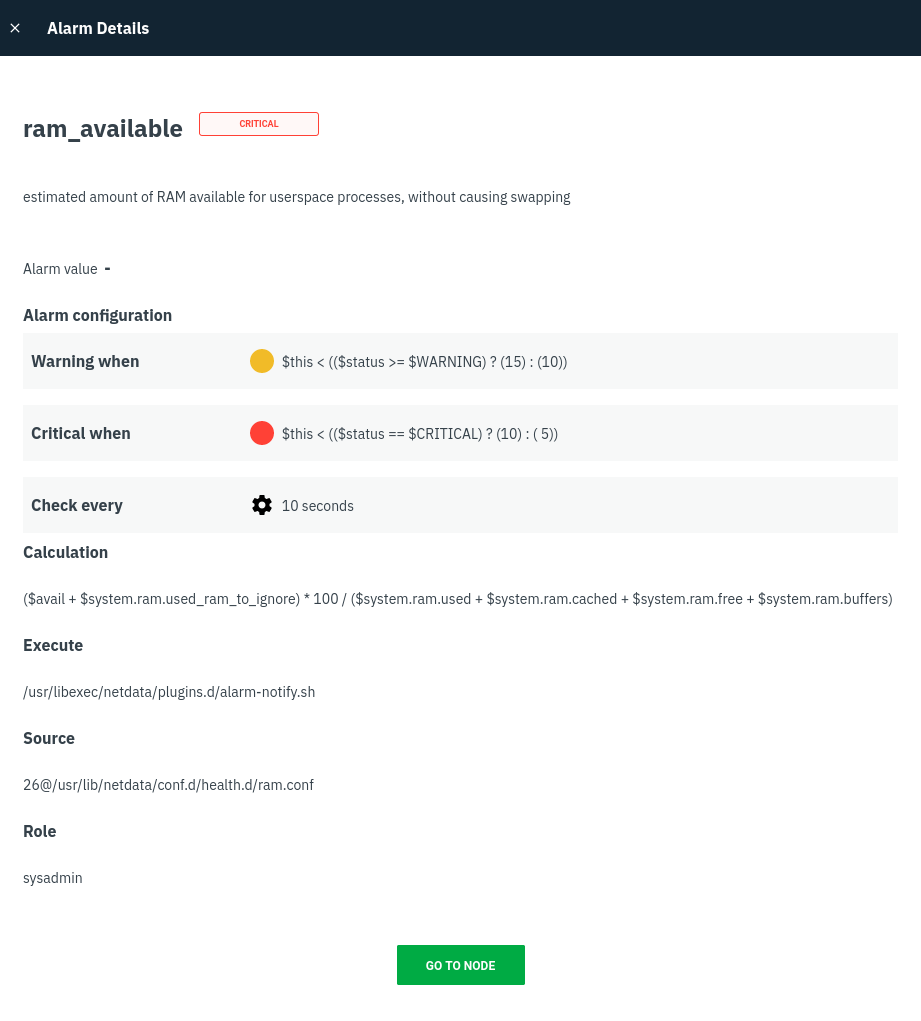 +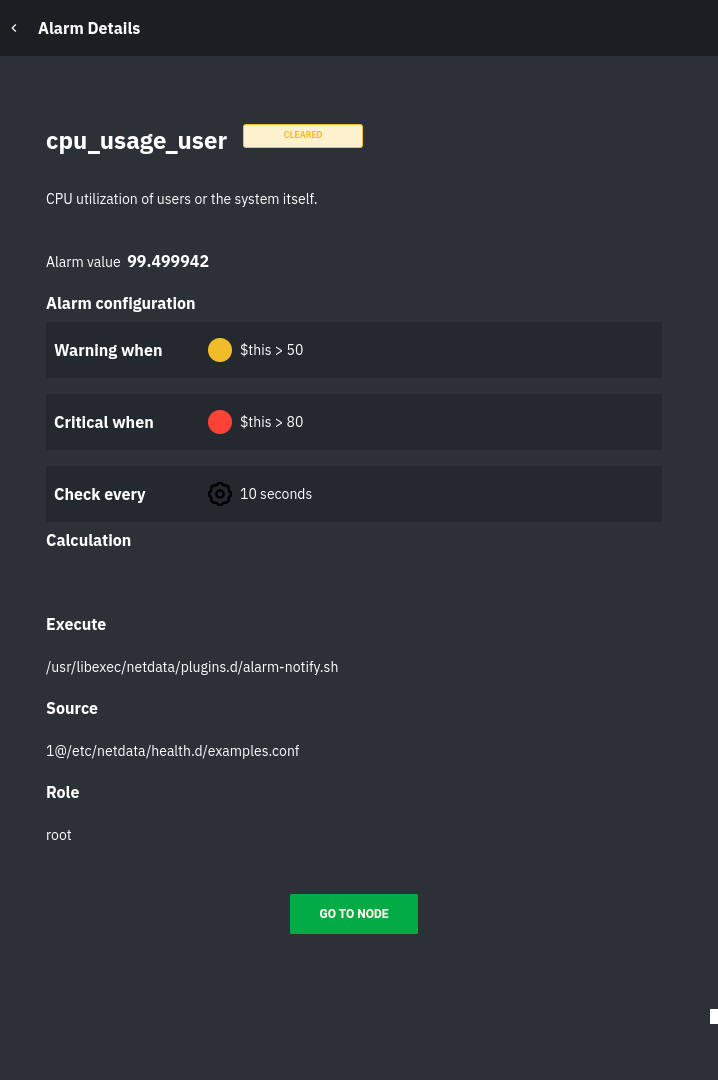 -## View active alarms in the Netdata Agent +## Local Netdata Agent dashboard Find the bell 🔔 icon in the top navigation to bring up a modal that shows currently raised alarms, all running alarms, and the alarms log. Here is an example of a raised `system.cpu` alarm, followed by the full list and alarm log: diff --git a/docs/quickstart/infrastructure.md b/docs/quickstart/infrastructure.md index 0e355f373e..8ec9b75cb6 100644 --- a/docs/quickstart/infrastructure.md +++ b/docs/quickstart/infrastructure.md @@ -62,8 +62,8 @@ inviting others, you can better synchronize with your team or colleagues to unde When something goes wrong, you'll be ready to collaboratively troubleshoot complex performance problems from a single pane of glass. -To invite new users, click on **Invite Users** in the left-hand navigation panel beneath your Space's name. Choose which -War Rooms to add this user to, then click **Send**. +To [invite new users](https://learn.netdata.cloud/docs/cloud/manage/invite-your-team), click on **Invite Users** in the +Space management Area. Choose which War Rooms to add this user to, then click **Send**. If your team members have trouble signing in, direct them to the [Netdata Cloud sign in](https://learn.netdata.cloud/docs/cloud/manage/sign-in) doc. @@ -76,7 +76,7 @@ Overview features composite charts, which display aggregated metrics from every are streamed on-demand from individual nodes and composited onto a single, familiar dashboard. 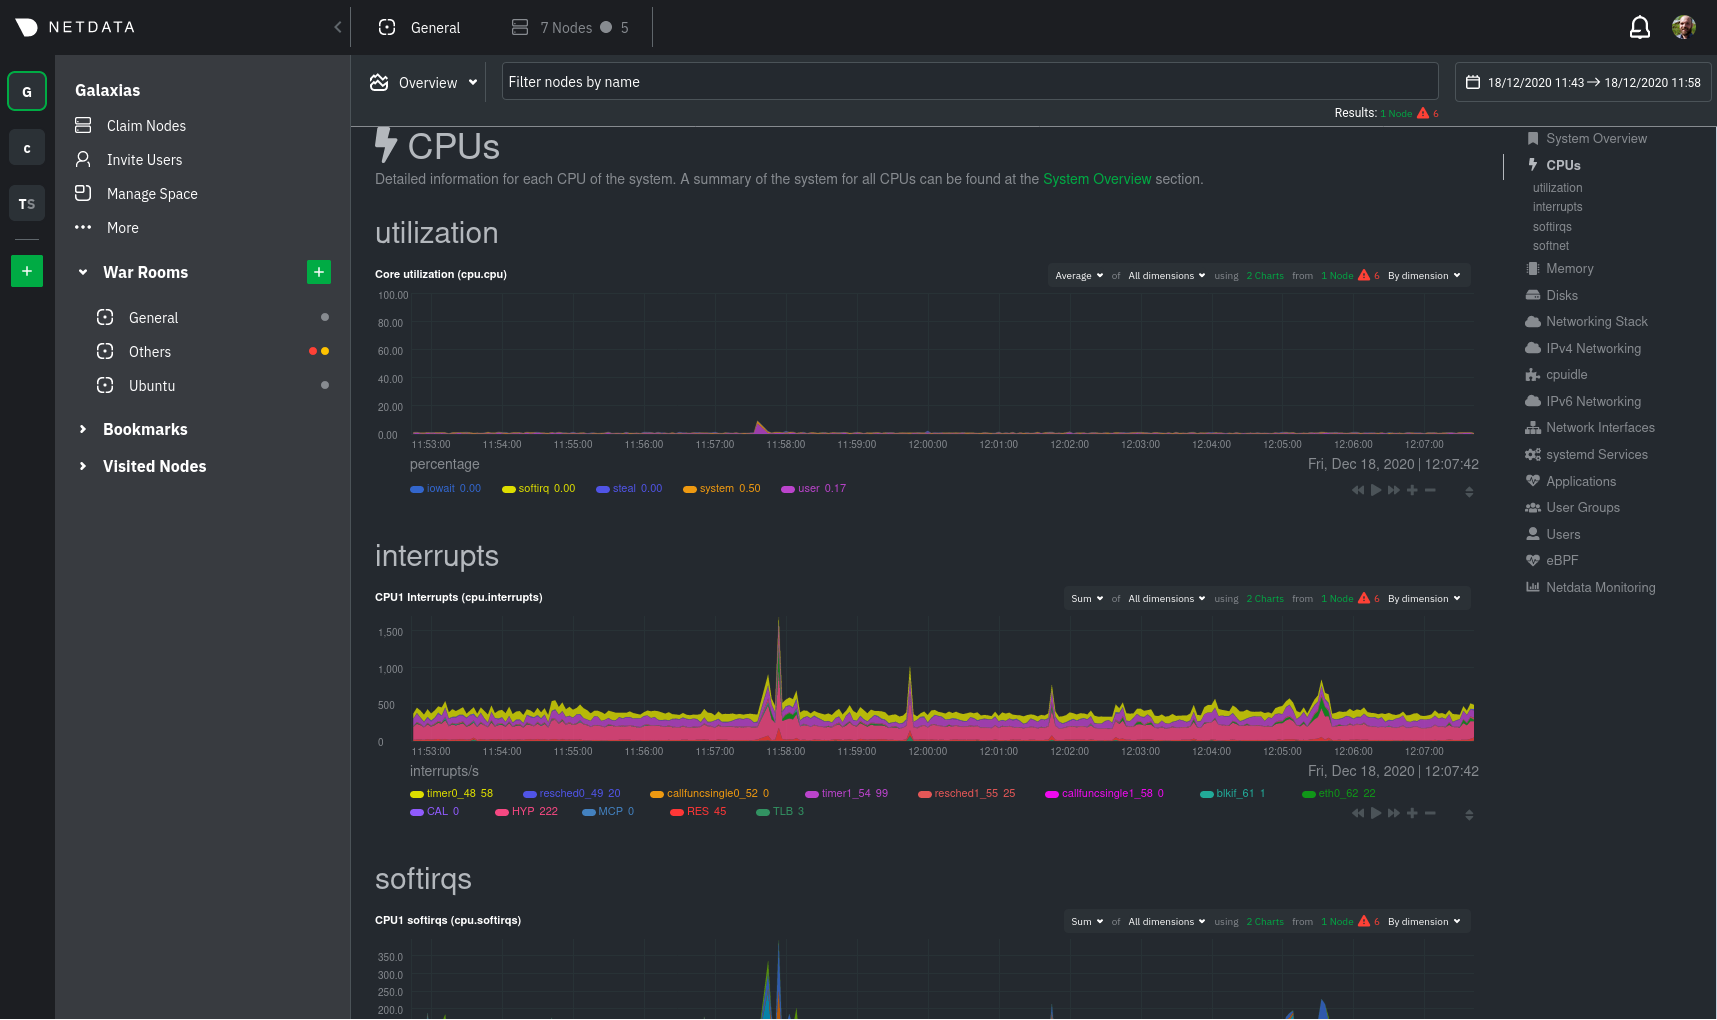 +Overview](https://user-images.githubusercontent.com/1153921/108732681-09791980-74eb-11eb-9ba2-98cb1b6608de.png) Read more about the Overview in the [infrastructure overview](/docs/visualize/overview-infrastructure.md) doc. @@ -101,7 +101,7 @@ complex issues by aggregating correlated charts from any number of nodes. For ex from every node in your infrastructure on a single dashboard. 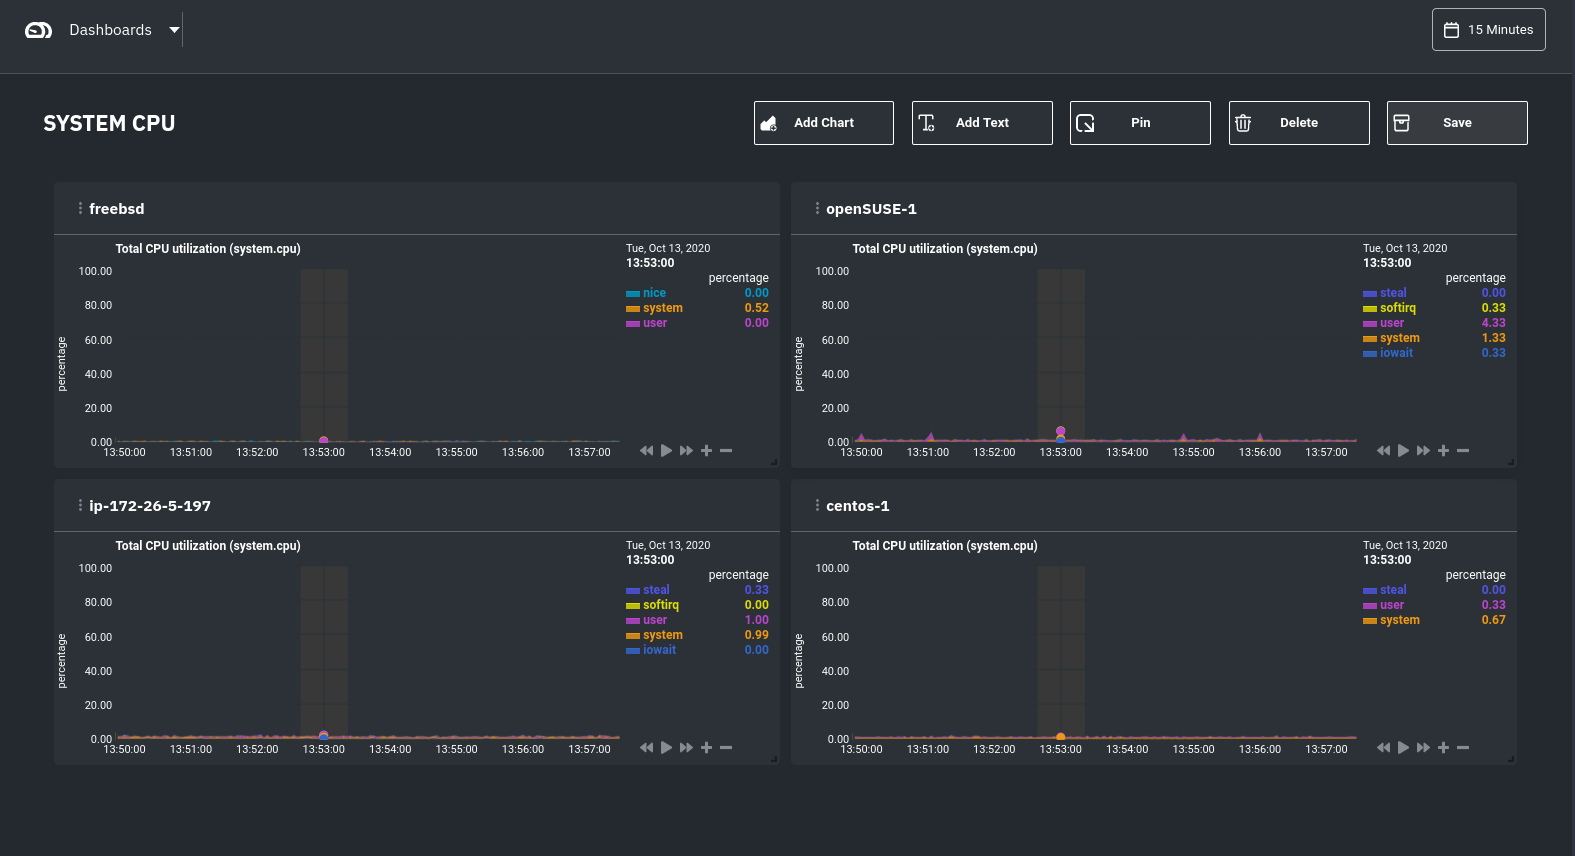 +dashboard](https://user-images.githubusercontent.com/1153921/108732974-4b09c480-74eb-11eb-87a2-c67e569c08b6.png) Read more about [creating new dashboards](/docs/visualize/create-dashboards.md) for more details about the process and additional tips on best leveraging the feature to help you troubleshoot complex performance problems. diff --git a/docs/visualize/overview-infrastructure.md b/docs/visualize/overview-infrastructure.md index 675abd745b..c07e37b069 100644 --- a/docs/visualize/overview-infrastructure.md +++ b/docs/visualize/overview-infrastructure.md @@ -7,22 +7,18 @@ custom_edit_url: https://github.com/netdata/netdata/edit/master/docs/visualize/o # See an overview of your infrastructure In Netdata Cloud, your nodes are organized into War Rooms. One of the two available views for a War Room is the -**Overview**, which uses composite charts to display real-time, aggregated metrics from all the nodes (or a filtered -selection) in a given War Room. +[**Overview**](https://learn.netdata.cloud/docs/cloud/visualize/overview), which uses composite charts to display +real-time, aggregated metrics from all the nodes (or a filtered selection) in a given War Room. With Overview's composite charts, you can see your infrastructure from a single pane of glass, discover trends or anomalies, then drill down with filtering or single-node dashboards to see more. In the screenshot below, each chart visualizes average or sum metrics values from across 5 distributed nodes.  +Overview](https://user-images.githubusercontent.com/1153921/108732681-09791980-74eb-11eb-9ba2-98cb1b6608de.png) ## Using the Overview -> ⚠️ In order for nodes to contribute to composite charts, and thus the Overview UI, they must run v1.26.0 or later of -> the Netdata Agent. See our [update docs](/packaging/installer/UPDATE.md) for the preferred update method based on how -> you installed the Agent. - The Overview uses roughly the same interface as local Agent dashboards or single-node dashboards in Netdata Cloud. By showing all available metrics from all your nodes in a single interface, Netdata Cloud helps you visualize the overall health of your infrastructure. Best of all, you don't have to worry about creating your own dashboards just to get @@ -79,9 +75,6 @@ contributing. Click on the link icon <img class="img__inline img__inline--link" src="https://user-images.githubusercontent.com/1153921/95762109-1d219300-0c62-11eb-8daa-9ba509a8e71c.png" /> next to a given node to quickly _jump to the same chart in that node's single-node dashboard_ in Netdata Cloud. - - You can use single-node dashboards in Netdata Cloud to drill down on specific issues, scrub backward in time to investigate historical data, and see like metrics presented meaningfully to help you troubleshoot performance problems. All of the familiar [interactions](/docs/visualize/interact-dashboards-charts.md) are available, as is adding any chart @@ -92,7 +85,7 @@ to a [new dashboard](/docs/visualize/create-dashboards.md). You can also use the **Nodes view** to monitor the health status and user-configurable key metrics from multiple nodes in a War Room. Read the [Nodes view doc](https://learn.netdata.cloud/docs/cloud/visualize/nodes) for details. -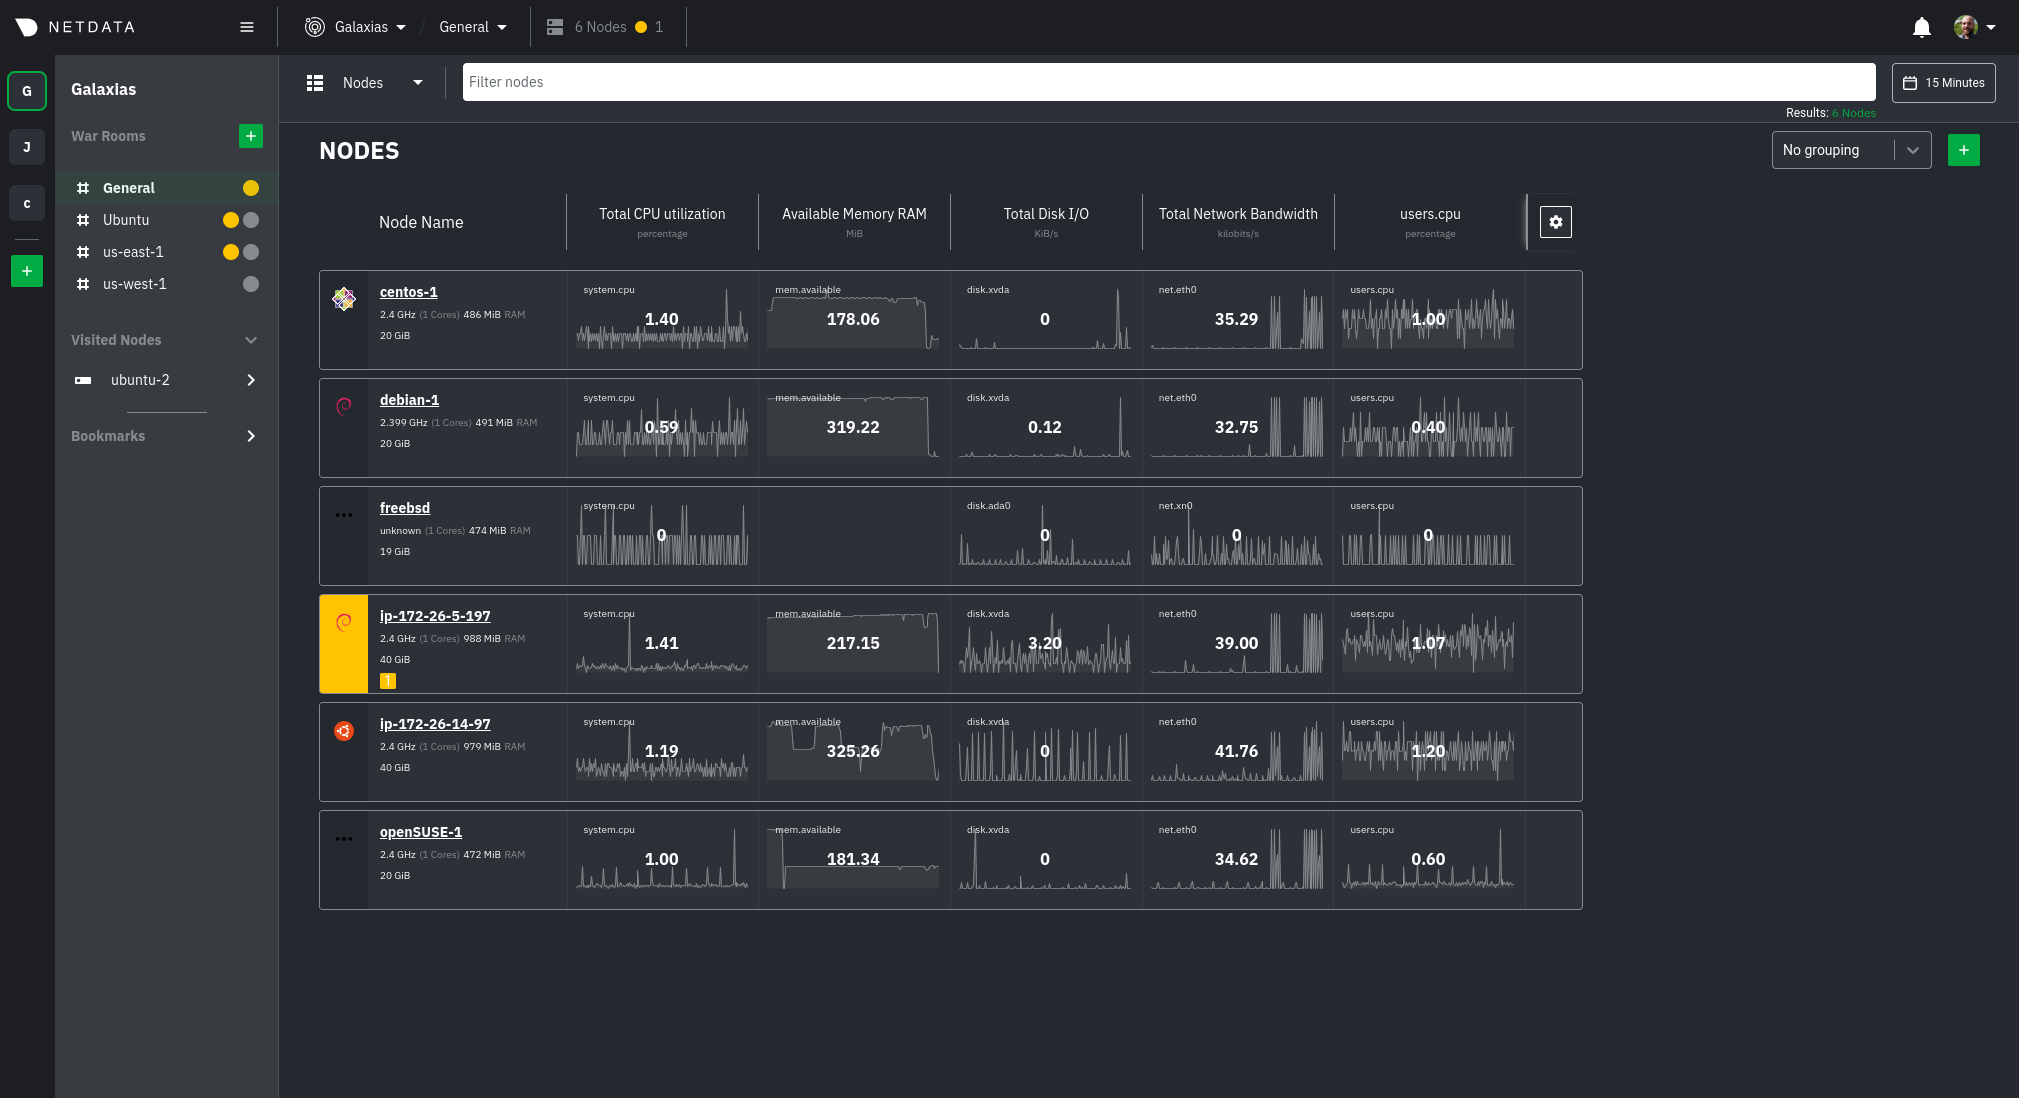 +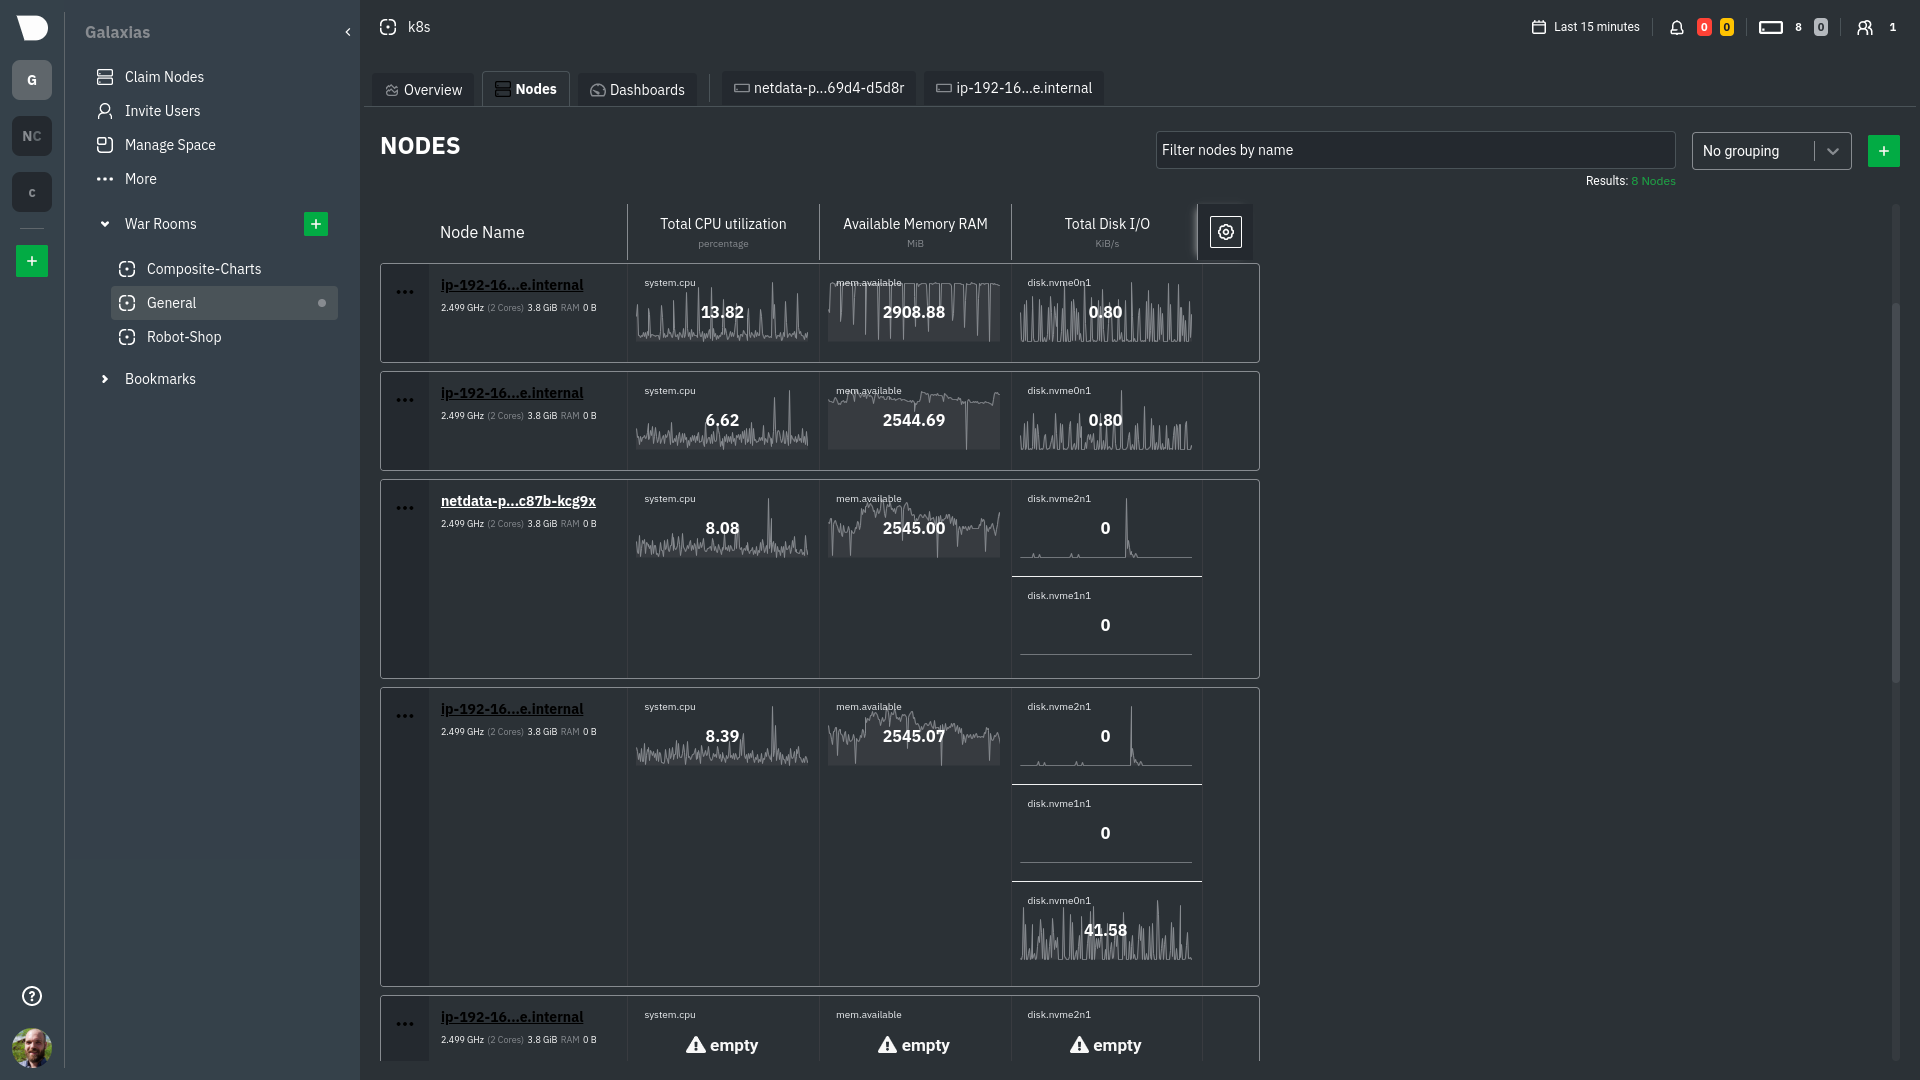 ## What's next? |