
diff options
| author | Joel Hans <joel@netdata.cloud> | 2020-12-07 14:48:52 -0700 |
|---|---|---|
| committer | GitHub <noreply@github.com> | 2020-12-07 14:48:52 -0700 |
| commit | a80af1b120af6504c1b42f4c80882c5efc461a8d (patch) | |
| tree | 88cff6f61c0e28a50e11e967c344298bfb10b713 /docs | |
| parent | 6d91cedecd5ee3f58e5fe8af48ea5eac33abb967 (diff) | |
Improve core documentation to align with recent Netdata Cloud releases (#10318)
* Change overview doc with group by node
* Add hash to link
* Update core documentation with latest from Cloud
* Fix link
* Fixes for Amy
* Fixes for Odysseas
Diffstat (limited to 'docs')
| -rw-r--r-- | docs/configure/invite-collaborate.md | 58 | ||||
| -rw-r--r-- | docs/configure/nodes.md | 7 | ||||
| -rw-r--r-- | docs/configure/secure-nodes.md | 4 | ||||
| -rw-r--r-- | docs/configure/spaces-war-rooms.md | 87 | ||||
| -rw-r--r-- | docs/guides/troubleshoot/monitor-debug-applications-ebpf.md | 2 | ||||
| -rw-r--r-- | docs/quickstart/infrastructure.md | 117 | ||||
| -rw-r--r-- | docs/visualize/interact-dashboards-charts.md | 2 | ||||
| -rw-r--r-- | docs/visualize/overview-infrastructure.md | 47 |
8 files changed, 104 insertions, 220 deletions
diff --git a/docs/configure/invite-collaborate.md b/docs/configure/invite-collaborate.md deleted file mode 100644 index 0949066c76..0000000000 --- a/docs/configure/invite-collaborate.md +++ /dev/null @@ -1,58 +0,0 @@ -<!-- -title: "Invite your team and collaborate" -description: "Invite your SRE, DevOPs, or ITOps teams to Netdata Cloud to give everyone insights into your infrastructure from a single pane of glass." -custom_edit_url: https://github.com/netdata/netdata/edit/master/docs/configure/invite-collaborate.md ---> - -# Invite your team and collaborate - -Netdata is designed to make an infrastructure's real-time metrics available and actionable to all organization members. -By inviting others, you can better synchronize with your team or colleagues to understand your infrastructure's -heartbeat. When something goes wrong, you'll be ready to collaboratively troubleshoot complex performance problems from -a single pane of glass. - -## Invite new members - -Invite new users by clicking on your Space's name in the top navigation, and then **Invite more users**, to open the -invitation pane. Admins manage user permissions and have control over who can access specific Spaces and War Rooms. - - - -Enter their email address and name. They can change this name once they accept your invitation. - -Choose which War Rooms you want to add this user to, then click the plus **+** button to add the invitation to the -**New invitations to be sent** queue. Repeat the process with everyone you want to invite to your Space. - -When you're ready to send the new invitations you created, hit the **Send** button. Netdata Cloud sends these -invitations and moves them to the **Invitations awaiting response** category. - -Your team will receive their email invitations momentarily with a prompt to sign in to join your Space. - -## Collaboration with Netdata Cloud - -Netdata Cloud gives teams a single interface to view real-time metrics across their entire infrastructure. Having all -the metrics, alarm statuses, dashboards, and people in one place is a powerful asset for any infrastructure monitoring -team. - -Assets like dashboards and bookmarks are shared between members of a War Room. As soon as one member creates a -dashboard, for example, other members of the same War Room can see it in the War Room's dropdown and supplement it with -additional charts/text. - -Let's say you get an alert from your nodes about an excess of 500-type errors in your Nginx logs. Your team can hop on a -Slack call to begin working together. While one engineer handles creating a new dashboard with a half-dozen relevant -Nginx log metrics, another can dive into the real-time node dashboard and investigate correlated charts in granular -detail. - -## What's next? - -If your team members have trouble signing in, direct them to the [Netdata Cloud sign in -doc](https://learn.netdata.cloud/docs/cloud/manage/sign-in). Or, find answers to other common questions about Netdata -Cloud in our [FAQ](https://learn.netdata.cloud/docs/cloud/faq-glossary). - -Next, we recommend you learn the [basics of node configuration](/docs/configure/nodes.md). While the Netdata Agent is -proudly zero-configuration in most cases, you should understand how to tweak its settings to give you the best Netdata, -for example, to [increase metrics retention](/docs/store/change-metrics-storage.md) and [improve -security](/docs/configure/secure-nodes.md). - -[](<>) diff --git a/docs/configure/nodes.md b/docs/configure/nodes.md index 761350b161..89aa760a69 100644 --- a/docs/configure/nodes.md +++ b/docs/configure/nodes.md @@ -1,13 +1,14 @@ <!-- -title: "Configure your nodes" +title: "Configure the Netdata Agent" description: "Netdata is zero-configuration for most users, but complex infrastructures may require you to tweak some of the Agent's granular settings." custom_edit_url: https://github.com/netdata/netdata/edit/master/docs/configure/nodes.md --> -# Configure your nodes +# Configure the Netdata Agent Netdata's zero-configuration collection, storage, and visualization features work for many users, infrastructures, and -use cases, but there are some situations where you might want to configure your nodes. +use cases, but there are some situations where you might want to configure the Netdata Agent running on your node(s), +which can be a physical or virtual machine (VM), container, cloud deployment, or edge/IoT device. For example, you might want to increase metrics retention, configure a collector based on your infrastructure's unique setup, or secure the local dashboard by restricting it to only connections from `localhost`. diff --git a/docs/configure/secure-nodes.md b/docs/configure/secure-nodes.md index 1dce5d11e4..e58102401d 100644 --- a/docs/configure/secure-nodes.md +++ b/docs/configure/secure-nodes.md @@ -1,8 +1,6 @@ <!-- title: "Secure your nodes" -description: "Your data and systems are safe with Netdata, but - -we recommend a few easy ways to improve the security of your infrastructure." +description: "Your data and systems are safe with Netdata, but we recommend a few easy ways to improve the security of your infrastructure." custom_edit_url: https://github.com/netdata/netdata/edit/master/docs/configure/secure-nodes.md --> diff --git a/docs/configure/spaces-war-rooms.md b/docs/configure/spaces-war-rooms.md deleted file mode 100644 index 6b45aab6f0..0000000000 --- a/docs/configure/spaces-war-rooms.md +++ /dev/null @@ -1,87 +0,0 @@ -<!-- -title: "Set up Spaces and War Rooms" -description: "Netdata Cloud allows people and teams of all sizes to organize their infrastructure and collaborate on anomalies or incidents." -custom_edit_url: https://github.com/netdata/netdata/edit/master/docs/configure/spaces-war-rooms.md ---> - -# Set up Spaces and War Rooms - -Spaces and War Rooms help you organize your real-time infrastructure monitoring experience in Netdata Cloud. You already -created a Space and War Room when you first signed in to Cloud, assuming you weren't invited to an existing Space by -someone else. - -In either case, you can always create new Spaces and War Rooms based on your changing needs or a scaled-up -infrastructure. Let's talk through some strategies for building the most intuitive Cloud experience for your team. - -> This guide assumes you've already [signed in](https://app.netdata.cloud) to Netdata Cloud and finished creating your -> account. If you're not interested in Netdata Cloud's features, you can skip ahead to [node configuration -> basics](/docs/configure/nodes.md). - -## Spaces - -Spaces are high-level containers to help you organize your team members and the nodes they can view in each War Room. -You already have at least one Space in your Netdata Cloud account. - -To create a new Space, click the **+** icon, enter its name, and click **Save**. Netdata Cloud distinguishes between -Spaces with abbreviated versions of their name. Click on any of the icons to switch between them. - - - -The organization you choose will likely be based on two factors: - -1. The fact that any node can be claimed to a single Space. -2. The size of your team and the complexity of the infrastructure you monitor. - -A single Space puts all your metrics in one easily-accessible place, while multiple Spaces creates logical division -between different users and different pieces of a large infrastructure. - -For example, a large organization might have one SRE team for the user-facing SaaS application, and a second IT team for -managing employees' hardware. Since these teams don't monitor the same nodes, they can work in separate Spaces and then -further organize their nodes into War Rooms. - -You can also use multiple Spaces for different aspects of your monitoring "life," such as your work infrastructure -versus your homelab. - -## War Rooms - -War Rooms are granular containers for organizing nodes, viewing key metrics in real-time, and monitoring the health and -alarm status of many nodes. - -War Rooms organize the [at-a-glance Node view](/docs/visualize/view-all-nodes.md) and any [new -dashboards](/docs/visualize/create-dashboards.md) you build. - -We recommend a few strategies for organizing your War Rooms. - -**Service, purpose, location, etc.**: You can group War Rooms by a service (think Nginx, MySQL, Pulsar, and so on), -their purpose (webserver, database, application), their physical location, whether they're baremetal or a Docker -container, the PaaS/cloud provider it runs on, and much more. This allows you to see entire slices of your -infrastructure by moving from one War Room to another. - -**End-to-end apps/services**: If you have a user-facing SaaS product, or an internal service that said product relies -on, you may want to monitor that entire stack in a single War Room. This might include Kubernetes clusters, Docker -containers, proxies, databases, web servers, brokers, and more. End-to-end War Rooms are valuable tools for ensuring the -health and performance of your organization's essential services. - -**Incident response**: You can also create new War Rooms as one of the first steps in your incident response process. -For example, you have a user-facing web app that relies on Apache Pulsar for a message queue, and one of your nodes -using the [Pulsar collector](https://learn.netdata.cloud/docs/agent/collectors/go.d.plugin/modules/pulsar) begins -reporting a suspiciously low messages rate. You can create a War Room called `$year-$month-$day-pulsar-rate`, add all -your Pulsar nodes in addition to nodes they connect to, and begin diagnosing the root cause in a War Room optimized for -getting to resolution as fast as possible. - -For example, here is a War Room based on the node's provider and physical location (**us-east-1**). - - - -## What's next? - -Once you've figured out an organizational structure that works for your infrastructure, it's time to [invite your -team](/docs/configure/invite-collaborate.md). You can invite any number of colleagues to help you collectively -troubleshoot the most complex of infrastructure-wide performance issues. - -If you don't have a team or aren't ready to invite them, you can skip ahead to learn the [basics of node -configuration](/docs/configure/nodes.md). - -[](<>) diff --git a/docs/guides/troubleshoot/monitor-debug-applications-ebpf.md b/docs/guides/troubleshoot/monitor-debug-applications-ebpf.md index 5a3d269c0b..af121b3de9 100644 --- a/docs/guides/troubleshoot/monitor-debug-applications-ebpf.md +++ b/docs/guides/troubleshoot/monitor-debug-applications-ebpf.md @@ -246,7 +246,7 @@ Click **Save** to add the chart for all your claimed nodes. Now you can see how Linux kernels on multiple Linux systems. Now that you can see these metrics in Netdata Cloud, you can [invite your -team](https://learn.netdata.cloud/docs/cloud/collaborate/invite-your-team) and share your findings with others. +team](https://learn.netdata.cloud/docs/cloud/manage/invite-your-team) and share your findings with others. ## What's next? diff --git a/docs/quickstart/infrastructure.md b/docs/quickstart/infrastructure.md index db1756483f..aa89d7a533 100644 --- a/docs/quickstart/infrastructure.md +++ b/docs/quickstart/infrastructure.md @@ -7,50 +7,83 @@ custom_edit_url: https://github.com/netdata/netdata/edit/master/docs/quickstart/ # Infrastructure monitoring with Netdata -Together, the Netdata Agent and Netdata Cloud create a powerful, infinitely-scalable infrastructure monitoring solution. +[Netdata Cloud](https://app.netdata.cloud) provides scalable infrastructure monitoring for any number of distributed +nodes running the Netdata Agent. A node is any system in your infrastructure that you want to monitor, whether it's a +physical or virtual machine (VM), container, cloud deployment, or edge/IoT device. The Netdata Agent uses zero-configuration collectors to gather metrics from every application and container instantly, and uses Netdata's [distributed data architecture](/docs/store/distributed-data-architecture.md) to store metrics locally. Without a slow and troublesome centralized data lake for your infrastructure's metrics, you reduce the resources you need to invest in, and the complexity of, monitoring your infrastructure. -Netdata Cloud unifies monitoring your infrastructure by _centralizing the interface_ you use to query and visualize your +Netdata Cloud unifies infrastructure monitoring by _centralizing the interface_ you use to query and visualize your nodes' metrics, not the data. By streaming metrics values to your browser, with Netdata Cloud acting as the secure proxy between them, you can monitor your infrastructure using customizable, interactive, and real-time visualizations from any numbe of distributed nodes. -In this quickstart guide, you'll learn how to see key metrics from all your nodes in one interface and build your first -dashboard for aggregating like metrics from many distributed nodes. You'll then take a peek into configuring individual -nodes and get helpful pointers about collecting all the metrics from every critical application in your infrastructure. +In this quickstart guide, you'll learn the basics of using Netdata Cloud to monitor an infrastructure with dashboards, +composite charts, and alarm viewing. You'll then learn about the most critical ways to configure the Agent on each of +your nodes to maximize the value you get from Netdata. -> This quickstart assumes you've installed the Netdata Agent on more than one node in your infrastructure, and claimed -> those nodes to your Space in Netdata Cloud. If you haven't yet, see the [_Get Netdata_ doc](/docs/get/README.md) for -> details on installation and claiming. +This quickstart assumes you've installed the Netdata Agent on more than one node in your infrastructure, and claimed +those nodes to your Space in Netdata Cloud. If you haven't yet, see the [_Get Netdata_ doc](/docs/get/README.md) for +details on signing up for Netdata Cloud, installation, and claiming. > If you want to monitor a Kubernetes cluster with Netdata, see our [k8s installation > doc](/packaging/installer/methods/kubernetes.md) for setup details, and then read our guide, [_Monitor a Kubernetes > cluster with Netdata_](/docs/guides/monitor/kubernetes-k8s-netdata.md). -## See an overview of your infrastructure +## Set up your Netdata Cloud experience -To see all your nodes from a single pane of glass, first [sign in](https://app.netdata.cloud) to Netdata Cloud. As you -navigate to a particular War Room, Netdata Cloud pings each claimed node to start on-demand streaming from your nodes to -your browser. +Start your infrastructure monitoring experience by setting up your Netdata Cloud account. -Netdata Cloud then visualizes all these metrics, from any number of distributed nodes, in the War Room's **Overview**. -The Overview features composite charts, which display aggregated metrics from multiple nodes. +### Organize Spaces and War Rooms + +Spaces are high-level containers to help you organize your team members and the nodes they can view in each War Room. +You already have at least one Space in your Netdata Cloud account. + +A single Space puts all your metrics in one easily-accessible place, while multiple Spaces creates logical division +between different users and different pieces of a large infrastructure. For example, a large organization might have one +SRE team for the user-facing SaaS application, and a second IT team for managing employees' hardware. Since these teams +don't monitor the same nodes, they can work in separate Spaces and then further organize their nodes into War Rooms. + +Next, set up War Rooms. Netdata Cloud creates dashboards and visualizations based on the nodes added to a given War +Room. You can [organize War Rooms](https://learn.netdata.cloud/docs/cloud/war-rooms#war-room-organization) in any way +you want, such as by the application type, for end-to-end application monitoring, or as an incident response tool. + +Learn more about [Spaces](https://learn.netdata.cloud/docs/cloud/spaces) and [War +Rooms](https://learn.netdata.cloud/docs/cloud/war-rooms), including how to manage each, in their respective reference +documentation. + +### Invite your team + +Netdata Cloud makes an infrastructure's real-time metrics available and actionable to all organization members. By +inviting others, you can better synchronize with your team or colleagues to understand your infrastructure's heartbeat. +When something goes wrong, you'll be ready to collaboratively troubleshoot complex performance problems from a single +pane of glass. + +To invite new users, click on **Invite Users** in the left-hand navigation panel beneath your Space's name. Choose which +War Rooms to add this user to, then click **Send**. + +If your team members have trouble signing in, direct them to the [Netdata Cloud sign +in](https://learn.netdata.cloud/docs/cloud/manage/sign-in) doc. + +### See an overview of your infrastructure + +The default way to visualize the health and performance of an infrastructure with Netdata Cloud is the +[**Overview**](/docs/visualize/overview-infrastructure.md), which is the default interface of every War Room. The +Overview features composite charts, which display aggregated metrics from every node in a given War Room. These metrics +are streamed on-demand from individual nodes and composited onto a single, familiar dashboard. 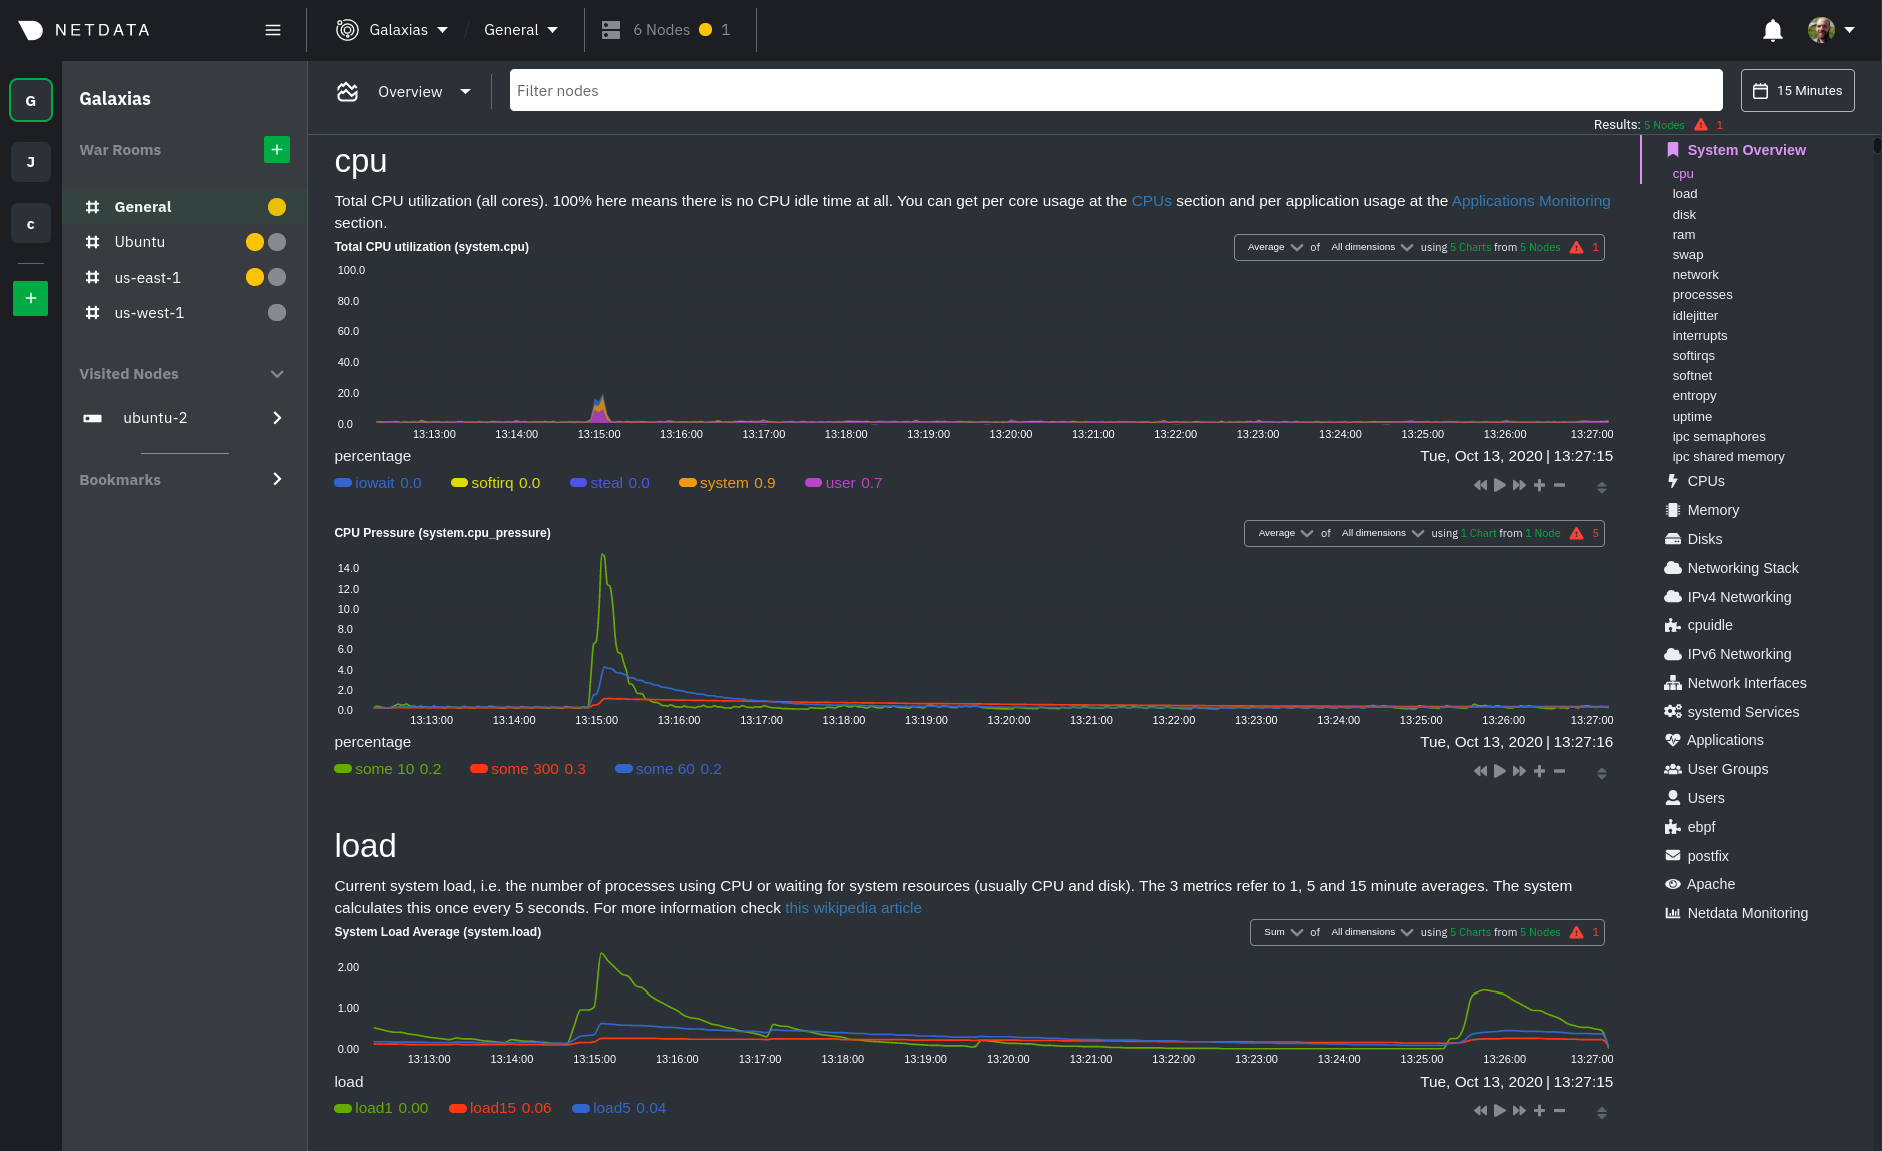 -Netdata Cloud also features the **Nodes view**, which you can use to configure and see a few key metrics from every node -in the War Room, view health status, and more. - -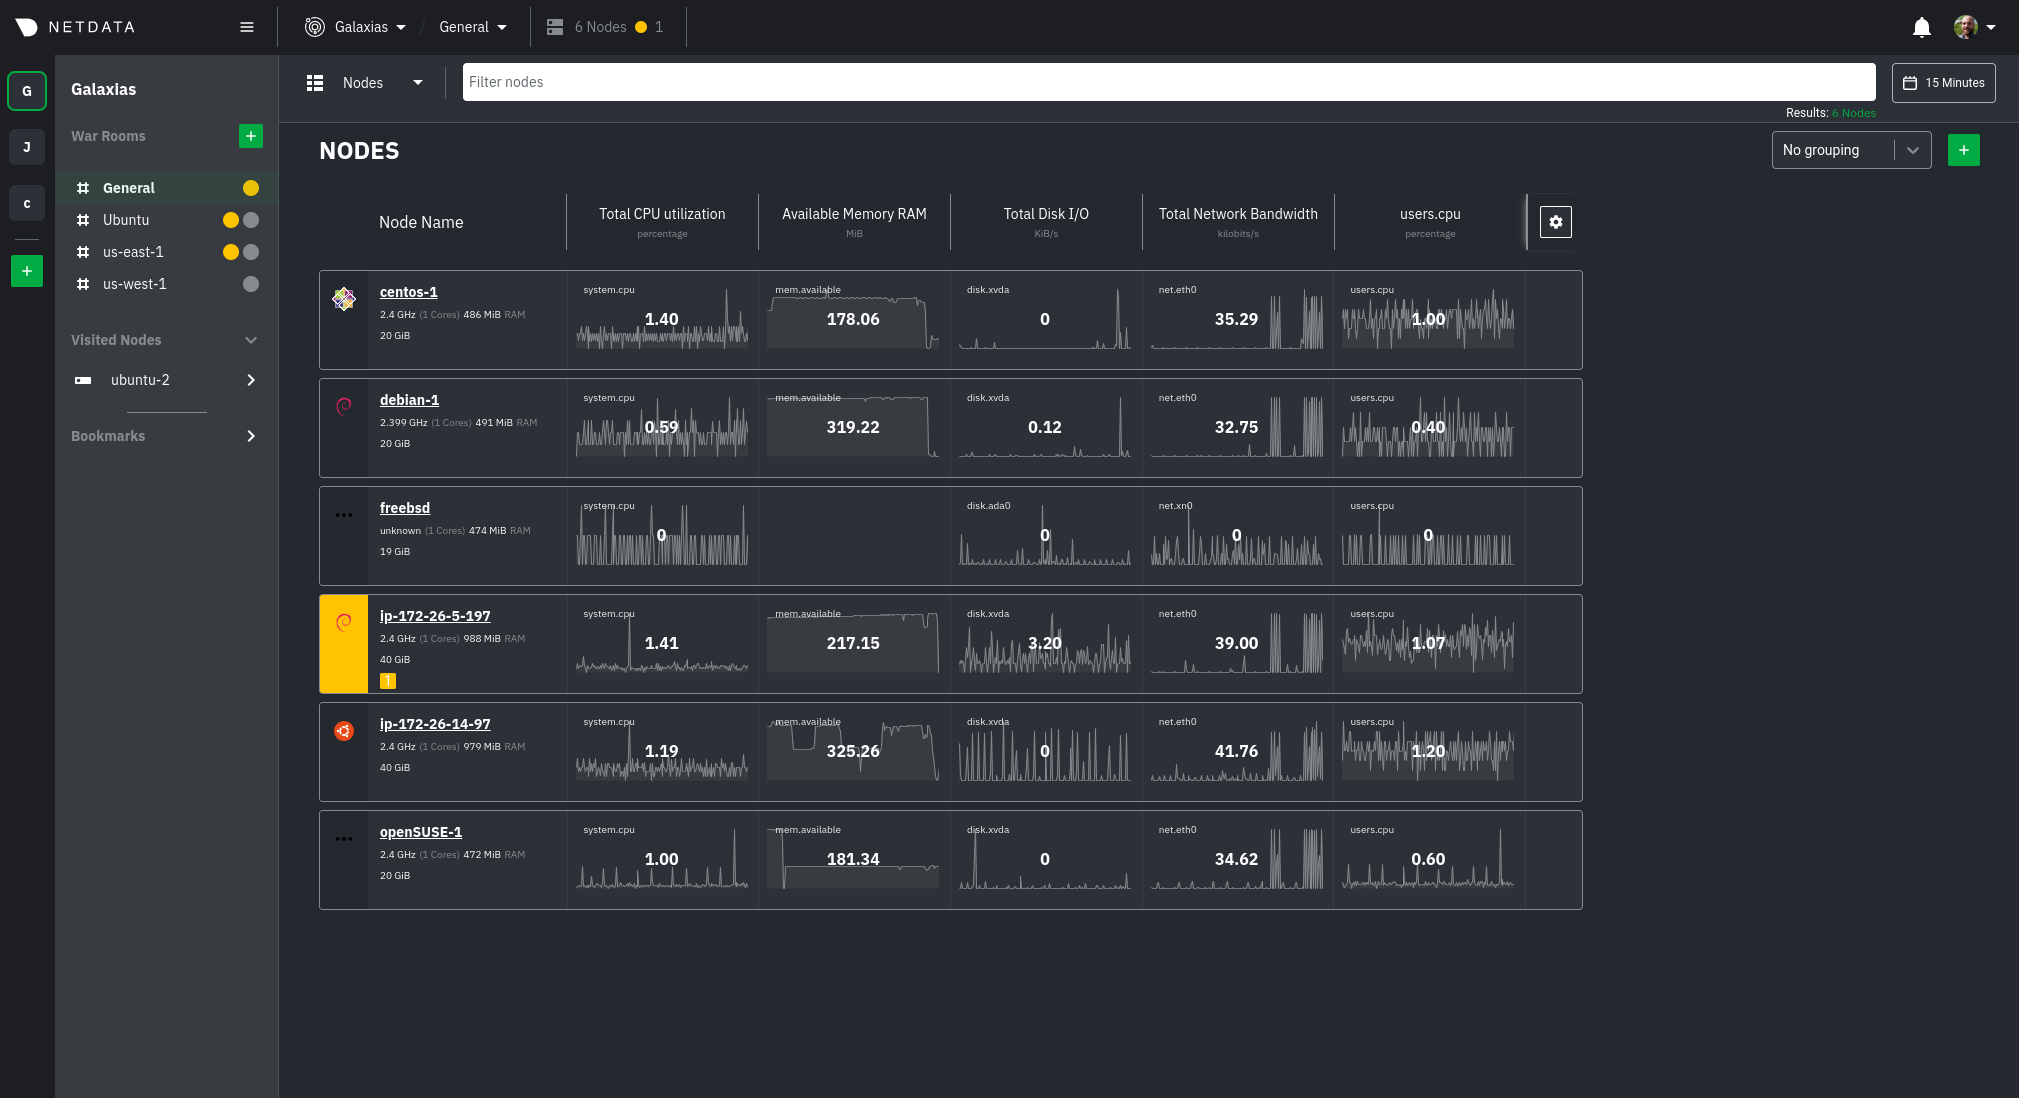 +Read more about the Overview in the [infrastructure overview](/docs/visualize/overview-infrastructure.md) doc. -Read more about both features in the [infrastructure overview](/docs/visualize/overview-infrastructure.md) doc. +Netdata Cloud also features the [**Nodes view**](https://learn.netdata.cloud/docs/cloud/visualize/nodes), which you can +use to configure and see a few key metrics from every node in the War Room, view health status, and more. -## Drill down to specific nodes +### Drill down to specific nodes Both the Overview and Nodes view offer easy access to **single-node dashboards** for targeted analysis. You can use single-node dashboards in Netdata Cloud to drill down on specific issues, scrub backward in time to investigate @@ -61,7 +94,7 @@ overview](/docs/visualize/overview-infrastructure.md#single-node-dashboards) doc dashboards and charts](/docs/visualize/interact-dashboards-charts.md) to get the most from all of Netdata's real-time metrics. -## Create new dashboards +### Create new dashboards You can use Netdata Cloud to create new dashboards that match your infrastructure's topology or help you diagnose complex issues by aggregating correlated charts from any number of nodes. For example, you could monitor the system CPU @@ -69,12 +102,21 @@ from every node in your infrastructure on a single dashboard. 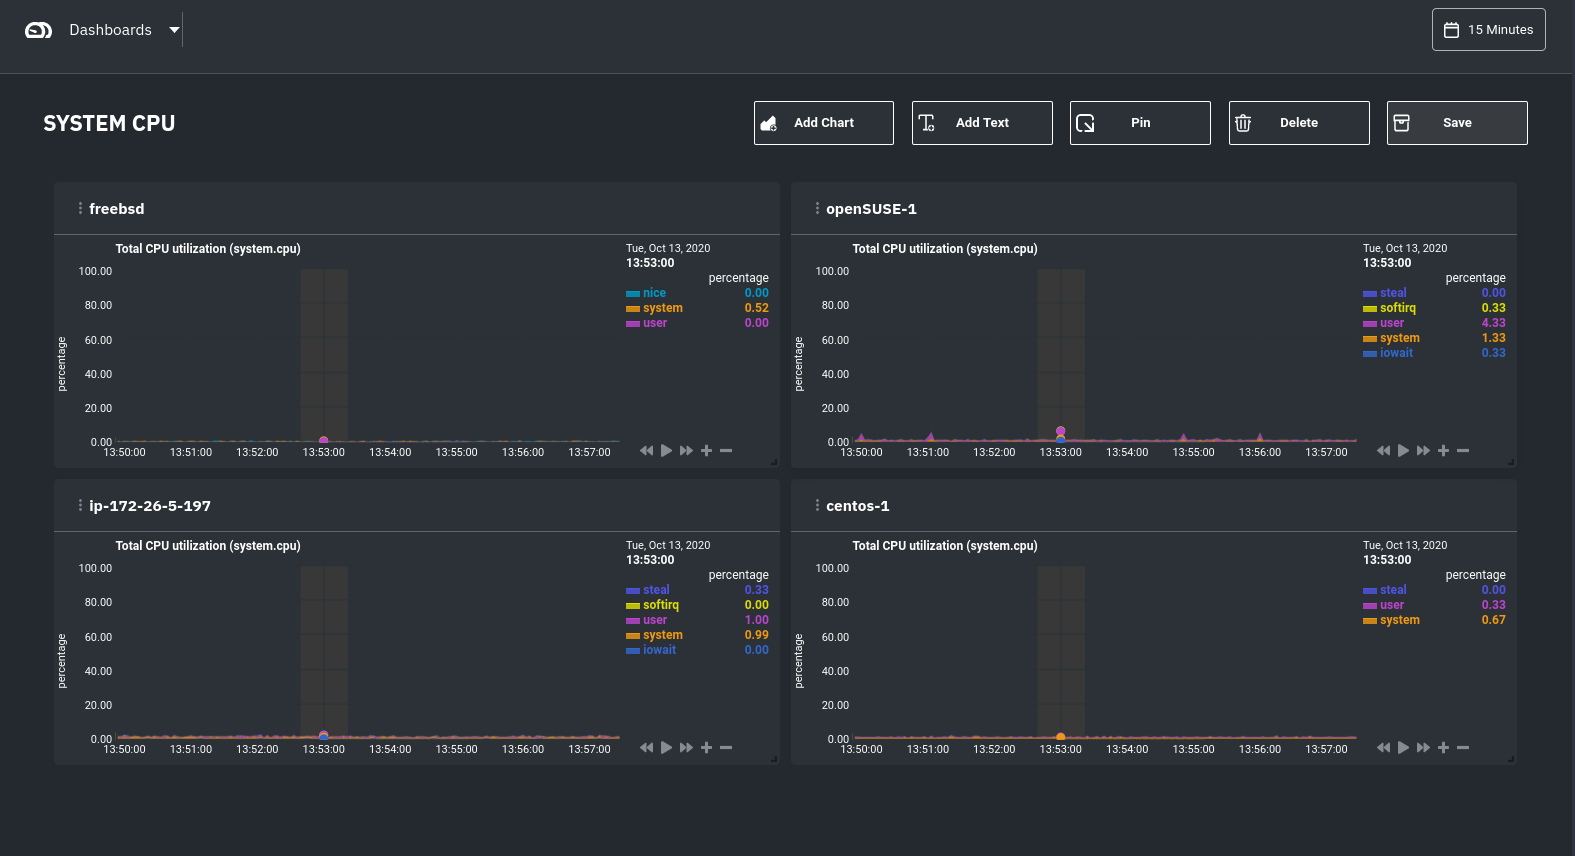 -) Read more about [creating new dashboards](/docs/visualize/create-dashboards.md) for more details about the process and additional tips on best leveraging the feature to help you troubleshoot complex performance problems. -## Configure your nodes +## Set up your nodes + +You get the most value out of Netdata Cloud's infrastructure monitoring capabilities if each node collects every +possible metric. For example, if a node in your infrastructure is responsible for serving a MySQL database, you should +ensure that the Netdata Agent on that node is properly collecting and streaming all MySQL-related metrics. + +In most cases, collectors autodetect their data source and require no configuration, but you may need to configure +certain behaviors based on your infrastructure. Or, you may want to enable/configure advanced functionality, such as +longer metrics retention or streaming. + +### Configure the Netdata Agent on your nodes You can configure any node in your infrastructure if you need to, although most users will find the default settings work extremely well for monitoring their infrastructures. @@ -95,21 +137,15 @@ After you've learned the basics, you should [secure your infrastructure's nodes] one of our recommended methods. These security best practices ensure no untrusted parties gain access to the metrics collected on any of your nodes. -## Collect metrics from your systems and applications +### Collect metrics from systems and applications Netdata has [300+ pre-installed collectors](/collectors/COLLECTORS.md) that gather thousands of metrics with zero configuration. Collectors search each of your nodes in default locations and ports to find running applications and gather as many metrics as they can without you having to configure them individually. -In fact, Netdata is already collecting thousands of metrics per second from your webservers, databases, containers, and -much more, on each node in your infrastructure. - -These metrics enrich your Netdata Cloud experience. You can see metrics from systems, containers, and applications in -the individual node dashboards, and you can create new dashboards around very specific charts, such as the real-time -volume of 503 responses from each of your webserver nodes. - Most collectors work without configuration, but you should read up on [how collectors -work](/docs/collect/how-collectors-work.md) and [how to enable/configure](/docs/collect/enable-configure.md) them. +work](/docs/collect/how-collectors-work.md) and [how to enable/configure](/docs/collect/enable-configure.md) them so +that you can see metrics from those applications in Netdata Cloud. In addition, find detailed information about which [system](/docs/collect/system-metrics.md), [container](/docs/collect/container-metrics.md), and [application](/docs/collect/application-metrics.md) metrics you can @@ -121,11 +157,9 @@ Netdata has many features that help you monitor the health of your nodes and tro Once you have a handle on configuration and are collecting all the right metrics, try out some of Netdata's other infrastructure-focused features: -- [Organize your nodes](/docs/configure/spaces-war-rooms.md) into **War Rooms** based on your preferred strategy. -- [See an overview of your infrastructure](/docs/visualize/overview-infrastructure.md) using Netdata Cloud's various - preconfigured dashboards. -- [Invite your team](/docs/configure/invite-collaborate.md) to collaborate on identifying anomalies or troubleshooting - complex performance problems. +- [See an overview of your infrastructure](/docs/visualize/overview-infrastructure.md) using Netdata Cloud's composite + charts and real-time visualizations. +- [Create new dashboards](/docs/visualize/create-dashboards.md) from any number of nodes and metrics in Netdata Cloud. To change how the Netdata Agent runs on each node, dig in to configuration files: @@ -138,4 +172,13 @@ To change how the Netdata Agent runs on each node, dig in to configuration files - [Export metrics](/docs/export/external-databases.md) to an external time-series database to use Netdata alongside other monitoring and troubleshooting tools. +### Related reference documentation + +- [Netdata Cloud · Spaces](https://learn.netdata.cloud/docs/cloud/spaces) +- [Netdata Cloud · War Rooms](https://learn.netdata.cloud/docs/cloud/war-rooms) +- [Netdata Cloud · Invite your team](https://learn.netdata.cloud/docs/cloud/manage/invite-your-team) +- [Netdata Cloud · Sign in or sign up with email, Google, or + GitHub](https://learn.netdata.cloud/docs/cloud/manage/sign-in) +- [Netdata Cloud · Nodes view](https://learn.netdata.cloud/docs/cloud/visualize/nodes) + [](<>) diff --git a/docs/visualize/interact-dashboards-charts.md b/docs/visualize/interact-dashboards-charts.md index 7deae1ff14..d9a3ef6b8b 100644 --- a/docs/visualize/interact-dashboards-charts.md +++ b/docs/visualize/interact-dashboards-charts.md @@ -81,7 +81,7 @@ height](https://user-images.githubusercontent.com/1153921/93497272-1acb5380-f8c5 Netdata Cloud now supports composite charts in the Overview interface. Composite charts come with a few additional UI elements and varied interactions, such as the location of dimensions and a utility bar for configuring the state of -individual composite charts. All of these de4tails are covered in the [Overview +individual composite charts. All of these details are covered in the [Overview reference](https://learn.netdata.cloud/docs/cloud/visualize/overview) doc. ## What's next? diff --git a/docs/visualize/overview-infrastructure.md b/docs/visualize/overview-infrastructure.md index b677b584e8..63a0bad7fb 100644 --- a/docs/visualize/overview-infrastructure.md +++ b/docs/visualize/overview-infrastructure.md @@ -53,53 +53,40 @@ See the [War Rooms](https://learn.netdata.cloud/docs/cloud/war-rooms) docs for m ### Configure composite charts to identify problems -Let's say you notice an interesting spike in disk I/O between `14:42:56` and `14:47:08`. Highlight the anomalous area -using `ALT/⌘ + mouse selection`, then zoom in with `SHIFT + mouse selection` to synchronize all composite charts around -this potentially problematic area. +Let's say you notice a sharp decrease in available RAM for applications, as seen in the example screenshot below. In +this situation, you can see when the anomalous behavior began and that it affects the average available and committed +RAM across your infrastructure. However, when _grouped by dimension_, composite charts cannot show whether an anomaly +affects a single node, a subset of nodes, or an entire infrastructure. -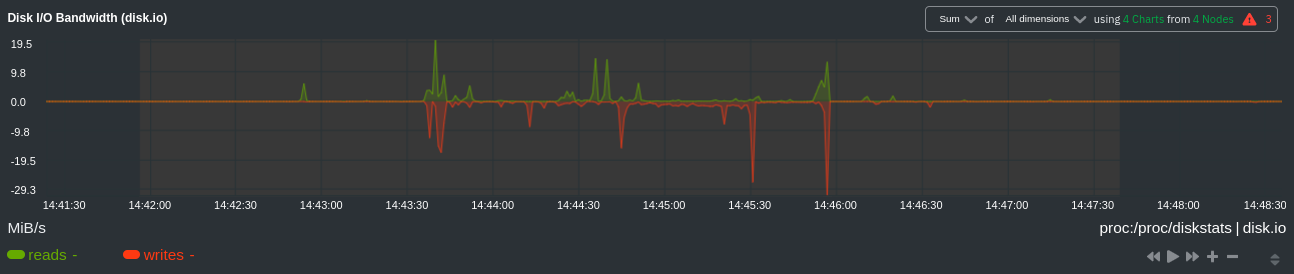 + -By default, the **Disk I/O Bandwidth (disk.io)** composite chart displays the **sum** of all dimensions (`reads` and -`writes`) from all nodes in that War Room. This smart default helps you identify anomalous behavior, but doesn't -necessarily provide the full picture. Let's say you want to understand the severity of disk writes. Use the definition -bar to change the aggregate function to **min** (because the `writes` dimension is on the negative axis), and display -only the `writes` dimension. +Use [_group by node_](https://learn.netdata.cloud/docs/cloud/visualize/overview#group-by-dimension-or-node) to visualize +a single metric across all contributing nodes. If the composite chart has 5 contributing nodes, there will be 5 +lines/areas, one for the most relevant dimension from each node. -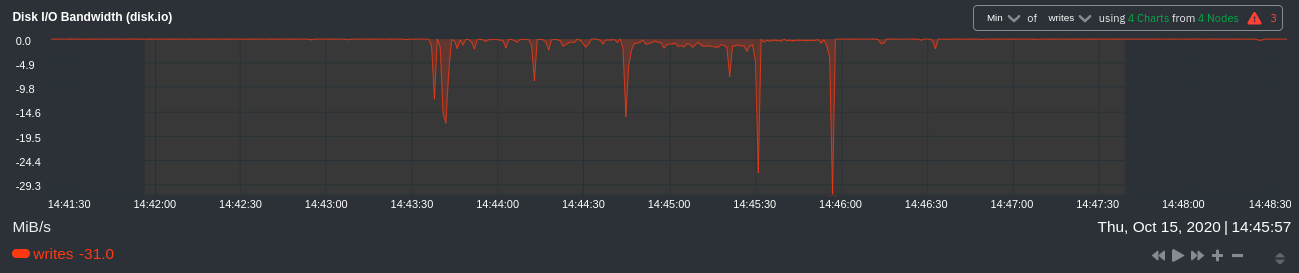 + -Because you're now looking at the largest magnitude of change on your infrastructure, you know a single node experienced -31 MiB/s in disk writes. By first using the Overview to gather baseline data, identify anomalies, and use aggregate -functions to your advantage, you've proactively recognized single-node issues using an infrastructure-wide interface. +After grouping by node, it's clear that the `Composite-Charts-01` node is experiencing anomalous behavior and should be +investigated further by jumping to its [single-node dashboard](#drill-down-with-single-node-dashboards) in Netdata +Cloud. -### Drill down to single-node dashboards - -Overview helps you take the investigation further with quick access to single-node dashboards in Netdata Cloud. +### Drill down with single-node dashboards Click on **X Charts** of any composite chart's definition bar to display a dropdown of contributing contexts and nodes contributing. Click on the link icon <img class="img__inline img__inline--link" src="https://user-images.githubusercontent.com/1153921/95762109-1d219300-0c62-11eb-8daa-9ba509a8e71c.png" /> next to a given node to quickly _jump to the same chart in that node's single-node dashboard_ in Netdata Cloud. -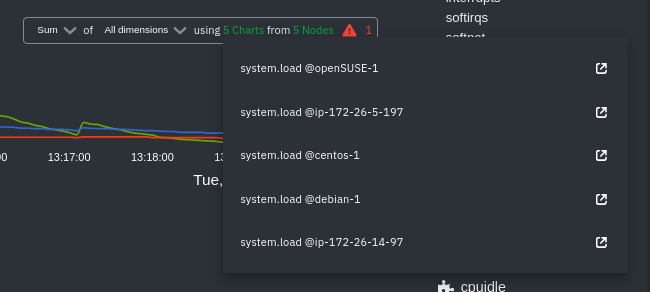) + You can use single-node dashboards in Netdata Cloud to drill down on specific issues, scrub backward in time to investigate historical data, and see like metrics presented meaningfully to help you troubleshoot performance problems. All of the familiar [interactions](/docs/visualize/interact-dashboards-charts.md) are available, as is adding any chart to a [new dashboard](/docs/visualize/create-dashboards.md). -Using the above example, one of the single-node dashboards reveals similar spike in disk I/O. Interestingly enough, it -also shows a maximum disk write of 31 MiB/s at the exact same moment as the composite chart in Overview. - -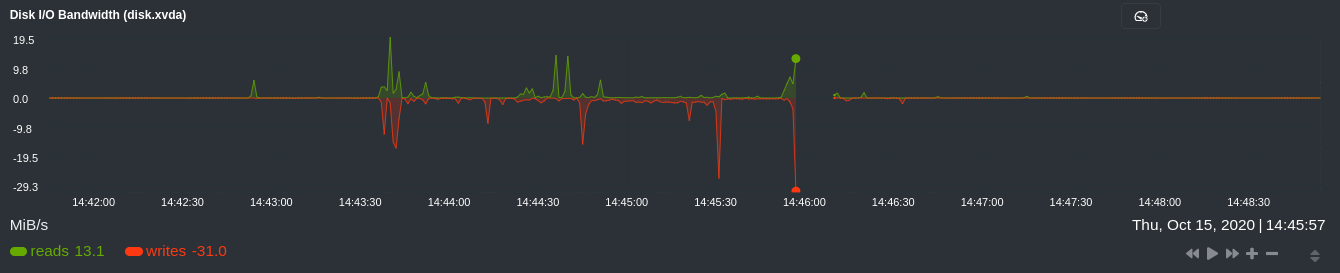 - -You now know that this particular node, during this particular time, experienced anomalous behavior. In this case, the -root cause of the disk I/O spike was due to updating the Netdata Agent itself, which is also the cause of the subsequent -gap in metrics history. - ## Nodes view You can also use the **Nodes view** to monitor the health status and user-configurable key metrics from multiple nodes |