
diff options
| author | Joel Hans <joel@netdata.cloud> | 2021-03-03 11:14:14 -0700 |
|---|---|---|
| committer | GitHub <noreply@github.com> | 2021-03-03 11:14:14 -0700 |
| commit | 1d003fa0d5111066e1459997c18bb115a036eb94 (patch) | |
| tree | 5ba84d07418857d0763c360b1fed9020890533db /docs | |
| parent | 71e711430cd793daa0599c5f911018889778798b (diff) | |
Change all refs from service to systemctl (#10703)
Diffstat (limited to 'docs')
| -rw-r--r-- | docs/Running-behind-apache.md | 3 | ||||
| -rw-r--r-- | docs/collect/enable-configure.md | 6 | ||||
| -rw-r--r-- | docs/collect/system-metrics.md | 5 | ||||
| -rw-r--r-- | docs/export/enable-connector.md | 14 | ||||
| -rw-r--r-- | docs/getting-started.md | 14 | ||||
| -rw-r--r-- | docs/guides/collect-apache-nginx-web-logs.md | 9 | ||||
| -rw-r--r-- | docs/guides/collect-unbound-metrics.md | 8 | ||||
| -rw-r--r-- | docs/guides/export/export-netdata-metrics-graphite.md | 4 | ||||
| -rw-r--r-- | docs/guides/monitor-cockroachdb.md | 6 | ||||
| -rw-r--r-- | docs/guides/monitor-hadoop-cluster.md | 4 | ||||
| -rw-r--r-- | docs/guides/monitor/anomaly-detection.md | 7 | ||||
| -rw-r--r-- | docs/guides/monitor/pi-hole-raspberry-pi.md | 8 | ||||
| -rw-r--r-- | docs/guides/monitor/process.md | 10 | ||||
| -rw-r--r-- | docs/guides/step-by-step/step-04.md | 4 | ||||
| -rw-r--r-- | docs/guides/step-by-step/step-05.md | 4 | ||||
| -rw-r--r-- | docs/guides/step-by-step/step-06.md | 10 | ||||
| -rw-r--r-- | docs/guides/step-by-step/step-09.md | 10 | ||||
| -rw-r--r-- | docs/guides/troubleshoot/monitor-debug-applications-ebpf.md | 8 | ||||
| -rw-r--r-- | docs/store/change-metrics-storage.md | 3 |
19 files changed, 74 insertions, 63 deletions
diff --git a/docs/Running-behind-apache.md b/docs/Running-behind-apache.md index 8810dc8fc5..d1dc0e0881 100644 --- a/docs/Running-behind-apache.md +++ b/docs/Running-behind-apache.md @@ -255,10 +255,9 @@ errors while accessing the dashboard. DOSPageCount 30 ``` -Restart Apache with `sudo service apache2 restart`, or the appropriate method to restart services on your system, to +Restart Apache with `sudo systemctl restart apache2`, or the appropriate method to restart services on your system, to reload its configuration with your new values. - ### Virtual host To adjust the `DOSPageCount` for a specific virtual host, open your virtual host config, which can be found at diff --git a/docs/collect/enable-configure.md b/docs/collect/enable-configure.md index 33d7a7bb4f..584d237157 100644 --- a/docs/collect/enable-configure.md +++ b/docs/collect/enable-configure.md @@ -32,7 +32,8 @@ Within this file, you can either disable the orchestrator entirely (`enabled: ye enable/disable it with `yes` and `no` settings. Uncomment any line you change to ensure the Netdata daemon reads it on start. -After you make your changes, restart the Agent with `service netdata restart`. +After you make your changes, restart the Agent with `sudo systemctl restart netdata`, or the [appropriate +method](/docs/configure/start-stop-restart.md) for your system. ## Configure a collector @@ -51,7 +52,8 @@ according to your needs. In addition, every collector's documentation shows the configure that collector. Uncomment any line you change to ensure the collector's orchestrator or the Netdata daemon read it on start. -After you make your changes, restart the Agent with `service netdata restart`. +After you make your changes, restart the Agent with `sudo systemctl restart netdata`, or the [appropriate +method](/docs/configure/start-stop-restart.md) for your system. ## What's next? diff --git a/docs/collect/system-metrics.md b/docs/collect/system-metrics.md index 72aa5714be..599d6f5832 100644 --- a/docs/collect/system-metrics.md +++ b/docs/collect/system-metrics.md @@ -48,8 +48,9 @@ windows_exporter-0.14.0-amd64.exe --collectors.enabled="cpu,memory,net,logical_d Next, [configure the WMI collector](https://learn.netdata.cloud/docs/agent/collectors/go.d.plugin/modules/wmi#configuration) to point to the URL -and port of your exposed endpoint. Restart Netdata with `service netdata restart` and you'll start seeing Windows system -metrics, such as CPU utilization, memory, bandwidth per NIC, number of processes, and much more. +and port of your exposed endpoint. Restart Netdata with `sudo systemctl restart netdata`, or the [appropriate +method](/docs/configure/start-stop-restart.md) for your system. You'll start seeing Windows system metrics, such as CPU +utilization, memory, bandwidth per NIC, number of processes, and much more. For information about collecting metrics from applications _running on Windows systems_, see the [application metrics doc](/docs/collect/application-metrics.md#collect-metrics-from-applications-running-on-windows). diff --git a/docs/export/enable-connector.md b/docs/export/enable-connector.md index 9789de2d8a..1ddecfd2cd 100644 --- a/docs/export/enable-connector.md +++ b/docs/export/enable-connector.md @@ -47,9 +47,10 @@ Use the following configuration as a starting point. Copy and paste it into `exp Replace `my_opentsdb_http_instance` with an instance name of your choice, and change the `destination` setting to the IP address or hostname of your OpenTSDB database. -Restart your Agent with `sudo systemctl restart netdata` to begin exporting to your OpenTSDB database. The Netdata Agent -exports metrics _beginning from the time the process starts_, and because it exports as metrics are collected, you -should start seeing data in your external database after only a few seconds. +Restart your Agent with `sudo systemctl restart netdata`, or the [appropriate +method](/docs/configure/start-stop-restart.md) for your system, to begin exporting to your OpenTSDB database. The +Netdata Agent exports metrics _beginning from the time the process starts_, and because it exports as metrics are +collected, you should start seeing data in your external database after only a few seconds. Any further configuration is optional, based on your needs and the configuration of your OpenTSDB database. See the [OpenTSDB connector doc](/exporting/opentsdb/README.md) and [exporting engine @@ -68,9 +69,10 @@ Use the following configuration as a starting point. Copy and paste it into `exp Replace `my_graphite_instance` with an instance name of your choice, and change the `destination` setting to the IP address or hostname of your Graphite-supported database. -Restart your Agent with `sudo systemctl restart netdata` to begin exporting to your Graphite-supported database. Because -the Agent exports metrics as they're collected, you should start seeing data in your external database after only a few -seconds. +Restart your Agent with `sudo systemctl restart netdata`, or the [appropriate +method](/docs/configure/start-stop-restart.md) for your system, to begin exporting to your Graphite-supported database. +Because the Agent exports metrics as they're collected, you should start seeing data in your external database after +only a few seconds. Any further configuration is optional, based on your needs and the configuration of your Graphite-supported database. See [exporting engine reference](/exporting/README.md#configuration) for details. diff --git a/docs/getting-started.md b/docs/getting-started.md index 1ccab4247b..e80b80eeda 100644 --- a/docs/getting-started.md +++ b/docs/getting-started.md @@ -211,16 +211,12 @@ You can use these features together or separately—the decision is up to yo When you install Netdata, it's configured to start at boot, and stop and restart/shutdown. You shouldn't need to start or stop Netdata manually, but you will probably need to restart Netdata at some point. -- To **start** Netdata, open a terminal and run `service netdata start`. -- To **stop** Netdata, run `service netdata stop`. -- To **restart** Netdata, run `service netdata restart`. +- To **start** Netdata, open a terminal and run `sudo systemctl start netdata`. +- To **stop** Netdata, run `sudo systemctl stop netdata`. +- To **restart** Netdata, run `sudo systemctl restart netdata`. -The `service` command is a wrapper script that tries to use your system's preferred method of starting or stopping -Netdata based on your system. But, if either of those commands fails, try using the equivalent commands for `systemd` -and `init.d`: - -- **systemd**: `systemctl start netdata`, `systemctl stop netdata`, `systemctl restart netdata` -- **init.d**: `/etc/init.d/netdata start`, `/etc/init.d/netdata stop`, `/etc/init.d/netdata restart` +See our doc on [starting, stopping, and restarting](/docs/configure/start-stop-restart.md) the Netdata Agent for +details. ## What's next? diff --git a/docs/guides/collect-apache-nginx-web-logs.md b/docs/guides/collect-apache-nginx-web-logs.md index 215ced3efb..1ffa9d3b6b 100644 --- a/docs/guides/collect-apache-nginx-web-logs.md +++ b/docs/guides/collect-apache-nginx-web-logs.md @@ -52,8 +52,8 @@ Find the `web_log` line, uncomment it, and set it to `web_log: no`. Next, open t Find the `web_log` line again, uncomment it, and set it to `web_log: yes`. -Finally, restart Netdata with `service netdata restart`, or the appropriate method for your system. You should see -metrics in your Netdata dashboard! +Finally, restart Netdata with `sudo systemctl restart netdata`, or the [appropriate +method](/docs/configure/start-stop-restart.md) for your system. You should see metrics in your Netdata dashboard! 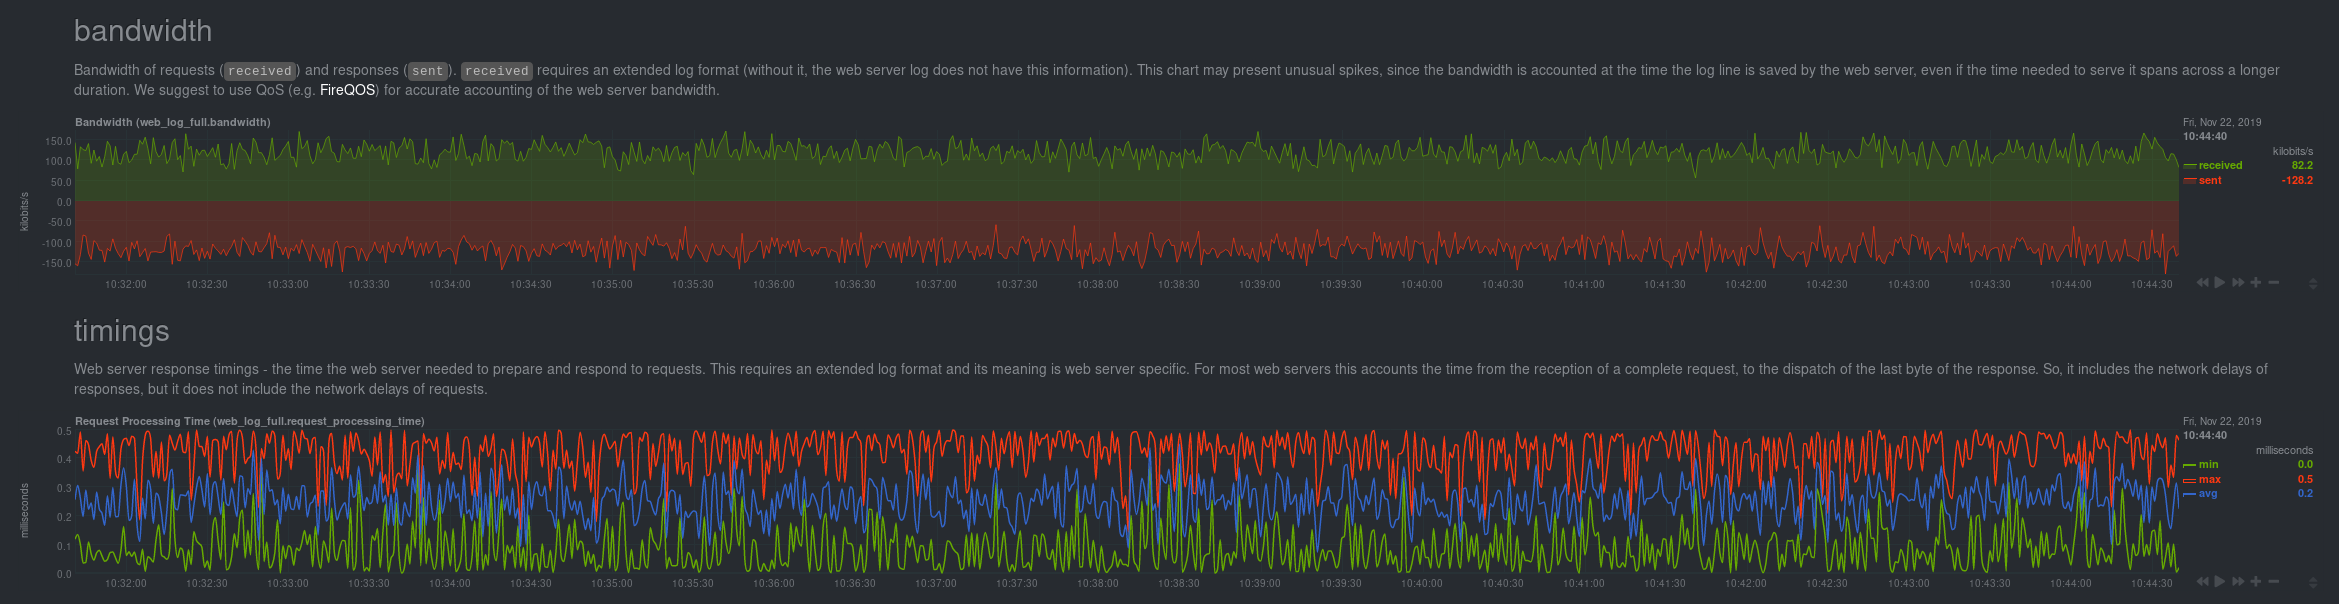 @@ -120,8 +120,9 @@ jobs: log_type: auto ``` -Restart Netdata with `service netdata restart` or the appropriate method for your system. Netdata should pick up your -web server's access log and begin showing real-time charts! +Restart Netdata with `sudo systemctl restart netdata`, or the [appropriate +method](/docs/configure/start-stop-restart.md) for your system. Netdata should pick up your web server's access log and +begin showing real-time charts! ### Custom log formats and fields diff --git a/docs/guides/collect-unbound-metrics.md b/docs/guides/collect-unbound-metrics.md index 2994647452..a6a4de02f0 100644 --- a/docs/guides/collect-unbound-metrics.md +++ b/docs/guides/collect-unbound-metrics.md @@ -54,8 +54,9 @@ configuring the collector. You may not need to do any more configuration to have Netdata collect your Unbound metrics. If you followed the steps above to enable `remote-control` and make your Unbound files readable by Netdata, that should -be enough. Restart Netdata with `service netdata restart`, or the appropriate method for your system. You should see -Unbound metrics in your Netdata dashboard! +be enough. Restart Netdata with `sudo systemctl restart netdata`, or the [appropriate +method](/docs/configure/start-stop-restart.md) for your system. You should see Unbound metrics in your Netdata +dashboard!  @@ -98,7 +99,8 @@ jobs: Netdata will attempt to read `unbound.conf` to get the appropriate `address`, `cumulative`, `use_tls`, `tls_cert`, and `tls_key` parameters. -Restart Netdata with `service netdata restart`, or the appropriate method for your system. +Restart Netdata with `sudo systemctl restart netdata`, or the [appropriate +method](/docs/configure/start-stop-restart.md) for your system. ### Manual setup for a remote Unbound server diff --git a/docs/guides/export/export-netdata-metrics-graphite.md b/docs/guides/export/export-netdata-metrics-graphite.md index 9a4a4f5ca6..ad18980b5e 100644 --- a/docs/guides/export/export-netdata-metrics-graphite.md +++ b/docs/guides/export/export-netdata-metrics-graphite.md @@ -115,8 +115,8 @@ the port accordingly. ... ``` -We'll not worry about the rest of the settings for now. Restart the Agent using `sudo service netdata restart`, or the -appropriate method for your system, to spin up the exporting engine. +We'll not worry about the rest of the settings for now. Restart the Agent using `sudo systemctl restart netdata`, or the +[appropriate method](/docs/configure/start-stop-restart.md) for your system, to spin up the exporting engine. ## See and organize Netdata metrics in Graphite diff --git a/docs/guides/monitor-cockroachdb.md b/docs/guides/monitor-cockroachdb.md index fd0e7db643..0ff9f3c772 100644 --- a/docs/guides/monitor-cockroachdb.md +++ b/docs/guides/monitor-cockroachdb.md @@ -30,9 +30,9 @@ configuring CockroachDB. Netdata only needs to regularly query the database's `_ display them on the dashboard. If your CockroachDB instance is accessible through `http://localhost:8080/` or `http://127.0.0.1:8080`, your setup is -complete. Restart Netdata with `service netdata restart`, or use the [appropriate -method](../getting-started.md#start-stop-and-restart-netdata) for your system, and refresh your browser. You should see -CockroachDB metrics in your Netdata dashboard! +complete. Restart Netdata with `sudo systemctl restart netdata`, or the [appropriate +method](/docs/configure/start-stop-restart.md) for your system, and refresh your browser. You should see CockroachDB +metrics in your Netdata dashboard! <figure> <img src="https://user-images.githubusercontent.com/1153921/73564467-d7e36b00-441c-11ea-9ec9-b5d5ea7277d4.png" alt="CPU utilization charts from a CockroachDB database monitored by Netdata" /> diff --git a/docs/guides/monitor-hadoop-cluster.md b/docs/guides/monitor-hadoop-cluster.md index 1ca2c03e11..dce56b7c76 100644 --- a/docs/guides/monitor-hadoop-cluster.md +++ b/docs/guides/monitor-hadoop-cluster.md @@ -161,10 +161,10 @@ jobs: address : 203.0.113.10:2182 ``` -Finally, restart Netdata. +Finally, [restart Netdata](/docs/configure/start-stop-restart.md). ```sh -sudo service restart netdata +sudo systemctl restart netdata ``` Upon restart, Netdata should recognize your HDFS/Zookeeper servers, enable the HDFS and Zookeeper modules, and begin diff --git a/docs/guides/monitor/anomaly-detection.md b/docs/guides/monitor/anomaly-detection.md index bb9dbc8293..ef66e261c6 100644 --- a/docs/guides/monitor/anomaly-detection.md +++ b/docs/guides/monitor/anomaly-detection.md @@ -79,9 +79,10 @@ yourself if it doesn't already exist. Either way, the final result should look l anomalies: yes ``` -[Restart the Agent](/docs/configure/start-stop-restart.md) with `sudo systemctl restart netdata` to start up the -anomalies collector. By default, the model training process runs every 30 minutes, and uses the previous 4 hours of -metrics to establish a baseline for health and performance across the default included charts. +[Restart the Agent](/docs/configure/start-stop-restart.md) with `sudo systemctl restart netdata`, or the [appropriate +method](/docs/configure/start-stop-restart.md) for your system, to start up the anomalies collector. By default, the +model training process runs every 30 minutes, and uses the previous 4 hours of metrics to establish a baseline for +health and performance across the default included charts. > 💡 The anomaly collector may need 30-60 seconds to finish its initial training and have enough data to start > generating anomaly scores. You may need to refresh your browser tab for the **Anomalies** section to appear in menus diff --git a/docs/guides/monitor/pi-hole-raspberry-pi.md b/docs/guides/monitor/pi-hole-raspberry-pi.md index a180466fb0..dc5e0b314e 100644 --- a/docs/guides/monitor/pi-hole-raspberry-pi.md +++ b/docs/guides/monitor/pi-hole-raspberry-pi.md @@ -83,9 +83,9 @@ As far as configuring Netdata to monitor Pi-hole metrics, there's nothing you ac collector](https://learn.netdata.cloud/docs/agent/collectors/go.d.plugin/modules/pihole) will autodetect the new service running on your Raspberry Pi and immediately start collecting metrics every second. -Restart Netdata with `sudo service netdata restart` to start Netdata, which will then recognize that Pi-hole is running -and start a per-second collection job. When you refresh your Netdata dashboard or load it up again in a new tab, you'll -see a new entry in the menu for **Pi-hole** metrics. +Restart Netdata with `sudo systemctl restart netdata`, which will then recognize that Pi-hole is running and start a +per-second collection job. When you refresh your Netdata dashboard or load it up again in a new tab, you'll see a new +entry in the menu for **Pi-hole** metrics. ## Use Netdata to explore and monitor your Raspberry Pi and Pi-hole @@ -119,7 +119,7 @@ cd /etc/netdata sudo ./edit-config charts.d.conf ``` -Uncomment the `sensors=force` line and save the file. Restart Netdata with `sudo service netdata restart` to enable +Uncomment the `sensors=force` line and save the file. Restart Netdata with `sudo systemctl restart netdata` to enable Raspberry Pi temperature sensor monitoring. ### Storing historical metrics on your Raspberry Pi diff --git a/docs/guides/monitor/process.md b/docs/guides/monitor/process.md index 893e6b7049..0f7c6861aa 100644 --- a/docs/guides/monitor/process.md +++ b/docs/guides/monitor/process.md @@ -169,8 +169,9 @@ postgres: postgres* sql: mariad* postmaster* oracle_* ora_* sqlservr ``` -Restart Netdata with `service netdata restart`, or the appropriate method for your system, to start collecting -utilization metrics from your application. Time to [visualize your process metrics](#visualize-process-metrics). +Restart Netdata with `sudo systemctl restart netdata`, or the [appropriate +method](/docs/configure/start-stop-restart.md) for your system, to start collecting utilization metrics from your +application. Time to [visualize your process metrics](#visualize-process-metrics). ### Custom applications @@ -194,8 +195,9 @@ custom-app: custom-app ... ``` -Restart Netdata with `service netdata restart`, or the appropriate method for your system, to start collecting -utilization metrics from your application. +Restart Netdata with `sudo systemctl restart netdata`, or the [appropriate +method](/docs/configure/start-stop-restart.md) for your system, to start collecting utilization metrics from your +application. ## Visualize process metrics diff --git a/docs/guides/step-by-step/step-04.md b/docs/guides/step-by-step/step-04.md index 0495145f48..41431b1d03 100644 --- a/docs/guides/step-by-step/step-04.md +++ b/docs/guides/step-by-step/step-04.md @@ -95,8 +95,8 @@ section and give it the value of `1`. test = 1 ``` -Restart Netdata with `service restart netdata` or the [appropriate -alternative](/docs/getting-started.md#start-stop-and-restart-netdata) for your system. +Restart Netdata with `sudo systemctl restart netdata`, or the [appropriate +method](/docs/configure/start-stop-restart.md) for your system. Now, open up your browser and navigate to `http://HOST:19999/netdata.conf`. You'll see that Netdata has recognized that our fake option isn't valid and added a notice that Netdata will ignore it. diff --git a/docs/guides/step-by-step/step-05.md b/docs/guides/step-by-step/step-05.md index 5e627632d0..30ab329cd8 100644 --- a/docs/guides/step-by-step/step-05.md +++ b/docs/guides/step-by-step/step-05.md @@ -69,8 +69,8 @@ the `warn` and `crit` lines to the values of your choosing. For example: crit: $this > (($status == $CRITICAL) ? (75) : (85)) ``` -You _can_ [restart Netdata](/docs/getting-started.md#start-stop-and-restart-netdata) to enable your tune, but you can -also reload _only_ the health monitoring component using one of the available [methods](/health/QUICKSTART.md#reload-health-configuration). +You _can_ restart Netdata with `sudo systemctl restart netdata`, to enable your tune, but you can also reload _only_ the +health monitoring component using one of the available [methods](/health/QUICKSTART.md#reload-health-configuration). You can also tune any other aspect of the default alarms. To better understand how each line in a health entity works, read our [health documentation](/health/README.md). diff --git a/docs/guides/step-by-step/step-06.md b/docs/guides/step-by-step/step-06.md index 160b1b1f62..618886076b 100644 --- a/docs/guides/step-by-step/step-06.md +++ b/docs/guides/step-by-step/step-06.md @@ -7,8 +7,8 @@ custom_edit_url: https://github.com/netdata/netdata/edit/master/docs/guides/step When Netdata _starts_, it auto-detects dozens of **data sources**, such as database servers, web servers, and more. -To auto-detect and collect metrics from a source you just installed, you need to [restart -Netdata](/docs/getting-started.md#start-stop-and-restart-netdata). +To auto-detect and collect metrics from a source you just installed, you need to restart Netdata using `sudo systemctl +restart netdata`, or the [appropriate method](/docs/configure/start-stop-restart.md) for your system. However, auto-detection only works if you installed the source using its standard installation procedure. If Netdata isn't collecting metrics after a restart, your source probably isn't configured @@ -99,9 +99,9 @@ Next, edit your `/etc/nginx/sites-enabled/default` file to include a `location` } ``` -Restart Netdata using `service netdata restart` or the [correct -alternative](/docs/getting-started.md#start-stop-and-restart-netdata) for your system, and Netdata will auto-detect -metrics from your Nginx web server! +Restart Netdata using `sudo systemctl restart netdata`, or the [appropriate +method](/docs/configure/start-stop-restart.md) for your system, and Netdata will auto-detect metrics from your Nginx web +server! While not necessary for most auto-detection and collection purposes, you can also configure the Nginx collector itself by editing its configuration file: diff --git a/docs/guides/step-by-step/step-09.md b/docs/guides/step-by-step/step-09.md index 636ffea1f8..c5b2ecd54e 100644 --- a/docs/guides/step-by-step/step-09.md +++ b/docs/guides/step-by-step/step-09.md @@ -62,7 +62,8 @@ metrics your Agent collects, and more. dbengine disk space = 512 ``` -After you've made your changes, [restart Netdata](/docs/getting-started.md#start-stop-and-restart-netdata). +After you've made your changes, restart Netdata using `sudo systemctl restart netdata`, or the [appropriate +method](/docs/configure/start-stop-restart.md) for your system. To confirm the database engine is working, go to your Netdata dashboard and click on the **Netdata Monitoring** menu on the right-hand side. You can find `dbengine` metrics after `queries`. @@ -142,9 +143,10 @@ Add the following section to the file: collection = netdata_metrics ``` -[Restart](/docs/getting-started.md#start-stop-and-restart-netdata) Netdata to enable the MongoDB exporting connector. -Click on the **Netdata Monitoring** menu and check out the **exporting my mongo instance** sub-menu. You should start -seeing these charts fill up with data about the exporting process! +Restart Netdata using `sudo systemctl restart netdata`, or the [appropriate +method](/docs/configure/start-stop-restart.md) for your system, to enable the MongoDB exporting connector. Click on the +**Netdata Monitoring** menu and check out the **exporting my mongo instance** sub-menu. You should start seeing these +charts fill up with data about the exporting process! 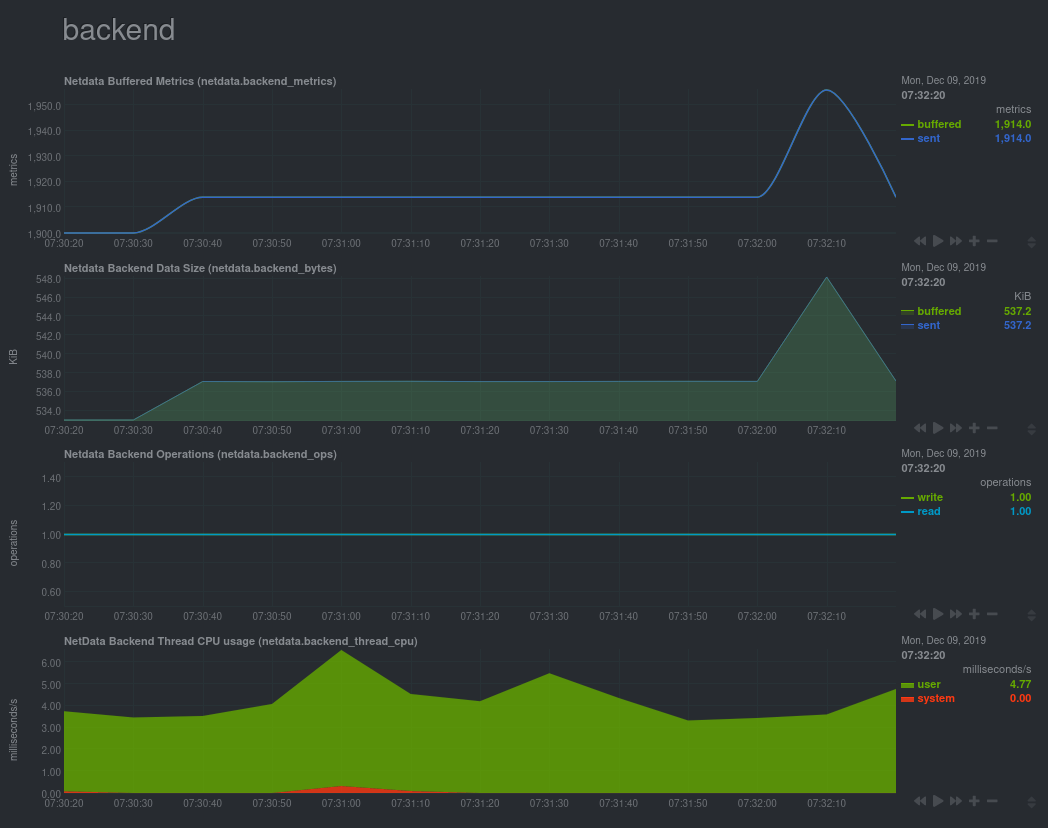 diff --git a/docs/guides/troubleshoot/monitor-debug-applications-ebpf.md b/docs/guides/troubleshoot/monitor-debug-applications-ebpf.md index 342193c583..13efa20e8a 100644 --- a/docs/guides/troubleshoot/monitor-debug-applications-ebpf.md +++ b/docs/guides/troubleshoot/monitor-debug-applications-ebpf.md @@ -57,8 +57,9 @@ dev: custom-app ... ``` -Restart Netdata with `sudo service netdata restart` or the appropriate method for your system to begin seeing metrics -for this particular group+process. You can also add additional processes to the same group. +Restart Netdata with `sudo systemctl restart netdata`, or the [appropriate +method](/docs/configure/start-stop-restart.md) for your system, to begin seeing metrics for this particular +group+process. You can also add additional processes to the same group. You can set up `apps_groups.conf` to more show more precise eBPF metrics for any application or service running on your system, even if it's a standard package like Redis, Apache, or any other [application/service Netdata collects @@ -105,7 +106,8 @@ Replace `entry` with `return`: network viewer = yes ``` -Restart Netdata with `sudo service netdata restart` or the appropriate method for your system. +Restart Netdata with `sudo systemctl restart netdata`, or the [appropriate +method](/docs/configure/start-stop-restart.md) for your system. ## Get familiar with per-application eBPF metrics and charts diff --git a/docs/store/change-metrics-storage.md b/docs/store/change-metrics-storage.md index 0e2db13692..6dde22c047 100644 --- a/docs/store/change-metrics-storage.md +++ b/docs/store/change-metrics-storage.md @@ -54,7 +54,8 @@ multihost disk space` setting. Change it to the value recommended above. For exa dbengine multihost disk space = 1024 ``` -Save the file and restart the Agent with `service netdata restart` to change the database engine's size. +Save the file and restart the Agent with `sudo systemctl restart netdata`, or the [appropriate +method](/docs/configure/start-stop-restart.md) for your system, to change the database engine's size. ## What's next? |