
diff options
| author | Joel Hans <joel@netdata.cloud> | 2020-05-14 06:50:01 -0700 |
|---|---|---|
| committer | GitHub <noreply@github.com> | 2020-05-14 06:50:01 -0700 |
| commit | 9d712b513566f1f90f6031f16c25953c5d836891 (patch) | |
| tree | 9aa1340a8b3529271941ce7cb809bbc65c42453a /docs | |
| parent | 4609d5b3dd1ad4d26daae52aaa5bda1948be288e (diff) | |
Docs: Remove old Cloud/dashboard and replace with new Cloud/dashboard (#8874)
* Add options to daemon, clean up claiming
* Caught one more old conf
* Remove cloud docs
* I did a lot of things
* Rewrite tutorial step 3
* Remove my nodes menu, sync what-is-netdata
* Restore ACLK/claim/daemon docs to be handled by docs-go-live
* Fix up what-is-netdata
* More cleanup of README/what-is-netdata
* Restore daemon/config/README.md
* Fix frontmatter
* Change title, fix broken link
* Copyediting fixes
* Remove symbols
* Add a few more GIFs
* Fix hash
* Fix other hash
* Fix wording in web gui
* Address Andrew's and Jacek's comments
Diffstat (limited to 'docs')
| -rw-r--r-- | docs/agent-cloud.md | 79 | ||||
| -rw-r--r-- | docs/getting-started.md | 62 | ||||
| -rw-r--r-- | docs/netdata-cloud/README.md | 55 | ||||
| -rw-r--r-- | docs/netdata-cloud/nodes-view.md | 215 | ||||
| -rw-r--r-- | docs/netdata-cloud/signing-in.md | 175 | ||||
| -rw-r--r-- | docs/step-by-step/step-02.md | 73 | ||||
| -rw-r--r-- | docs/step-by-step/step-03.md | 169 | ||||
| -rw-r--r-- | docs/step-by-step/step-04.md | 8 | ||||
| -rw-r--r-- | docs/step-by-step/step-07.md | 15 | ||||
| -rw-r--r-- | docs/what-is-netdata.md | 49 |
10 files changed, 216 insertions, 684 deletions
diff --git a/docs/agent-cloud.md b/docs/agent-cloud.md new file mode 100644 index 0000000000..2a03582c2b --- /dev/null +++ b/docs/agent-cloud.md @@ -0,0 +1,79 @@ +<!-- +--- +title: "Use the Agent with Netdata Cloud" +date: 2020-05-04 +custom_edit_url: https://github.com/netdata/netdata/edit/master/docs/agent-cloud.md +--- +--> + +# Use the Agent with Netdata Cloud + +While the Netdata Agent is an enormously powerful _distributed_ health monitoring and performance troubleshooting tool, +many of its users need to monitor dozens or hundreds of systems at the same time. That's why we built Netdata Cloud, a +hosted web interface that gives you real-time visibility into your entire infrastructure. + +There are two main ways to use your Agent(s) with Netdata Cloud. You can use both these methods simultaneously, or just +one, based on your needs: + +- Use Netdata Cloud's web interface for monitoring an entire infrastructure, with any number of Agents, in one + centralized dashboard. +- Use **Visited nodes** to quickly navigate between the dashboards of nodes you've recently visited. + +## Monitor an infrastructure with Netdata Cloud + +We designed Netdata Cloud to help you see health and performance metrics, plus active alarms, in a single interface. +Here's what a small infrastructure might look like: + + + +[Read more about Netdata Cloud](https://learn.netdata.cloud/docs/cloud/) to better understand how it gives you real-time +visibility into your entire infrastructure, and why you might consider using it. + +Next, [get started in 5 minutes](https://learn.netdata.cloud/docs/cloud/get-started/), or read our [claiming +reference](/claim/README.md) for a complete investigation of Cloud's security and encryption features, plus instructions +for Docker containers. + +## Navigate between dashboards with Visited nodes + +If you don't want to use Netdata Cloud's web interface, you can still connect multiple nodes through the **Visited +nodes** menu, which appears on the left-hand side of the dashboard. + +You can use the Visited nodes menu to navigate between the dashboards of many different Agent-monitored systems quickly. + +To add nodes to your Visited nodes menu, you first need to navigate to that node's dashboard, then click the **Sign in** +button at the top of the dashboard. On the screen that appears, which states your node is requesting access to your +Netdata Cloud account, sign in with your preferred method. + +Cloud redirects you back to your node's dashboard, which is now connected to your Netdata Cloud account. You can now see +the Visited nodes menu, which is populated by a single node. + +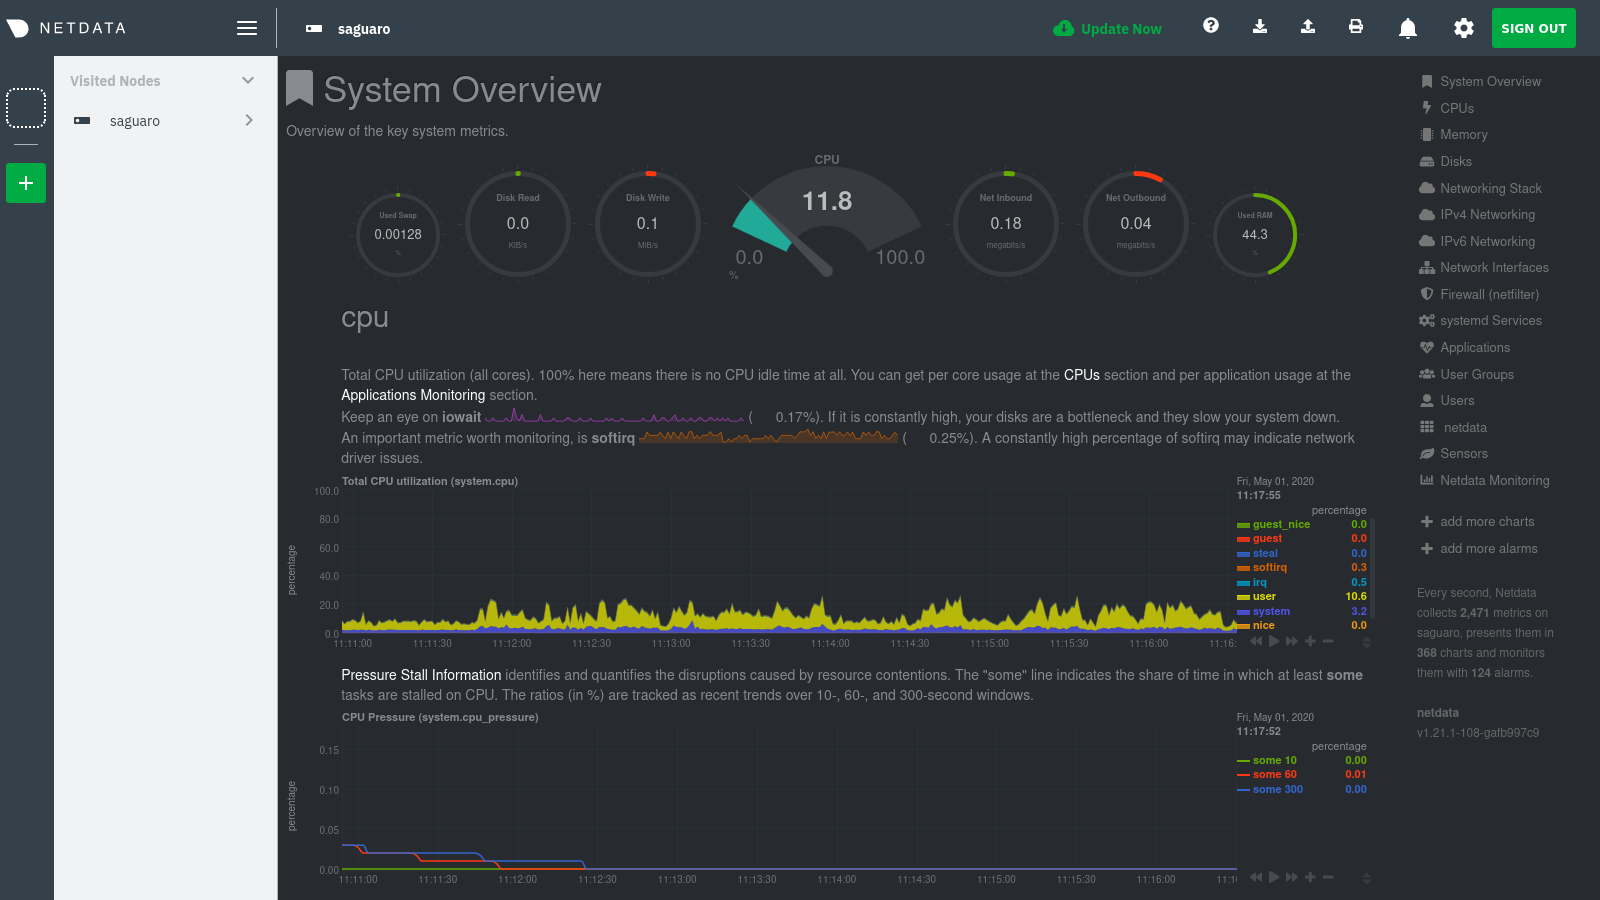 + +If you previously went through the Cloud onboarding process to create a Space and War Room, you will also see these in +the Visited Nodes menu. You can click on your Space or any of your War Rooms to navigate to Netdata Cloud and continue +monitoring your infrastructure from there. + +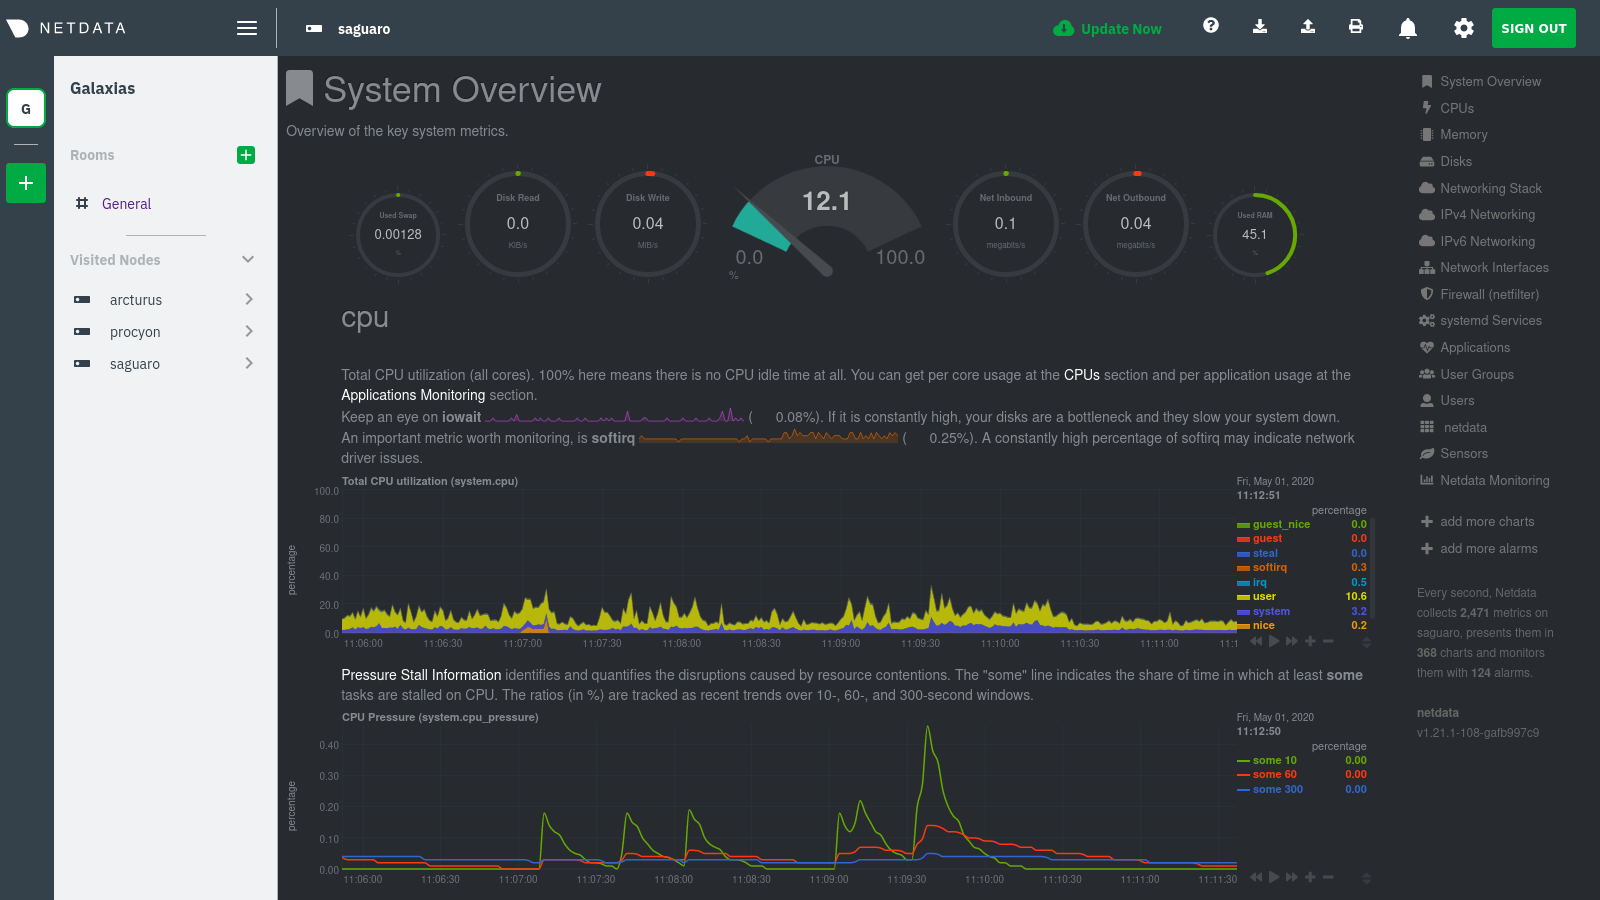 + +To add more Agents to your Visited nodes menu, visit them and sign in again. This process connects that node to your +Cloud account and further populates the menu. + +Once you've added more than one node, you can use the menu to switch between various dashboards without remembering IP +addresses or hostnames or saving bookmarks for every node you want to monitor. + + + +## What's next? + +The Agent-Cloud integration is highly adaptable to the needs of any infrastructure or user. If you want to learn more +about how you might want to use or configure Cloud, we recommend the following: + +- Get an overview of Cloud's features by reading [Cloud documentation](https://learn.netdata.cloud/docs/cloud/). +- Follow the 5-minute [get started with Cloud](https://learn.netdata.cloud/docs/cloud/get-started/) guide to finish + onboarding and claim your first nodes. +- Better understand how agents connect securely to the Cloud with [claiming](/claim/README.md) and [Agent-Cloud + link](/aclk/README.md) documentation.
\ No newline at end of file diff --git a/docs/getting-started.md b/docs/getting-started.md index ca0f27422c..6a3e9ca633 100644 --- a/docs/getting-started.md +++ b/docs/getting-started.md @@ -1,17 +1,17 @@ <!-- --- -title: "Getting started guide" -date: 2020-04-06 +title: "Get started guide" +date: 2020-05-04 custom_edit_url: https://github.com/netdata/netdata/edit/master/docs/getting-started.md --- --> -# Getting started guide +# Get started guide -Thanks for trying Netdata! In this getting started guide, we'll quickly walk you through the first steps you should take -after getting Netdata installed. +Thanks for trying the Netdata Agent! In this getting started guide, we'll quickly walk you through the first steps you +should take after installing the Agent. -Netdata can collect thousands of metrics in real-time and use its database for long-term metrics storage without any +The Agent can collect thousands of metrics in real-time and use its database for long-term metrics storage without any configuration, but there are some valuable things to know to get the most out of Netdata based on your needs. We'll skip right into some technical details, so if you're brand-new to monitoring the health and performance of systems @@ -22,14 +22,11 @@ and applications, our [**step-by-step tutorial**](/docs/step-by-step/step-00.md) ## Access the dashboard -Open up your web browser of choice and navigate to `http://YOUR-HOST:19999`. Welcome to Netdata! +Open up your web browser of choice and navigate to `http://NODE:19999`, replacing `NODE` with the IP address or hostname +of your Agent. Hit **Enter**. Welcome to Netdata!  - -<details markdown="1"><summary>Want to see the dashboard and its features in action? Check out our video.</summary> -<iframe width="720" height="405" src="https://www.youtube.com/embed/Ob6-Wkb6ZBA" frameborder="0" allow="accelerometer; autoplay; encrypted-media; gyroscope; picture-in-picture" allowfullscreen></iframe> -</details> +dashboard](https://user-images.githubusercontent.com/1153921/80825153-abaec600-8b94-11ea-8b17-1b770a2abaa9.gif) **What's next?**: @@ -97,9 +94,9 @@ Some modules, like `chrony`, are disabled by default and must be enabled manuall Once Netdata detects a valid source of data, it will continue trying to collect data from it. For example, if Netdata is collecting data from an Nginx web server, and you shut Nginx down, Netdata will collect new data as soon as -you start the web server back up—no restart necessary. +you start the web server back up—no restart necessary. -### Configuring plugins +### Configure plugins Even if Netdata auto-detects your service/application, you might want to configure what, or how often, Netdata is collecting data. @@ -192,29 +189,33 @@ Find the `SEND_EMAIL="YES"` line and change it to `SEND_EMAIL="NO"`. - See all the alarm options via the [health configuration reference](/health/REFERENCE.md). - Add a new notification method, like [Slack](/health/notifications/slack/). -## Monitoring multiple systems with Netdata +## Monitor multiple systems with Netdata Cloud + +If you have the Agent installed on multiple nodes, you can use Netdata Cloud in two ways: Monitor the health and +performance of an entire infrastructure via the Cloud web interface, or use the Visited Nodes menu that's built into +every dashboard. -If you have Netdata installed on multiple systems, you can have them all appear in the **My nodes** menu at the top-left -corner of the dashboard. +For example, a small infrastructure monitored via Netdata Cloud: -To show all your servers in that menu, you need to [register for or sign in](/docs/netdata-cloud/signing-in.md) to -[Netdata Cloud](/docs/netdata-cloud/README.md) from each system. Each system will then appear in the **My nodes** menu, which you -can use to navigate between your systems quickly. + - +And the process of using the Visited nodes menu to move between Agent dashboards running on various systems, both local +and remote: -Whenever you pan, zoom, highlight, select, or pause a chart, Netdata will synchronize those settings with any other -agent you visit via the My nodes menu. Even your scroll position is synchronized, so you'll see the same charts and -respective data for easy comparisons or root cause analysis. + -You can now seamlessly track performance anomalies across your entire infrastructure! +You can use these features together or separately—the decision is up to you and the needs of your infrastructure. **What's next?**: -- Read up on how the [Netdata Cloud registry works](/registry/), and what kind of data it stores and sends to - your web browser. -- Familiarize yourself with the [Nodes View](/docs/netdata-cloud/nodes-view.md) +- Read about the [Agent-Cloud integration](). +- Get an overview of Cloud's features by reading [Cloud documentation](https://learn.netdata.cloud/docs/cloud/). +- Follow the 5-minute [get started with Cloud](https://learn.netdata.cloud/docs/cloud/get-started/) guide to finish + onboarding and claim your first nodes. +- Better understand how agents connect securely to the Cloud with [claiming](/claim/README.md) and [Agent-Cloud + link](/aclk/README.md) documentation. ## Start, stop, and restart Netdata @@ -235,7 +236,8 @@ and `init.d`: ## What's next? Even after you've configured `netdata.conf`, tweaked alarms, learned the basics of performance troubleshooting, and -added all your systems to the **My nodes** menu, you've just gotten started with Netdata. +claimed all your systems in Netdata Cloud or added them to the Visited nodes menu, you've just gotten started with +Netdata. Take a look at some more advanced features and configurations: diff --git a/docs/netdata-cloud/README.md b/docs/netdata-cloud/README.md deleted file mode 100644 index 6e38c9997f..0000000000 --- a/docs/netdata-cloud/README.md +++ /dev/null @@ -1,55 +0,0 @@ -<!-- ---- -title: "Netdata Cloud" -custom_edit_url: https://github.com/netdata/netdata/edit/master/docs/netdata-cloud/README.md ---- ---> - -# Netdata Cloud - -Netdata Cloud is core to our ongoing mission to provide real-time, distributed health monitoring and performance troubleshooting. It's the foundation of an ecosystem of tools that will help you build more extraordinary infrastructures. - -Netdata Cloud is also the next iteration of our global Netdata registry. For technical information about how our registries work, what information they store, and how your web browser "talks" to both, visit our [registry documentation](/registry/README.md). - -Learn more about the future of Netdata Cloud on our [announcement post](https://blog.netdata.cloud/posts/netdata-cloud-announcement/). - -## Registering for or signing in to Netdata Cloud - -**If you're ready to register for a new Netdata Cloud account, or sign in to your existing Netdata Cloud account, visit our [signing in guide](/docs/netdata-cloud/signing-in.md) for details.** - -> If you're running a private registry and are interested in trying out Netdata Cloud as a replacement for your private -> registry, read [our notice](/docs/netdata-cloud/signing-in.md#private-registries-and-netdata-cloud) about -> transitioning from a private registry to our Netdata Cloud registry. - -## Netdata Cloud features - -Netdata Cloud currently enables two features: the **My nodes** in the top-left corner of the Netdata dashboard, and the -[**Nodes View**](/docs/netdata-cloud/nodes-view.md). - -We have an aggressive roadmap of new features, such as Workspaces for different parts of your infrastructure, Rooms to collaborate with colleagues, and the ability to receive alarms from any number of distributed Netdata agents in a single place. Read more about our proposed features [here](https://blog.netdata.cloud/posts/netdata-cloud-announcement/#what-features-will-netdata-cloud-offer). - -### Planned enterprise features (paid) - -Large enterprises have unique real-time monitoring needs. They have thousands of servers and applications running concurrently, and are willing to pay for the complex features that help them make smarter, faster decisions about their infrastructure. We expect to create a paid tier of Netdata Cloud with a recurring, per-user pricing model that will unlock enterprise-focused features. - -A few of these planned features include: - -- Long-term storage of Netdata UI snapshots -- Active Directory integration for single sign-on -- Private service status pages -- Extended retention of alarms timelines -- Incident response toolkits -- Additional enterprise plugins and integrations -- Extended retention of chat messages - -Again, we expect that the vast majority of Netdata's users won't need these features. Creating these two tiers will help us further fund the company's efforts to deploy Netdata's open-source agent on a massive scale and entirely for free. - -## Running Netdata without Netdata Cloud - -Netdata Cloud is entirely optional. The application will never force you to create a Netdata Cloud account or associate nodes with the public registries. But, if you choose not to use Netdata Cloud, you will be missing out on the [Nodes View](/docs/netdata-cloud/nodes-view.md) and other upcoming features. - -## Running Netdata Cloud on-premises or as a hosted instance - -We plan on making both on-premises and hosted instances of Netdata Cloud available to enterprises. Until then, we are creating a list of people and businesses interested in either of these options. To add yourself or your organization to this list, email us at [info@netdata.cloud](mailto:info@netdata.cloud). - -[](<>) diff --git a/docs/netdata-cloud/nodes-view.md b/docs/netdata-cloud/nodes-view.md deleted file mode 100644 index e6971a1d9e..0000000000 --- a/docs/netdata-cloud/nodes-view.md +++ /dev/null @@ -1,215 +0,0 @@ -<!-- ---- -title: "Using the Nodes View" -custom_edit_url: https://github.com/netdata/netdata/edit/master/docs/netdata-cloud/nodes-view.md ---- ---> - -# Using the Nodes View - -## Introduction - -As of v1.15.0 of Netdata, and in conjunction with our announcement post about the [future of Netdata](https://blog.netdata.cloud/posts/netdata-cloud-announcement/), we have enabled an entirely new way to view your infrastructure using the open-source Netdata agent in conjunction with Netdata Cloud: the **Nodes View**. - -This view, powered by Netdata Cloud, provides an aggregated view of the Netdata agents that you have associated with your Netdata Cloud account. The main benefit of Nodes View is seeing the health of your infrastructure from a single interface, especially if you have many systems running Netdata. With Nodes View, you can monitor the health status of your nodes via active alarms and view a subset of real-time performance metrics the agent is collecting every second. - -!!! attention "Nodes View is beta software!" - The Nodes View is currently in beta, so all typical warnings about beta software apply. You may come across bugs or inconsistencies. - -``` -The current version of Nodes uses the API available on each Netdata agent to check for new alarms and the machine's overall health/availability. In the future, we will offer both polling via the API and real-time streaming of health status/metrics. -``` - -## The Nodes View - -To access the Nodes View, you must first be signed in to Netdata Cloud. To register for an account, or sign in to an existing account, visit our [signing in guide](signing-in.md) for details. - -Once you're signed in to Netdata Cloud, clicking on any of the **Nodes Beta** buttons in the node's web dashboard will lead you to the Nodes View. Find one (`1`) in the dropdown menu in the upper-right corner, a second (`2`) in the top navigation bar, and a third (`3`) in the dropdown menu in the top-left corner of the Netdata dashboard. - -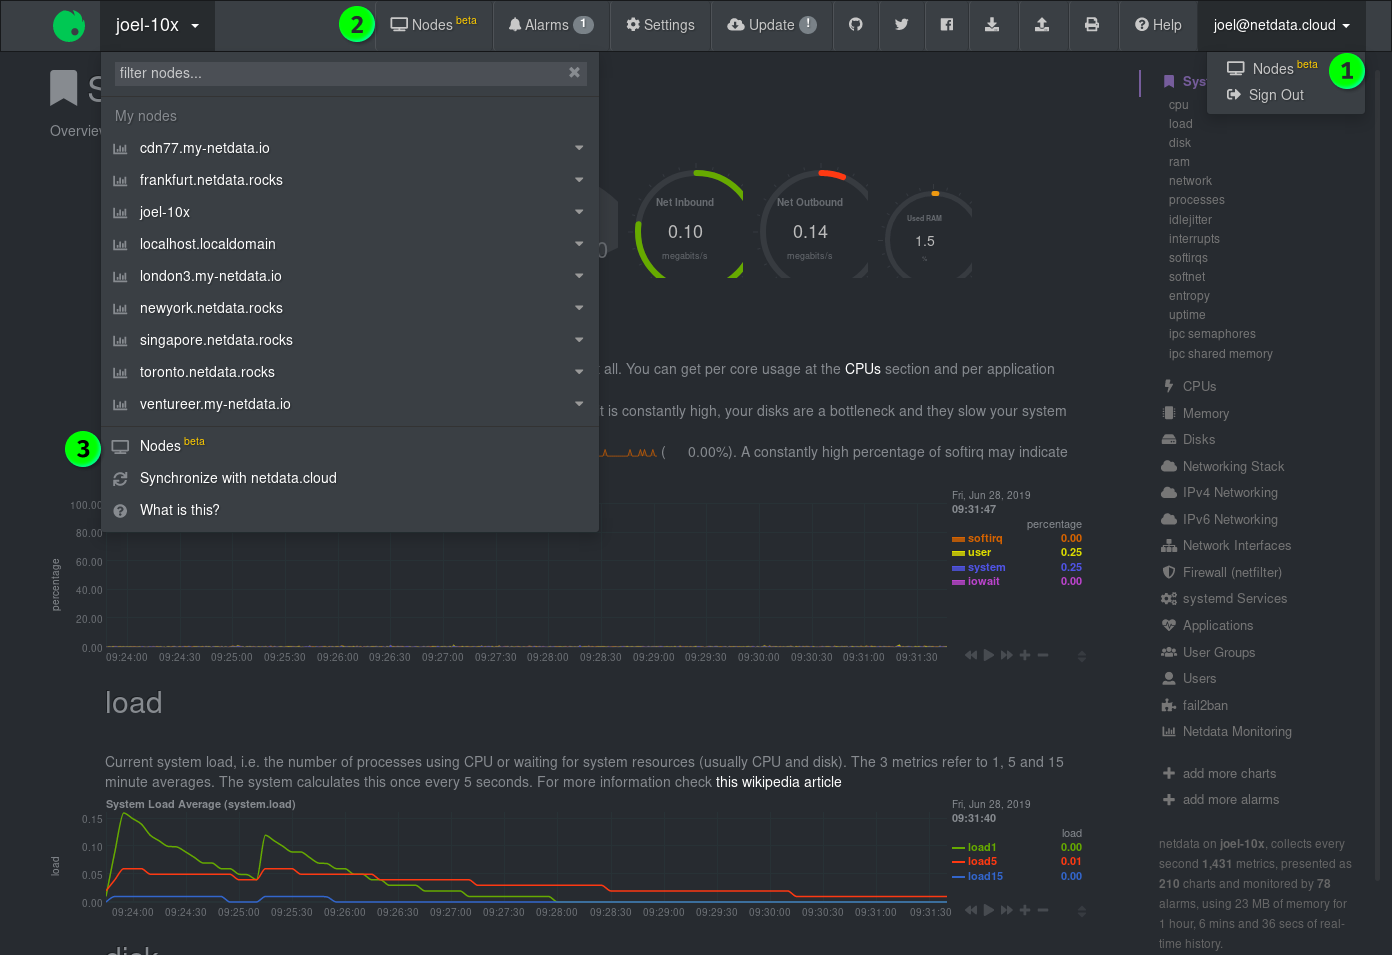 - -### Nodes - -The primary component of the Nodes View is a list of all the nodes with Netdata agents you have associated with your Netdata Cloud account via the Netdata Cloud registry. - -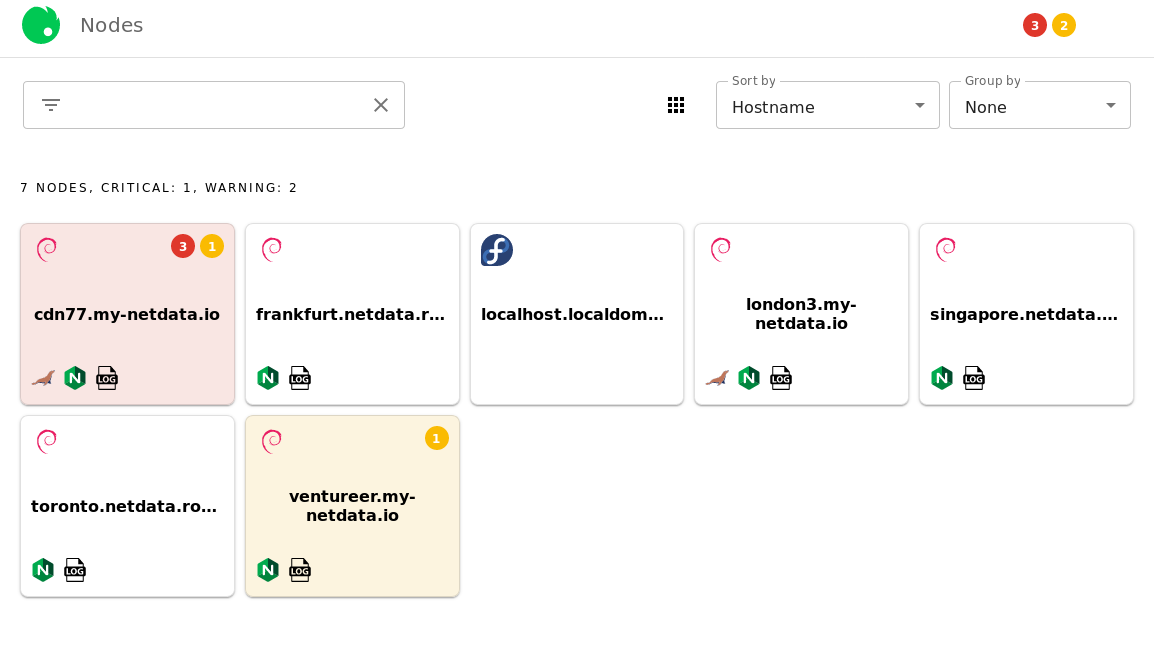 - -Depending on which [view mode](#view-modes) you're using, Nodes View will present you with information about that node, such as its hostname, operating system, warnings/critical alerts, and any [supported services](#Services-available-in-the-Nodes-View) that are running on that node. Here is an example of the **full** view mode: - -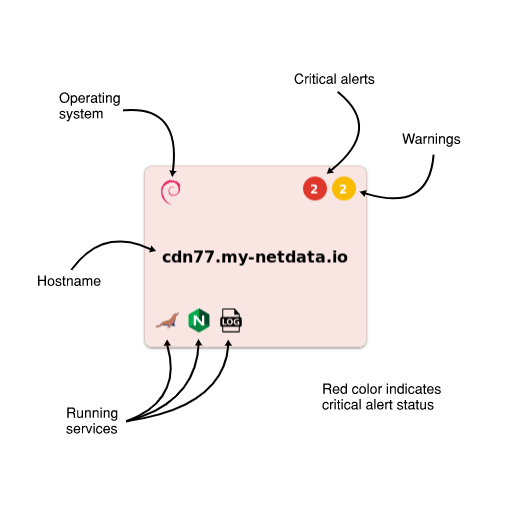 - -The background color of each Node entry is an indication of its health status: - -| Health status | Background color | -| ------------- | ------------------------------------------------------------------------------------------------- | -| **White** | Normal status, no alarms | -| **Yellow** | 1 or more active warnings | -| **Red** | 1 or more active critical alerts | -| **Grey** | Node is unreachable (server unreachable [due to network conditions], server down, or changed URL) | - -### Node overview - -When you click on any of the Nodes, an overview sidebar will appear on the right-hand side of the Nodes View. - -This overview contains the following: - -- An icon (`1`) representing the operating system installed on that machine -- The hostname (`2`) of the machine -- A link (`3`) to the URL at which the web dashboard is available -- Three tabs (`4`) for **System** metrics, **Services** metrics, and **Alarms** -- A number of selectors (`5`) to choose which metrics/alarms are shown in the overview - - **System** tab: _Overview_, _Disks_, and _Network_ selectors - - **Services** tab: _Databases_, _Web_, and _Messaging_ selectors - - **Alarms** tab: _Critical_ and _Warning_ selectors -- The visualizations and/or alarms (`6`) supported under the chosen tab and selector -- Any other available URLS (`7`) associated with that node under the **Node URLs** header. - -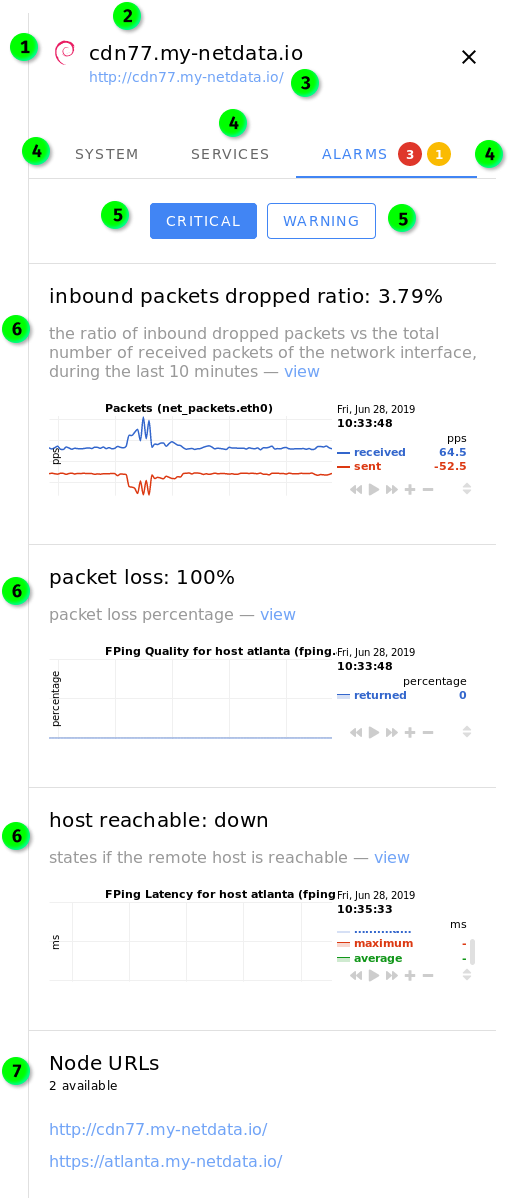 - -By default, clicking on a Node will display the sidebar with the **System** tab enabled. If there are warnings or alarms active for that Node, the **Alarms** tab will be displayed by default. - -**The visualizations in the overview sidebar are live!** As with all of Netdata's visualizations, you can scrub forward and backward in time, zoom, pause, and pinpoint anomalies down to the second. - -#### System tab - -The **System** tab has three sections: *Overview*, *Disks*, and *Network*. - -_Overview_ displays visualizations for `CPU`, `System Load Average` `Disk I/O`, `System RAM`, `System Swap`, `Physical Network Interfaces Aggregated Bandwidth`, and the URL of the node. - -_Disks_ displays visualizations for `Disk Utilization Time`, and `Disk Space Usage` for every available disk. - -_Network_ displays visualizations for `Bandwidth` for every available networking device. - -#### Services tab - -The **Services** tab will show visualizations for any [supported services](#Services-available-in-the-Nodes-View) that are running on that node. Three selectors are available: _Databases_, _Web_, and _Messaging_. If there are no services under any of these categories, the selector will not be clickable. - -#### Alarms tab - -The **Alarms** tab contains two selectors: _Critical_ and _Warning_. If there are no alarms under either of these categories, the selector will not be clickable. - -Both of these tabs will display alarms information when available, along with the relevant visualization with metrics from your Netdata agent. The `view` link redirects you to the web dashboard for the selected node and automatically shows the appropriate visualization and timeframe. - -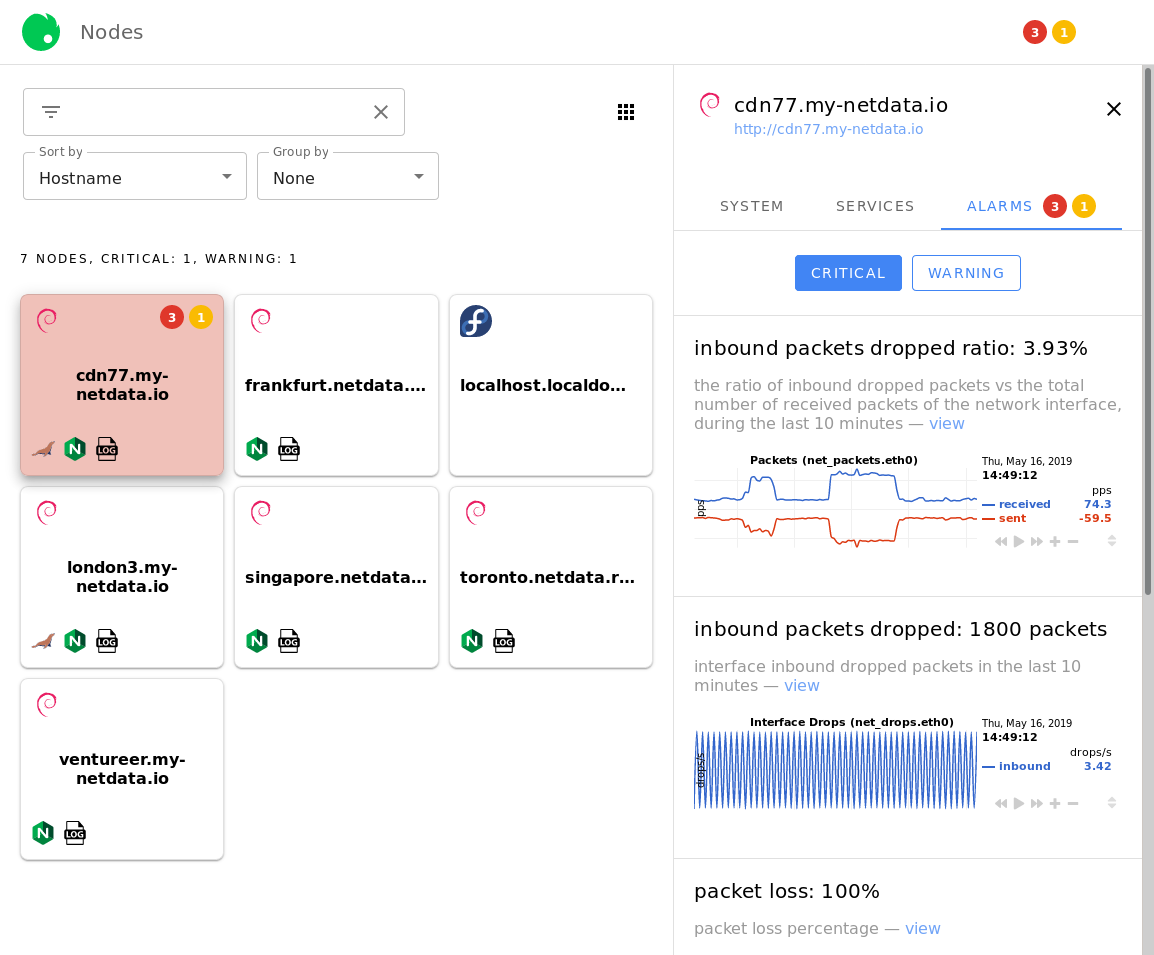 - -### Filtering field - -The search field will be useful for Netdata Cloud users with dozens or hundreds of Nodes. You can filter for the hostname of the Node you're interested in, the operating system it's running, or even for the services installed. - -The filtering field will offer you autocomplete suggestions. For example, the options available after typing `ng` into the filtering field: - -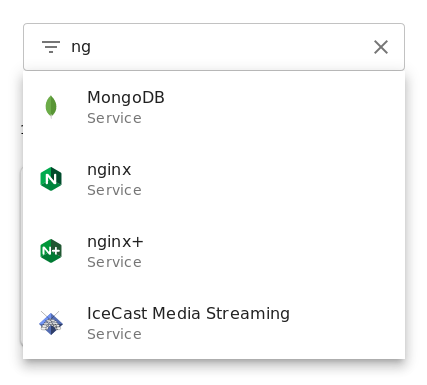 - -If you select multiple filters, results will display according to an `OR` operator. - -### View modes - -To the right of the filtering field is three functions that will help you organize your Visited Nodes according to your preferences. - -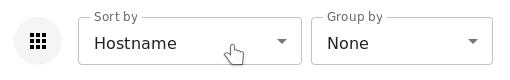 - -The view mode button lets you switch between three view modes: - -- **Full** mode, which displays the following information in a large squares for each connected Node: - - Operating system - - Critical/warning alerts in two separate indicators - - Hostname - - Icons for [supported services](#services-available-in-the-nodes-view) - -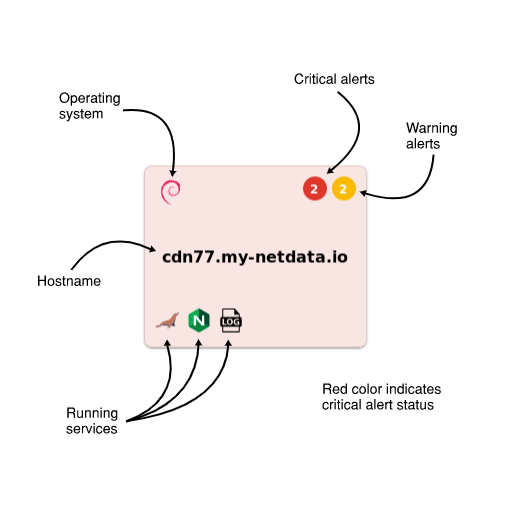 - -- **Compact** mode, which displays the following information in small squares for each connected Node: - - Operating system - -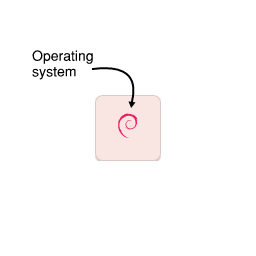 - -- **Detailed** mode, which displays the following information in large horizontal rectangles for each connected Node: - - Operating system - - Critical/warning alerts in two separate indicators - - Hostname - - Icons for [supported services](#services-available-in-the-nodes-view) - -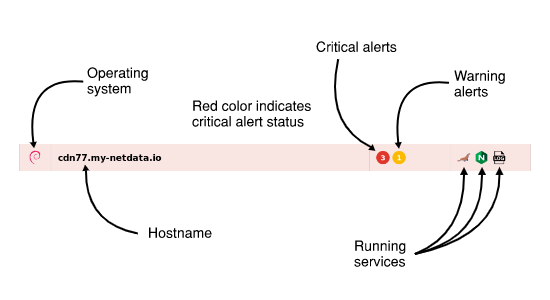 - -## Sorting, and grouping - -The **Sort by** dropdown allows you to choose between sorting _alphabetically by hostname_, most _recently-viewed_ nodes, and most _frequently-view_ nodes. - -The **Group by** dropdown lets you switch between _alarm status_, _running services_, or _online status_. - -For example, the following screenshot represents the Nodes list with the following options: _detailed list_, _frequently visited_, and _alarm status_. - -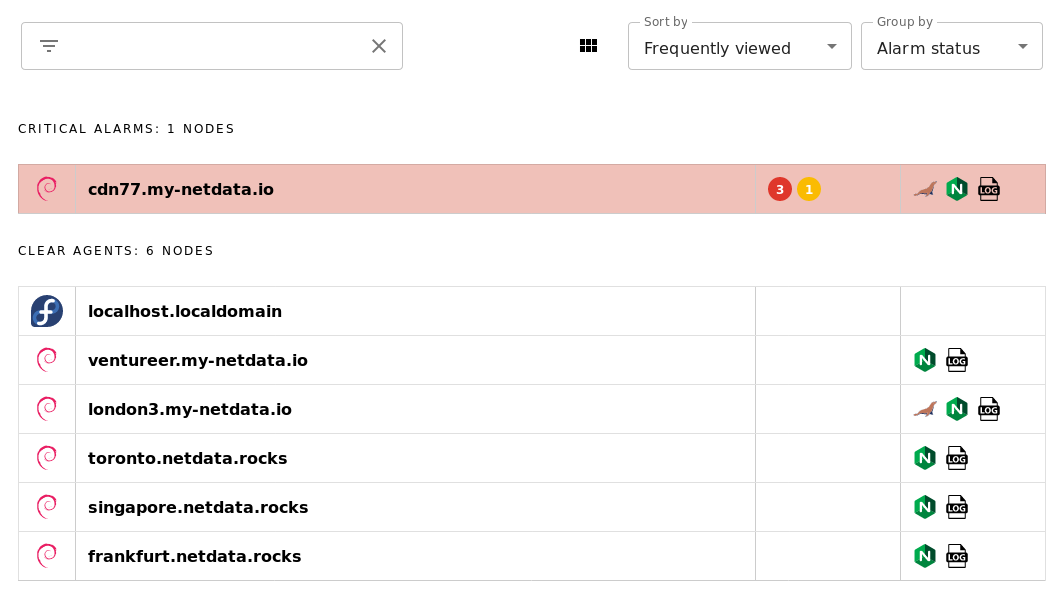 - -Play around with the options until you find a setup that works for you. - -## Adding more agents to the Nodes View - -There is currently only one way to associate additional Netdata nodes with your Netdata Cloud account. You must visit the web dashboard for each node and click the **Sign in** button and complete the [sign in process](signing-in.md#signing-in-to-your-netdata-cloud-account). - -!!! note "" - We are aware that the process of registering each node individually is cumbersome for those who want to implement Netdata Cloud's features across a large infrastructure. - -``` -Please view [this comment on issue #6318](https://github.com/netdata/netdata/issues/6318#issuecomment-504106329) for how we plan on improving the process for adding additional nodes to your Netdata Cloud account. -``` - -## Services available in the Nodes View - -The following tables elaborate on which services will appear in the Nodes View. Alerts from [other collectors](/collectors/README.md), when entered an alarm status, will show up in the _Alarms_ tab despite not appearing in the - -### Databases - -These services will appear under the _Databases_ selector beneath the _Services_ tab. - -| Service | Collectors | Context #1 | Context #2 | Context #3 | -|--- |--- |--- |--- |--- | -| MySQL | `python.d.plugin:mysql`, `go.d.plugin:mysql` | `mysql.queries` | `mysql.net` | `mysql.connections` | -| MariaDB | `python.d.plugin:mysql`, `go.d.plugin:mysql` | `mysql.queries` | `mysql.net` | `mysql.connections` | -| Oracle Database | `python.d.plugin:oracledb` | `oracledb.session_count` | `oracledb.physical_disk_read_writes ` | `oracledb.tablespace_usage_in_percent` | -| PostgreSQL | `python.d.plugin:postgres` | `postgres.checkpointer` | `postgres.archive_wal` | `postgres.db_size` | -| MongoDB | `python.d.plugin:mongodb` | `mongodb.active_clients` | `mongodb.read_operations` | `mongodb.write_operations` | -| ElasticSearch | `python.d.plugin:elasticsearch` | `elastic.search_performance_total` | `elastic.index_performance_total` | `elastic.index_segments_memory` | -| CouchDB | `python.d.plugin:couchdb` | `couchdb.activity` | `couchdb.response_codes` | | -| Proxy SQL | `python.d.plugin:proxysql` | `proxysql.questions` | `proxysql.pool_status` | `proxysql.pool_overall_net` | -| Redis | `python.d.plugin:redis` | `redis.operations` | `redis.net` | `redis.connections` | -| MemCached | `python.d.plugin:memcached` | `memcached.cache` | `memcached.net` | `memcached.connections` | -| RethinkDB | `python.d.plugin:rethinkdbs` | `rethinkdb.cluster_queries` | `rethinkdb.cluster_clients_active` | `rethinkdb.cluster_connected_servers` | -| Solr | `go.d.plugin:solr` | `solr.search_requests` | `solr.update_requests` | | - -### Web services - -These services will appear under the _Web_ selector beneath the _Services_ tab. These also include proxies, load balancers (LB), and streaming services. - -| Service | Collectors | Context #1 | Context #2 | Context #3 | -|--- |--- |--- |--- |--- | -| Apache | `python.d.plugin:apache`, `go.d.plugin:apache` | `apache.requests` | `apache.connections` | `apache.net ` | -| nginx | `python.d.plugin:nginx`, `go.d.plugin:nginx` | `nginx.requests` | `nginx.connections` | | -| nginx+ | `python.d.plugin:nginx_plus` | `nginx_plus.requests_total` | `nginx_plus.connections_statistics` | | -| lighthttpd | `python.d.plugin:lighttpd`, `go.d.plugin:lighttpd` | `lighttpd.requests` | `lighttpd.net` | | -| lighthttpd2 | `go.d.plugin:lighttpd2` | `lighttpd2.requests` | `lighttpd2.traffic` | | -| LiteSpeed | `python.d.plugin:litespeed` | `litespeed.requests` | `litespeed.requests_processing` | | -| Tomcat | `python.d.plugin:tomcat` | `tomcat.accesses` | `tomcat.processing_time` | `tomcat.bandwidth` | -| PHP FPM | `python.d.plugin:phpfm` | `phpfpm.performance` | `phpfpm.requests` | `phpfpm.connections` | -| HAproxy | `python.d.plugin:haproxy` | `haproxy_f.scur` | `haproxy_f.bin` | `haproxy_f.bout` | -| Squid | `python.d.plugin:squid` | `squid.clients_requests` | `squid.clients_net` | | -| Traefik | `python.d.plugin:traefik` | `traefik.response_codes` | | | -| Varnish | `python.d.plugin:varnish` | `varnish.session_connection` | `varnish.client_requests` | | -| IPVS | `proc.plugin:/proc/net/ip_vs_stats` | `ipvs.sockets` | `ipvs.packets` | | -| Web Log | `python.d.plugin:web_log`, `go.d.plugin:web_log` | `web_log.response_codes` | `web_log.bandwidth` | | -| IPFS | `python.d.plugin:ipfs` | `ipfs.bandwidth` | `ipfs.peers` | | -| IceCast Media Streaming | `python.d.plugin:icecast` | `icecast.listeners` | | | -| RetroShare | `python.d.plugin:retroshare` | `retroshare.bandwidth` | `retroshare.peers` | | -| HTTP Check | `python.d.plugin:httpcheck`, `go.d.plugin:httpcheck` | `httpcheck.responsetime` | `httpcheck.status` | | -| x509 Check | `go.d.plugin:x509check` | `x509check.time_until_expiration` | | | - -### Messaging - -These services will appear under the _Messaging_ selector beneath the _Services_ tab. - -| Service | Collectors | Context #1 | Context #2 | Context #3 | -| --- | --- | --- | --- | --- | -| RabbitMQ | `python.d.plugin:rabbitmq`, `go.d.plugin:rabbitmq` | `rabbitmq.queued_messages` | `rabbitmq.erlang_run_queue` | -| Beanstalkd | `python.d.plugin:beanstalk` | `beanstalk.total_jobs_rate` | `beanstalk.connections_rate` | `beanstalk.current_tubes` | - -[](<>) diff --git a/docs/netdata-cloud/signing-in.md b/docs/netdata-cloud/signing-in.md deleted file mode 100644 index 5c0e60c3c8..0000000000 --- a/docs/netdata-cloud/signing-in.md +++ /dev/null @@ -1,175 +0,0 @@ -<!-- ---- -title: "Registration and signing in" -custom_edit_url: https://github.com/netdata/netdata/edit/master/docs/netdata-cloud/signing-in.md ---- ---> - -# Registration and signing in - -To use the features of [Netdata Cloud](/docs/netdata-cloud/README.md), you must first register an account with Netdata -Cloud and associate your first Netdata node with the Netdata Cloud [registry](/registry/README.md). **Netdata Cloud is -entirely free for all Netdata users**, and does not store any metrics created by your machines. You keep your -data—Netdata Cloud just connects it all together. - -> By [signing in](/docs/netdata-cloud/signing-in.md) to Netdata Cloud, you opt-in to let Netdata Cloud receive and store -> the information described [here](/registry/README.md#what-data-does-the-registry-store). We never store the metrics -> collected by Netdata agents, just machine GUIDs, person GUID, URLs, and account information. - -## Registering a Netdata Cloud account - -There is only one prerequisite to using Netdata Cloud: A working Netdata agent. If you don't have a running Netdata -agent yet, check out the [installation guides](/packaging/installer/README.md) for more information. - -To begin, visit the web dashboard of your Netdata agent by navigating your browser of choice to `http://SERVER-IP:19999`. You’ll see a dashboard much like this: - -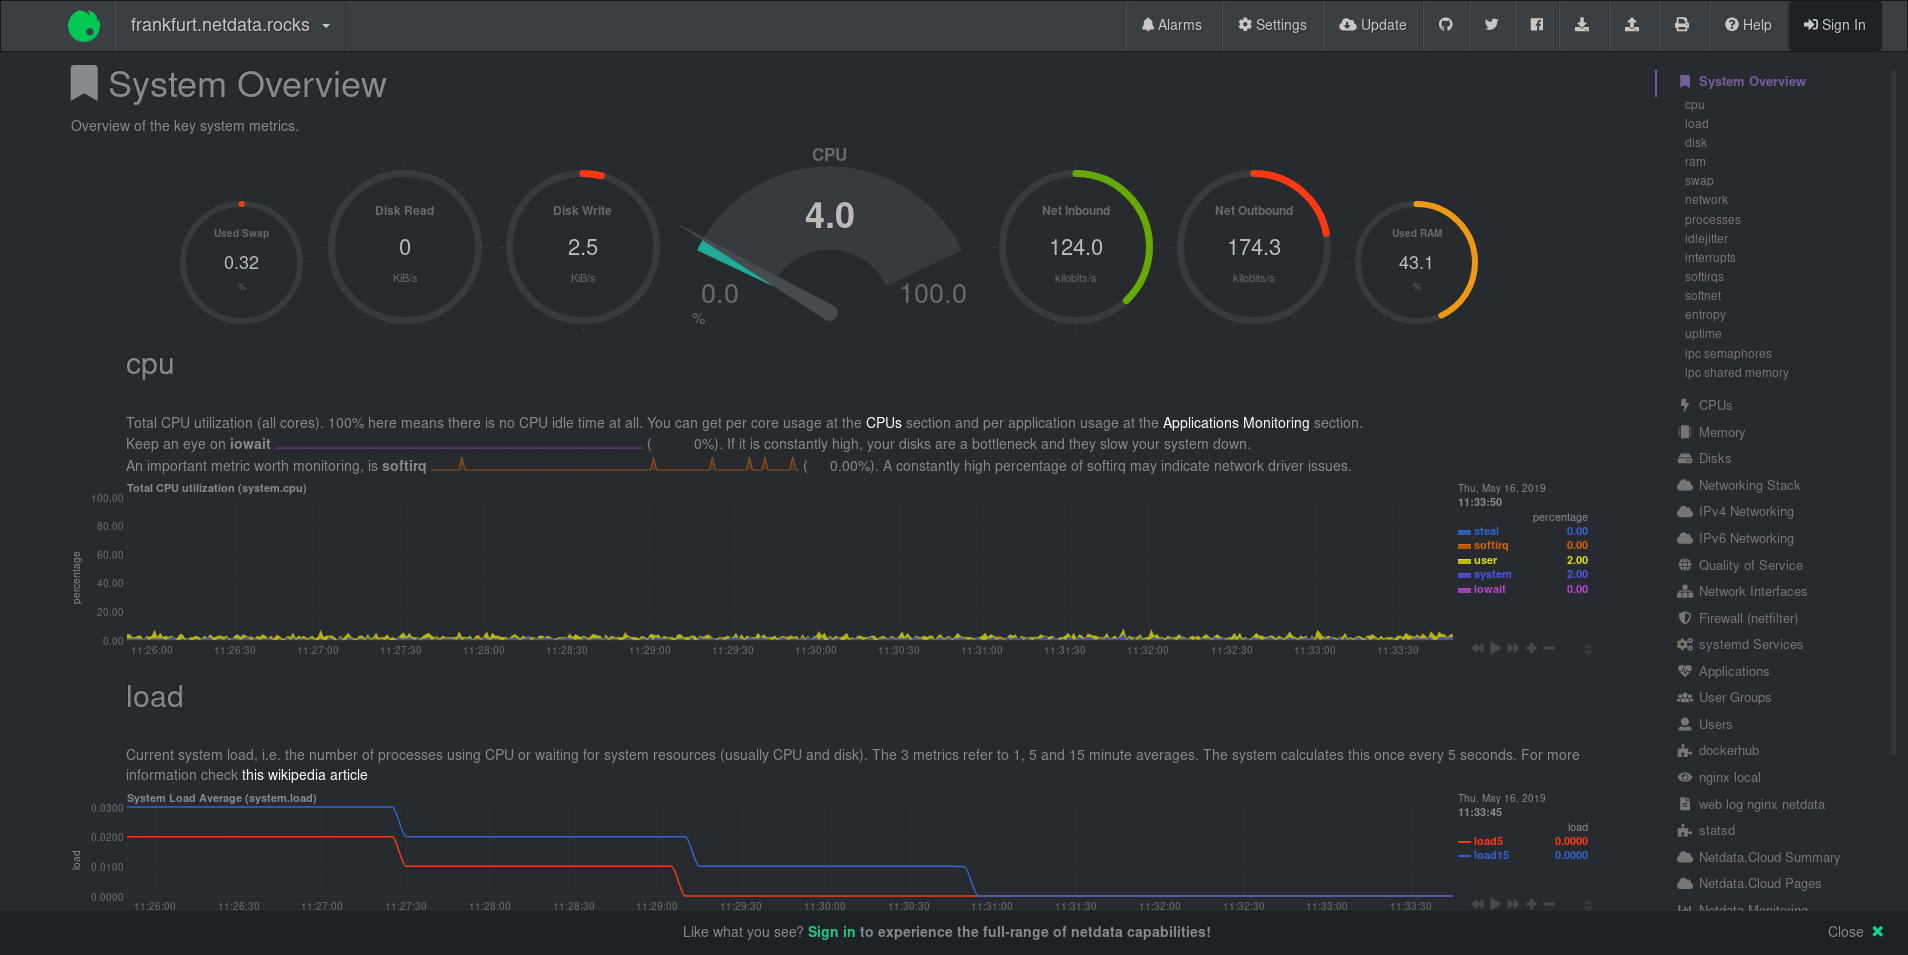 - -From here, you need to register for a Netdata Cloud account. Click on the **Sign in** button on the top-right corner of the dashboard's view. - -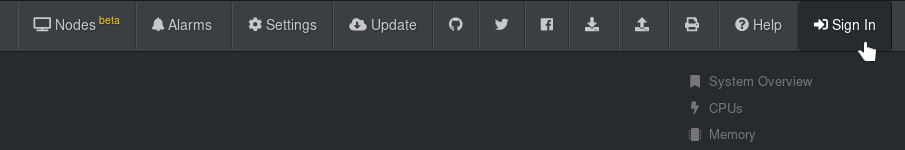 - -??? note "Alternative registration routes" - While we recommend the **Sign in** button, the Netdata dashboard has one other direct route registering for or signing in to a Netdata Cloud account. - - -The text **Please sign in to netdata.cloud to view your nodes!** contains a link to access Netdata Cloud. - -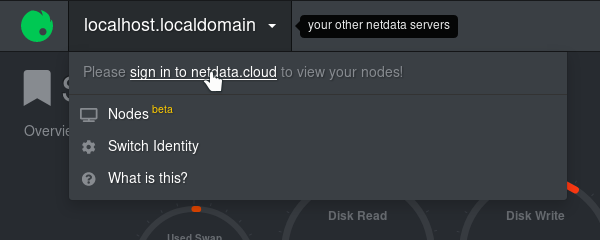 - -Two other routes exist, but they are more directly related to accessing the Nodes View. They will, however, require either registration or sign in and thus are valid routes to access Netdata Cloud. - -One route can be found in the **Nodes Beta** button the left side of the navigation menu: - -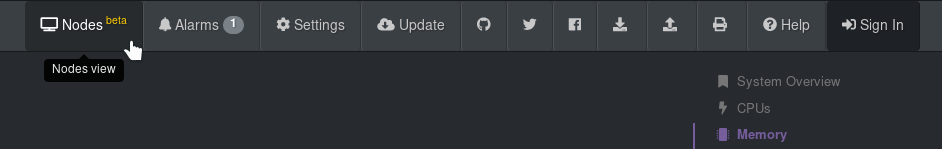 - -A second route can be found in the Nodes List—the drop-down menu in the top-left corner of the Netdata dashboard: - - 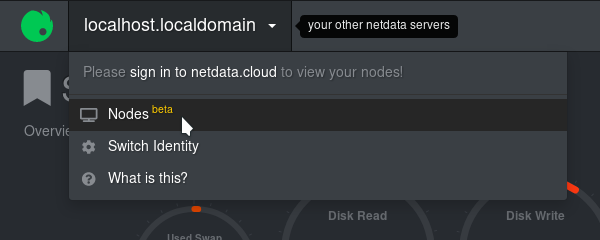 - - -??? note "Registration route when using a private registry" - If you're using a private registry, clicking the **Sign in** button will display a modal window warning you about the process of migrating away from your private registry and to Netdata Cloud's registry. - - -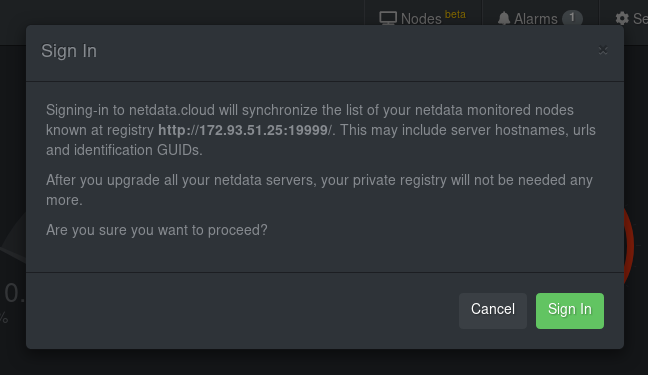 - -If you agree to use Netdata Cloud over your private registry, and opt-in to let Netdata Cloud receive and store the information described [here](/registry/README.md#what-data-does-the-registry-store), you should click the **Sign in** button again. If not, click the **Cancel** button to continue using your private registry. - - -### Choosing your registration or sign in method - -After clicking the **Sign in** button, you'll be directed to the Netdata Cloud registration/sign in page. Choose to authorize with your Google account, GitHub account, or email. - -!!! attention - Be consistent with the sign in method you use, whether GitHub, Google, or email. If you sign in via different methods, the system will create multiple Netdata Cloud accounts, one for each sign-in method used. We plan to offer multiple authentication methods for the same account in the future. - -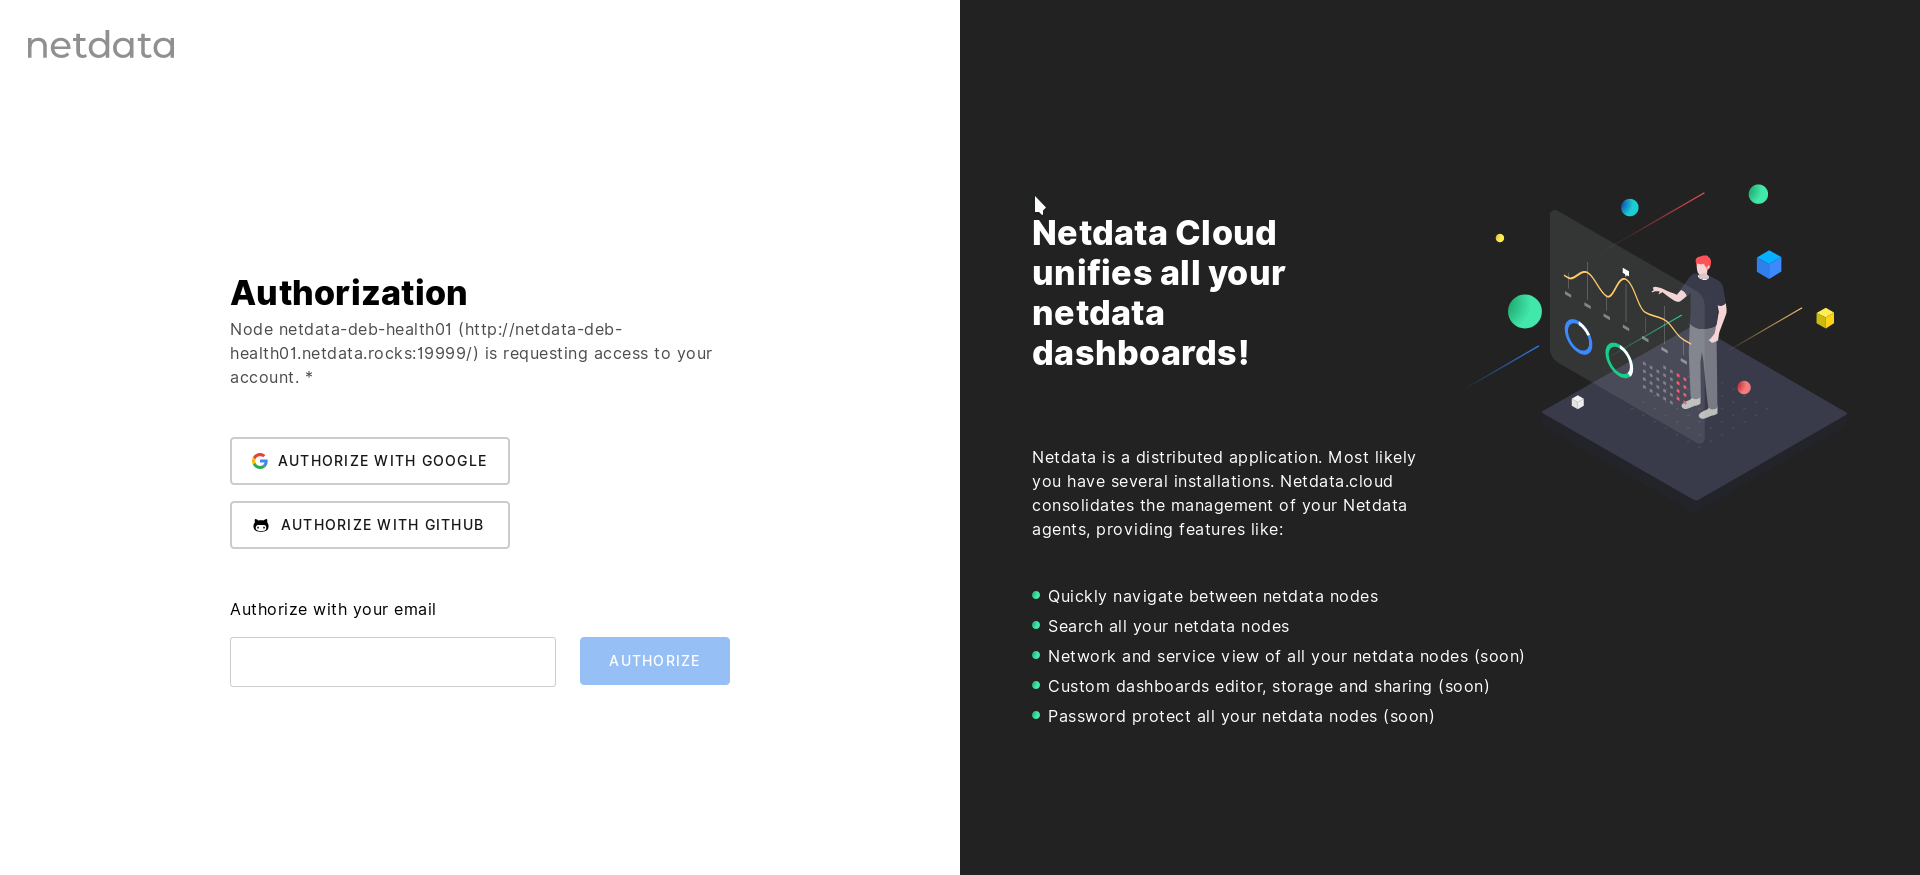 - -### Registration via Google - -Click the **Authorize with Google** button to begin registration. You will be redirected to a Google authentication form where you confirm you will "share your name, email address, language preference, and profile picture with netdata.cloud." - -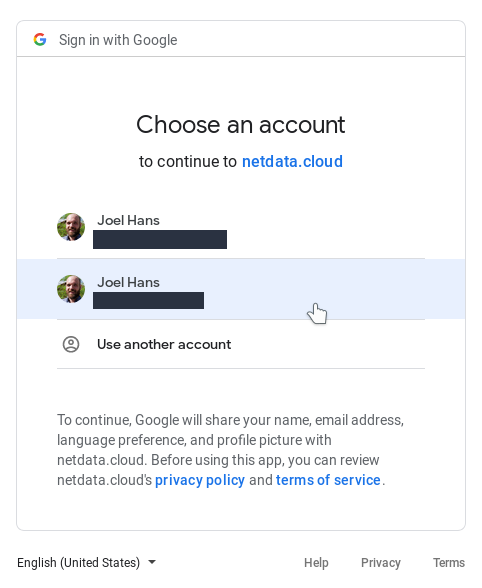 - -Click on the account you would like to connect to Netdata Cloud to continue and then skip down to [Visiting Netdata Cloud for the first time](#visiting-the-nodes-view-for-the-first-time) for further instructions. - -### Registration via GitHub - -Click the **Authorize with GitHub** button to begin registration. You will be redirected to a GitHub authentication form where you confirm to share your email address with Netdata Cloud to create your account. - - - -Click the **Authorize Netdata** button to continue and then skip down to [Visiting Netdata Cloud for the first time](#visiting-the-nodes-view-for-the-first-time) for further instructions. - -### Registration via email - -Enter your preferred email into the field and click the **Authorize** button. - -Open your email account and check for the verification email—it should arrive in less than a minute. If it doesn't show up, check your spam folder or click the **Resend email** button in the Netdata Cloud interface. - -When the email arrives, open it and click on the green **Sign in** button and then skip down to [Visiting Netdata Cloud for the first time](#visiting-the-nodes-view-for-the-first-time) for further instructions. - - - -## Visiting the Nodes View for the first time - -Regardless of which sign in method you used, you'll now be redirected back to your Netdata agent's dashboard. This node has now been associated with your Netdata Cloud account. Netdata Cloud uses a list of nodes associated with your account to populate |