
diff options
| author | Joel Hans <joel@netdata.cloud> | 2020-06-04 07:12:48 -0700 |
|---|---|---|
| committer | GitHub <noreply@github.com> | 2020-06-04 07:12:48 -0700 |
| commit | 78ca668e50d88670f8aaf4d2434e325f705f975c (patch) | |
| tree | 418f27c298dd093ff7ef033c970da92686d196aa /docs | |
| parent | b1c96ce59d2eb7e46b35609b03715c9c15243aa6 (diff) | |
Cleanup of main README and registry doc (#9265)
* Cleanup README and remove old link
* Additional cleanup
* One more alignment
Diffstat (limited to 'docs')
| -rw-r--r-- | docs/what-is-netdata.md | 34 |
1 files changed, 19 insertions, 15 deletions
diff --git a/docs/what-is-netdata.md b/docs/what-is-netdata.md index e3a97ffb0f..a9a8a9662d 100644 --- a/docs/what-is-netdata.md +++ b/docs/what-is-netdata.md @@ -37,7 +37,7 @@ Netdata is **fast** and **efficient**, designed to permanently run on all system Netdata is **free, open-source software** and it currently runs on **Linux**, **FreeBSD**, and **macOS**, along with other systems derived from them, such as **Kubernetes** and **Docker**. -Netdata is not hosted by the CNCF but is the 3rd most starred open-source project in the [Cloud Native Computing +Netdata is not hosted by the CNCF but is the fourth most starred open-source project in the [Cloud Native Computing Foundation (CNCF) landscape](https://landscape.cncf.io/format=card-mode&grouping=no&sort=stars). --- @@ -77,7 +77,8 @@ action](https://user-images.githubusercontent.com/1153921/80827388-b9fee100-8b98 > wheel`, an area can be selected for zoom-in with `SHIFT` + `mouse selection`. Netdata is highly interactive, > **real-time**, and optimized to get the work done! -Want to see Netdata live? Check out any of our [live demos](https://www.netdata.cloud/#live-demo). +Want to try Netdata before you install? See our [live +demo](https://london.my-netdata.io/default.html#menu_system_submenu_cpu;theme=slate;help=true). ## User base @@ -155,11 +156,14 @@ To try Netdata in a Docker container, run this: ```sh docker run -d --name=netdata \ -p 19999:19999 \ + -v netdatalib:/var/lib/netdata \ + -v netdatacache:/var/cache/netdata \ -v /etc/passwd:/host/etc/passwd:ro \ -v /etc/group:/host/etc/group:ro \ -v /proc:/host/proc:ro \ -v /sys:/host/sys:ro \ - -v /var/run/docker.sock:/var/run/docker.sock:ro \ + -v /etc/os-release:/host/etc/os-release:ro \ + --restart unless-stopped \ --cap-add SYS_PTRACE \ --security-opt apparmor=unconfined \ netdata/netdata @@ -219,12 +223,12 @@ This is how it works: | Function | Description | Documentation | | :---------- | :------------------------------------------------------------------------------------------------------------------------------------------------------------------------------------------------------------------------------------------------------------- | :-------------------------------------------------- | -| **Collect** | Multiple independent data collection workers are collecting metrics from their sources using the optimal protocol for each application and push the metrics to the database. Each data collection worker has lockless write access to the metrics it collects. | [`collectors`](/collectors/README.md) | -| **Store** | Metrics are first stored in RAM in a custom database engine that then "spills" historical metrics to disk for efficient long-term metrics storage. | [`database`](/database/README.md) | -| **Check** | A lockless independent watchdog is evaluating **health checks** on the collected metrics, triggers alarms, maintains a health transaction log and dispatches alarm notifications. | [`health`](/health/README.md) | -| **Stream** | A lockless independent worker is streaming metrics, in full detail and in real-time, to remote Netdata servers, as soon as they are collected. | [`streaming`](/streaming/README.md) | -| **Archive** | A lockless independent worker is down-sampling the metrics and pushes them to external time-series databases. | [`exporting`](/exporting/README.md) | -| **Query** | Multiple independent workers are attached to the [internal web server](/web/server/README.md), servicing API requests, including [data queries](/web/api/queries/README.md). | [`web/api`](/web/api/README.md) | +| **Collect** | Multiple independent data collection workers are collecting metrics from their sources using the optimal protocol for each application and push the metrics to the database. Each data collection worker has lockless write access to the metrics it collects. | [`collectors`](/collectors/README.md) | +| **Store** | Metrics are first stored in RAM in a custom database engine that then "spills" historical metrics to disk for efficient long-term metrics storage. | [`database`](/database/README.md) | +| **Check** | A lockless independent watchdog is evaluating **health checks** on the collected metrics, triggers alarms, maintains a health transaction log and dispatches alarm notifications. | [`health`](/health/README.md) | +| **Stream** | A lockless independent worker is streaming metrics, in full detail and in real-time, to remote Netdata servers, as soon as they are collected. | [`streaming`](/streaming/README.md) | +| **Archive** | A lockless independent worker is down-sampling the metrics and pushes them to **backend** time-series databases. | [`exporting`](/docs/export/README.md) | +| **Query** | Multiple independent workers are attached to the [internal web server](/web/server/README.md), servicing API requests, including [data queries](/web/api/queries/README.md). | [`web/api`](/web/api/README.md) | The result is a highly efficient, low-latency system, supporting multiple readers and one writer on each metric. @@ -279,10 +283,10 @@ This is what you should expect from Netdata: ### Integrations - **Time-series databases** - Netdata can archive its metrics to **Graphite**, **OpenTSDB**, **Prometheus**, **AWS - Kinesis**, **Google Cloud Pub/Sub**, **MongoDB**, **JSON document DBs**, in the same or lower resolution (lower: to - prevent it from congesting these servers due to the amount of data collected). Netdata also supports **Prometheus - remote write API**, which allows storing metrics to **Elasticsearch**, **Gnocchi**, **InfluxDB**, **Kafka**, - **PostgreSQL/TimescaleDB**, **Splunk**, **VictoriaMetrics** and a lot of other [storage + Kinesis**, **MongoDB**, **JSON document DBs**, in the same or lower resolution (lower: to prevent it from congesting + these servers due to the amount of data collected). Netdata also supports **Prometheus remote write API**, which + allows storing metrics to **Elasticsearch**, **Gnocchi**, **InfluxDB**, **Kafka**, **PostgreSQL/TimescaleDB**, + **Splunk**, **VictoriaMetrics** and a lot of other [storage providers](https://prometheus.io/docs/operating/integrations/#remote-endpoints-and-storage). ## Visualization @@ -303,7 +307,7 @@ To improve clarity on charts, Netdata dashboards present **positive** values for `inbound`, `received` and **negative** values for metrics representing `write`, `output`, `outbound`, `sent`. 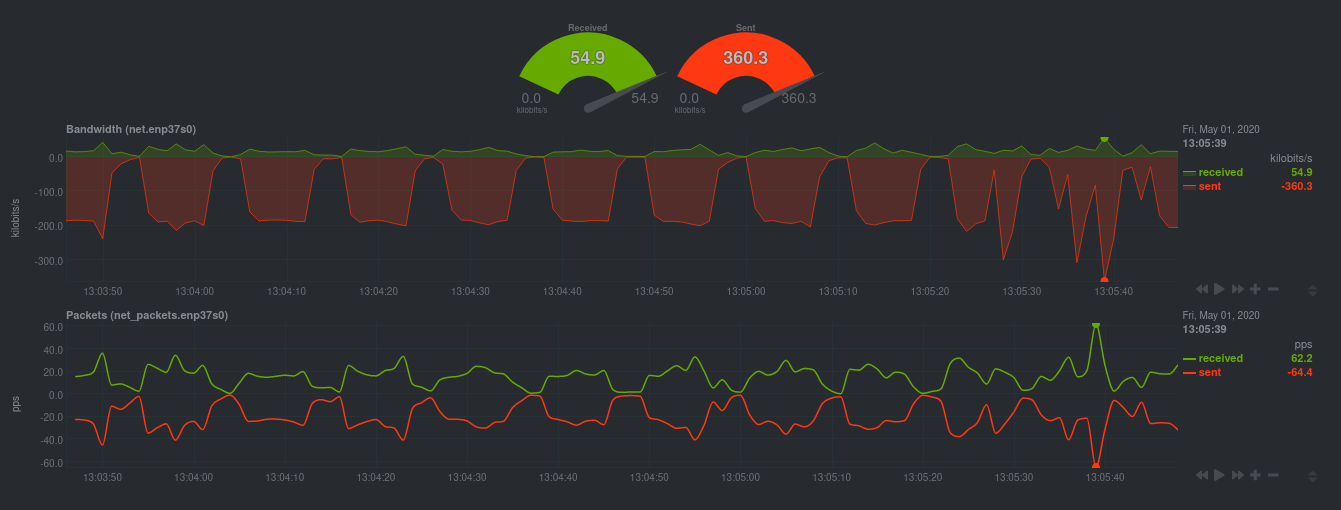 +values](https://user-images.githubusercontent.com/1153921/81870401-9d649080-952a-11ea-80e3-4a7b480252ee.gif) _Netdata charts showing the bandwidth and packets of a network interface. `received` is positive and `sent` is negative._ @@ -370,7 +374,7 @@ Here is a quick list of notable documents: | [`collectors`](/collectors/README.md) | Information about data collection plugins. | | [`health`](/health/README.md) | How Netdata's health monitoring works, how to create your own alarms and how to configure alarm notification methods. | | [`streaming`](/streaming/README.md) | How to build hierarchies of Netdata servers, by streaming metrics between them. | -| [`exporting`](/exporting/README.md) | Long term archiving of metrics to industry-standard time-series databases, like `prometheus`, `graphite`, `opentsdb`. | +| [`exporting`](/docs/export/README.md) | Long term archiving of metrics to industry-standard time-series databases, like `prometheus`, `graphite`, `opentsdb`. | | [`web/api`](/web/api/README.md) | Learn how to query the Netdata API and the queries it supports. | | [`web/api/badges`](/web/api/badges/README.md) | Learn how to generate badges (SVG images) from live data. | | [`web/gui/custom`](/web/gui/custom/README.md) | Learn how to create custom Netdata dashboards. | |