
diff options
| author | Joel Hans <joel@netdata.cloud> | 2020-06-09 10:20:17 -0700 |
|---|---|---|
| committer | GitHub <noreply@github.com> | 2020-06-09 10:20:17 -0700 |
| commit | 4456e300befe1f1c70f50ca39a921e03b8dfbc58 (patch) | |
| tree | 08ed2869c440ab1bdbfc2c9185a88bacf11c27fa /docs | |
| parent | 6a9a465497c760e0793d73ee1a579725fae9e75a (diff) | |
Add guide to exporting metrics to Graphite (#9285)
* Init guide, add links
* Grammar and typo pass
* Fixes for Thiago
* Fix for Vlad
Diffstat (limited to 'docs')
| -rw-r--r-- | docs/export/README.md | 8 | ||||
| -rw-r--r-- | docs/guides/export/export-netdata-metrics-graphite.md | 184 |
2 files changed, 188 insertions, 4 deletions
diff --git a/docs/export/README.md b/docs/export/README.md index bcc662250b..03d642e1b0 100644 --- a/docs/export/README.md +++ b/docs/export/README.md @@ -90,12 +90,12 @@ For details on all the configuration options, see the [exporting reference](/exp Restart your Agent to begin exporting to the destination of your choice. Because the Agent exports metrics as they're collected, you should start seeing data in your external database after only a few seconds. -## Exporting reference and related features +## Exporting reference, guides, and related features - [Exporting reference guide](/exporting/README.md) +- [Guide: Export and visualize Netdata metrics in Graphite](/docs/guides/export/export-netdata-metrics-graphite.md) +- [Guide: Use host labels to organize systems, metrics, and alarms](/docs/guides/using-host-labels.md) +- [Guide: Change how long Netdata stores metrics (long-term storage)](/docs/guides/longer-metrics-storage.md) - [Backends (deprecated)](/backends/README.md) -- [Use host labels to organize systems, metrics, and alarms](/docs/guides/using-host-labels.md) -- [Database engine](/database/engine/README.md) -- [Change how long Netdata stores metrics (long-term storage)](/docs/guides/longer-metrics-storage.md) [](<>) diff --git a/docs/guides/export/export-netdata-metrics-graphite.md b/docs/guides/export/export-netdata-metrics-graphite.md new file mode 100644 index 0000000000..473b33c391 --- /dev/null +++ b/docs/guides/export/export-netdata-metrics-graphite.md @@ -0,0 +1,184 @@ +<!-- +title: Export and visualize Netdata metrics in Graphite +description: Use Netdata to collect and export thousands of metrics to Graphite for long-term storage or further analysis. +image: /img/seo/guides/export/export-netdata-metrics-graphite.png +--> + +# Export and visualize Netdata metrics in Graphite + +Collecting metrics is an essential part of monitoring any application, service, or infrastructure, but it's not the +final step for any developer, sysadmin, SRE, or DevOps engineer who's keeping an eye on things. To take meaningful +action on these metrics, you may need to develop a stack of monitoring tools that work in parallel to help you diagnose +anomalies and discover root causes faster. + +We designed Netdata with interoperability in mind. The Agent collects thousands of metrics every second, and then what +you do with them is up to you. You can [store metrics in the database engine](/docs/guides/longer-metrics-storage.md), +or send them to another time series database for long-term storage or further analysis using Netdata's [exporting +engine](/docs/export/README.md). + +In this guide, we'll show you how to export Netdata metrics to [Graphite](https://graphiteapp.org/) for long-term +storage and further analysis. Graphite is a free open-source software (FOSS) tool that collects graphs numeric +time-series data, such as all the metrics collected by the Netdata Agent itself. Using Netdata and Graphite together, +you get more visibility into the health and performance of your entire infrastructure. + +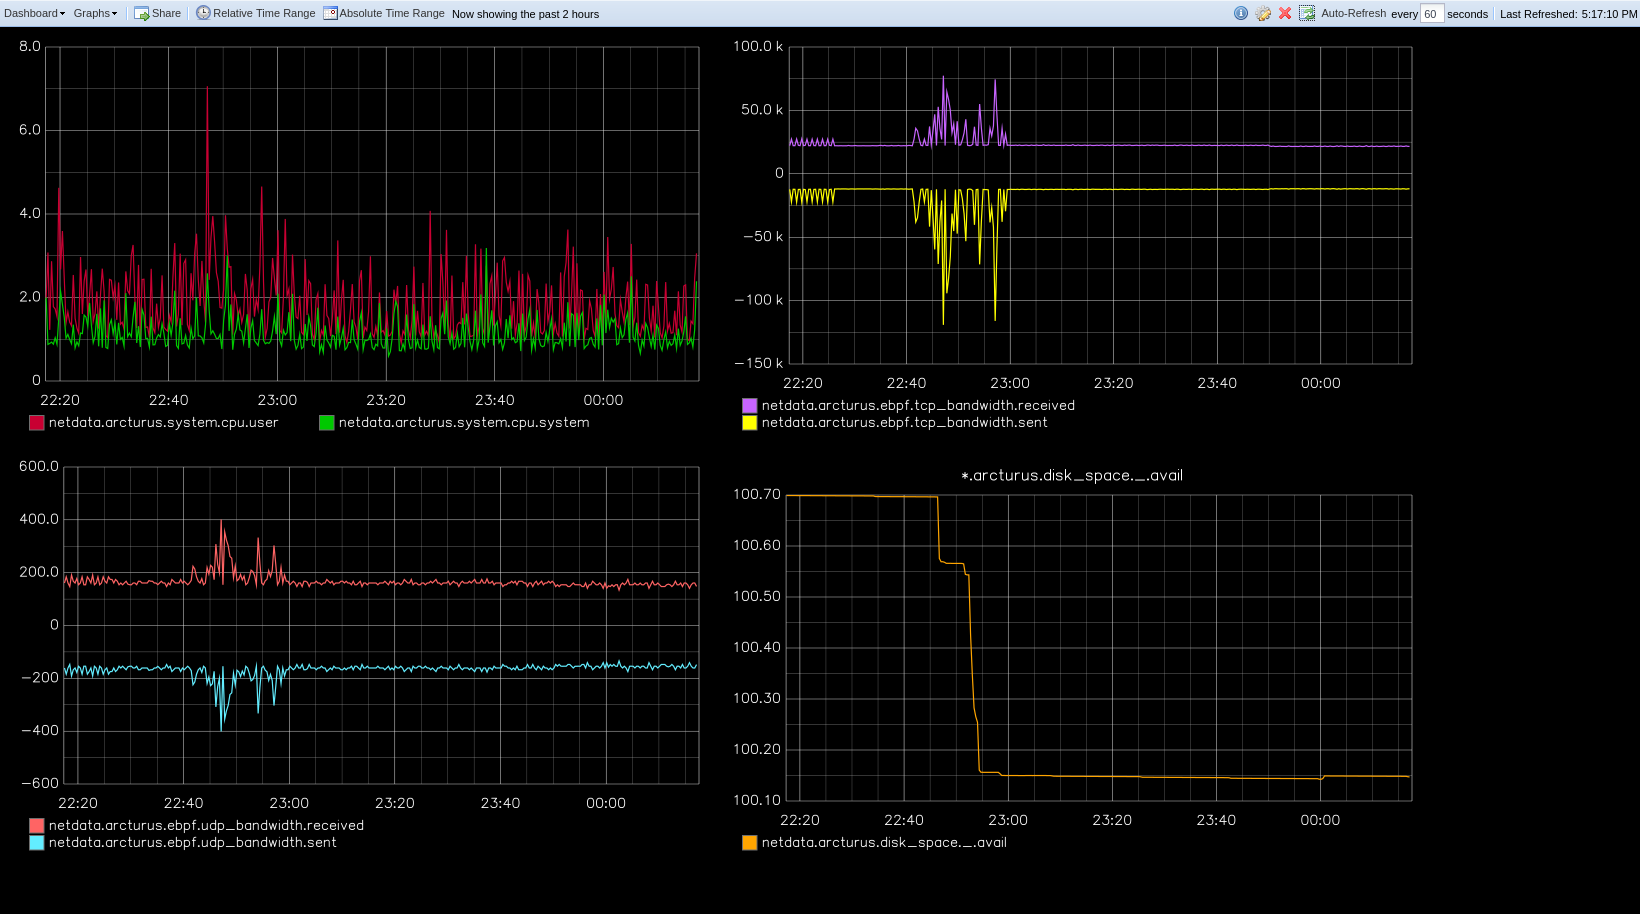 + +Let's get started. + +## Install the Netdata Agent + +If you don't have the Netdata Agent installed already, visit the [installation guide](/packaging/installer/README.md) +for the recommended instructions for your system. In most cases, you can use the one-line installation script: + +```bash +bash <(curl -Ss https://my-netdata.io/kickstart.sh) +``` + +Once installation finishes, open your browser and navigate to `http://NODE:19999`, replacing `NODE` with the IP address +or hostname of your system, to find the Agent dashboard. + +## Install Graphite via Docker + +For this guide, we'll install Graphite using Docker. See the [Docker documentation](https://docs.docker.com/get-docker/) +for details if you don't yet have it installed on your system. + +> If you already have Graphite installed, skip this step. If you want to install via a different method, see the +> [Graphite installation docs](https://graphite.readthedocs.io/en/latest/install.html), with the caveat that some +> configuration settings may be different. + +Start up the Graphite image with `docker run`. + +```bash +docker run -d \ + --name graphite \ + --restart=always \ + -p 80:80 \ + -p 2003-2004:2003-2004 \ + -p 2023-2024:2023-2024 \ + -p 8125:8125/udp \ + -p 8126:8126 \ + graphiteapp/graphite-statsd +``` + +Open your browser and navigate to `http://NODE`, to see the Graphite interface. Nothing yet, but we'll fix that soon +enough. + +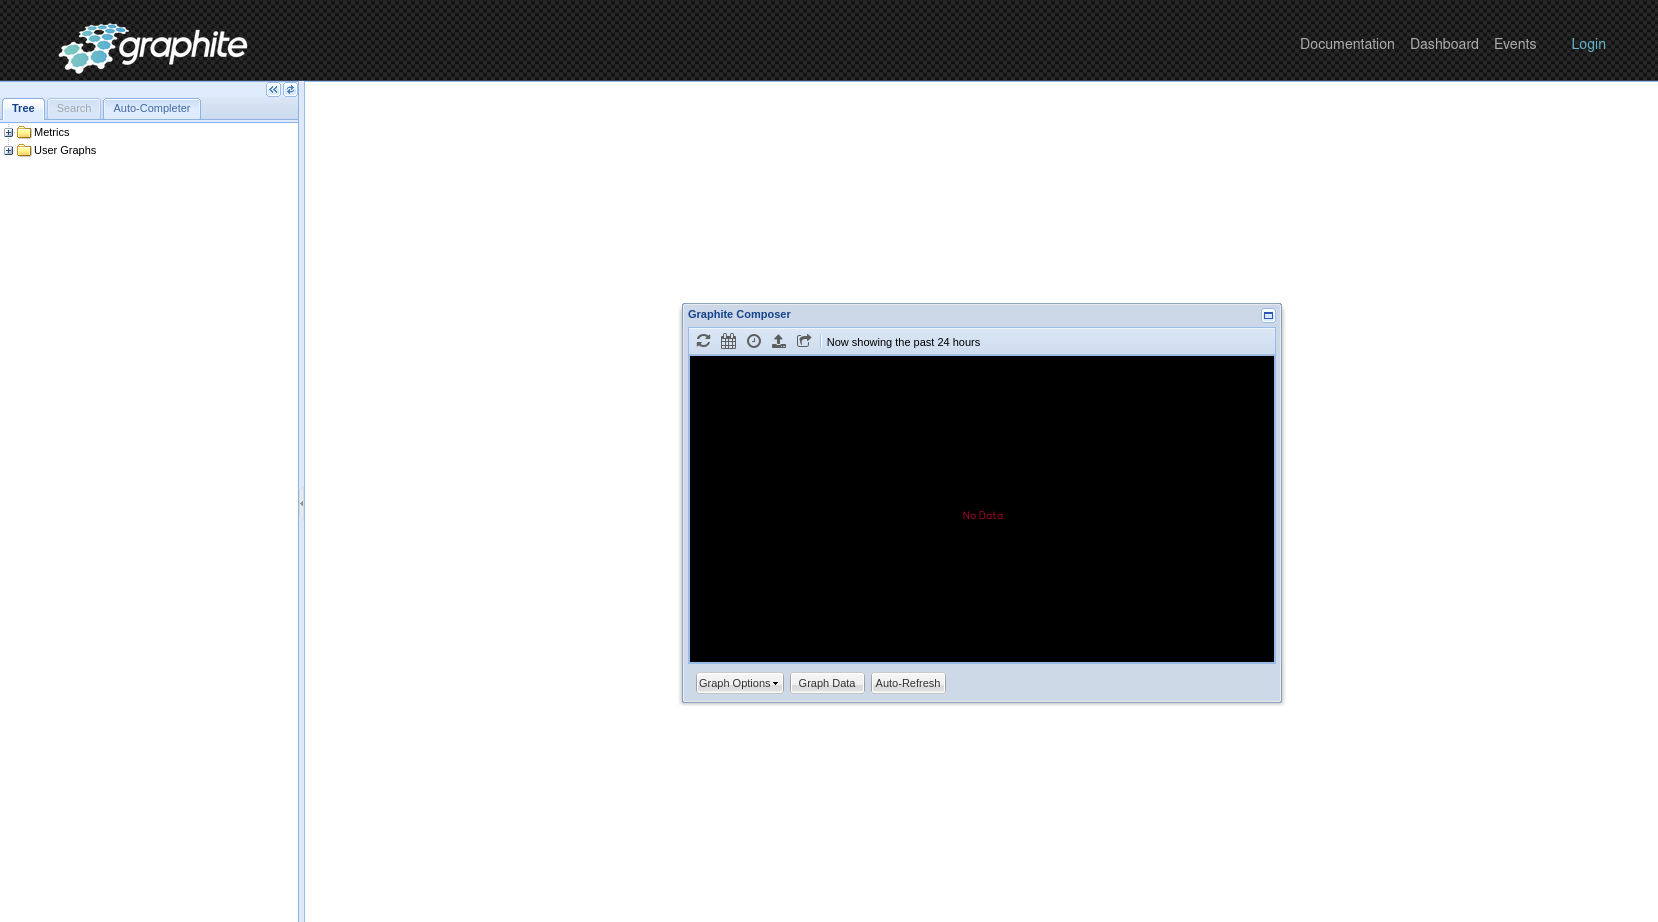 + +## Enable the Graphite exporting connector + +You're now ready to begin exporting Netdata metrics to Graphite. + +Begin by using `edit-config` to open the `exporting.conf` file. + +```bash +cd /etc/netdata # Replace this path with your Netdata config directory +sudo ./edit-config exporting.conf +``` + +If you haven't already, enable the exporting engine by setting `enabled` to `yes` in the `[exporting:global]` section. + +```conf +[exporting:global] + enabled = yes +``` + +Next, configure the connector. Find the `[graphite:my_graphite_instance]` example section and uncomment the line. +Replace `my_graphite_instance` with a name of your choice. Let's go with `[graphite:netdata]`. Set `enabled` to `yes` +and uncomment the line. Your configuration should now look like this: + +```conf +[graphite:netdata] + enabled = yes + # destination = localhost + # data source = average + # prefix = netdata + # hostname = my_hostname + # update every = 10 + # buffer on failures = 10 + # timeout ms = 20000 + # send names instead of ids = yes + # send charts matching = * + # send hosts matching = localhost * +``` + +Set the `destination` setting to `localhost:2003`. By default, the Docker image for Graphite listens on port `2003` for +incoming metrics. If you installed Graphite a different way, or tweaked the `docker run` command, you may need to change +the port accordingly. + +```conf +[graphite:netdata] + enabled = yes + destination = localhost:2003 + ... +``` + +We'll not worry about the rest of the settings for now. Restart the Agent using `sudo service netdata restart`, or the +appropriate method for your system, to spin up the exporting engine. + +## See and organize Netdata metrics in Graphite + +Head back to the Graphite interface again, then click on the **Dashboard** link to get started with Netdata's exported +metrics. You can also navigate directly to `http://NODE/dashboard`. + +Let's switch the interface to help you understand which metrics Netdata is exporting to Graphite. Click on **Dashboard** +and **Configure UI**, then choose the **Tree** option. Refresh your browser to change the UI. + +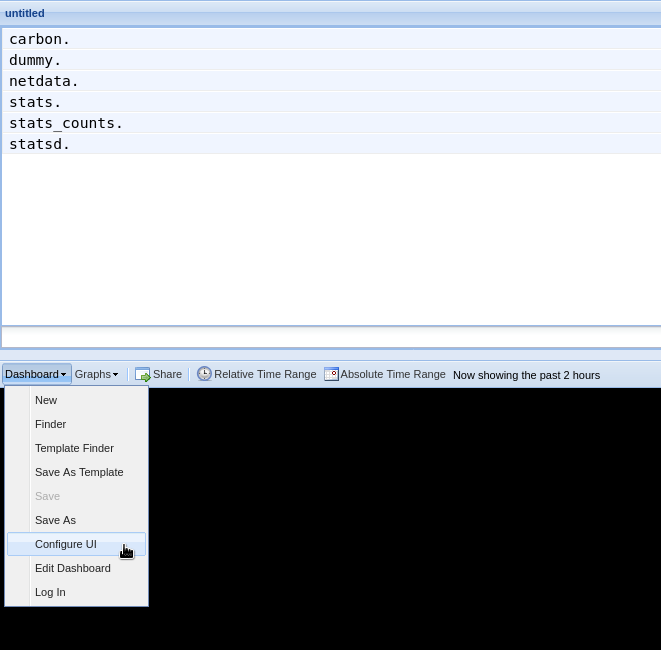 + +You should now see a tree of available contexts, including one that matches the hostname of the Agent exporting metrics. +In this example, the Agent's hostname is `arcturus`. + +Let's add some system CPU charts so you can monitor the long-term health of your system. Click through the tree to find +**hostname → system → cpu** metrics, then click on the **user** context. A chart with metrics from that context appears +in the dashboard. Add a few other system CPU charts to flesh things out. + +Next, let's combine one or two of these charts. Click and drag one chart onto the other, and wait until the green **Drop +to merge** dialog appears. Release to merge the charts. + +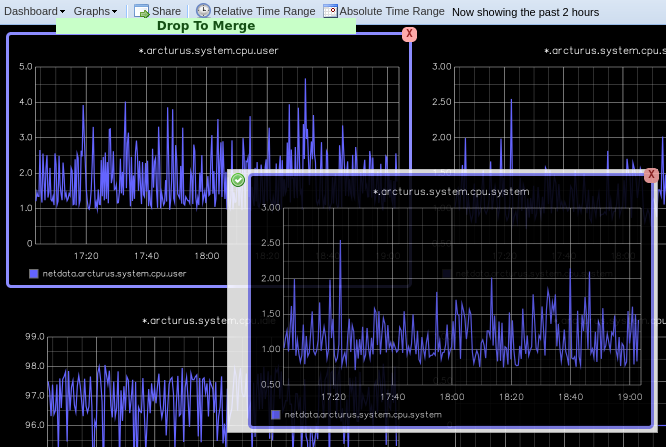 + +Finally, save your dashboard. Click **Dashboard**, then **Save As**, then choose a name. Your dashboard is now saved. + +Of course, this is just the beginning of the customization you can do with Graphite. You can change the time range, +share your dashboard with others, or use the composer to customize the size and appearance of specific charts. Learn +more about adding, modifying, and combining graphs in the [Graphite +docs](https://graphite.readthedocs.io/en/latest/dashboard.html). + +## Monitor the exporting engine + +As soon as the exporting engine begins, Netdata begins reporting metrics about the system's health and performance. + +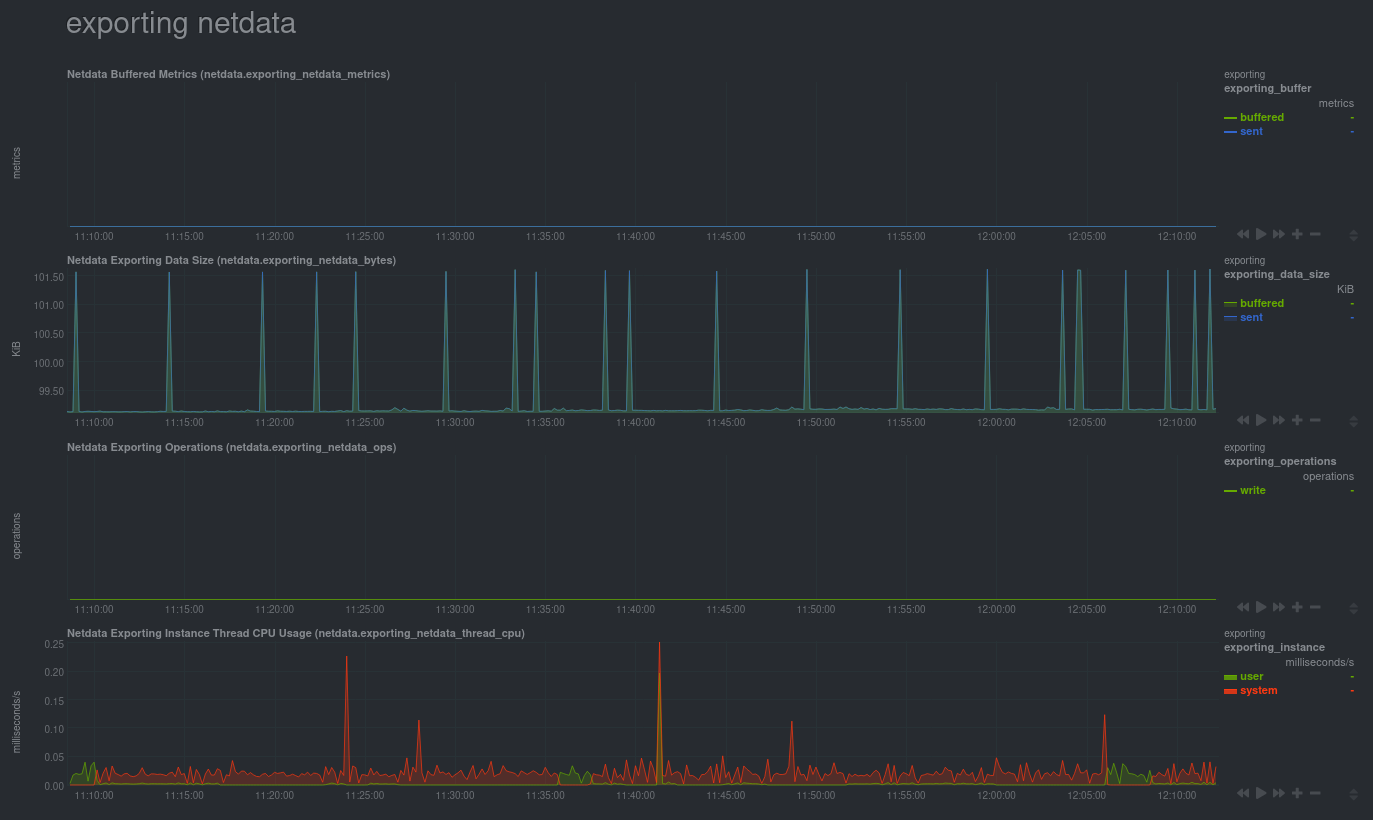 + +You can use these charts to verify that Netdata is properly exporting metrics to Graphite. You can even add these +exporting charts to your Graphite dashboard! + +### Add exporting charts to Netdata Cloud + +You can also show these exporting engine metrics on Netdata Cloud. If you don't have an account already, go [sign +in](https://app.netdata.cloud) and get started for free. If you need some help along the way, read the [get started with +Cloud guide](https://learn.netdata.cloud/docs/cloud/get-started). + +Add more metrics to the Nodes view by clicking on the **Add metric** button, then typing `exporting` into the context +field. Choose the exporting contexts you want to add, then click **Add**. You'll see these charts alongside any others +you've customized in Netdata Cloud. + +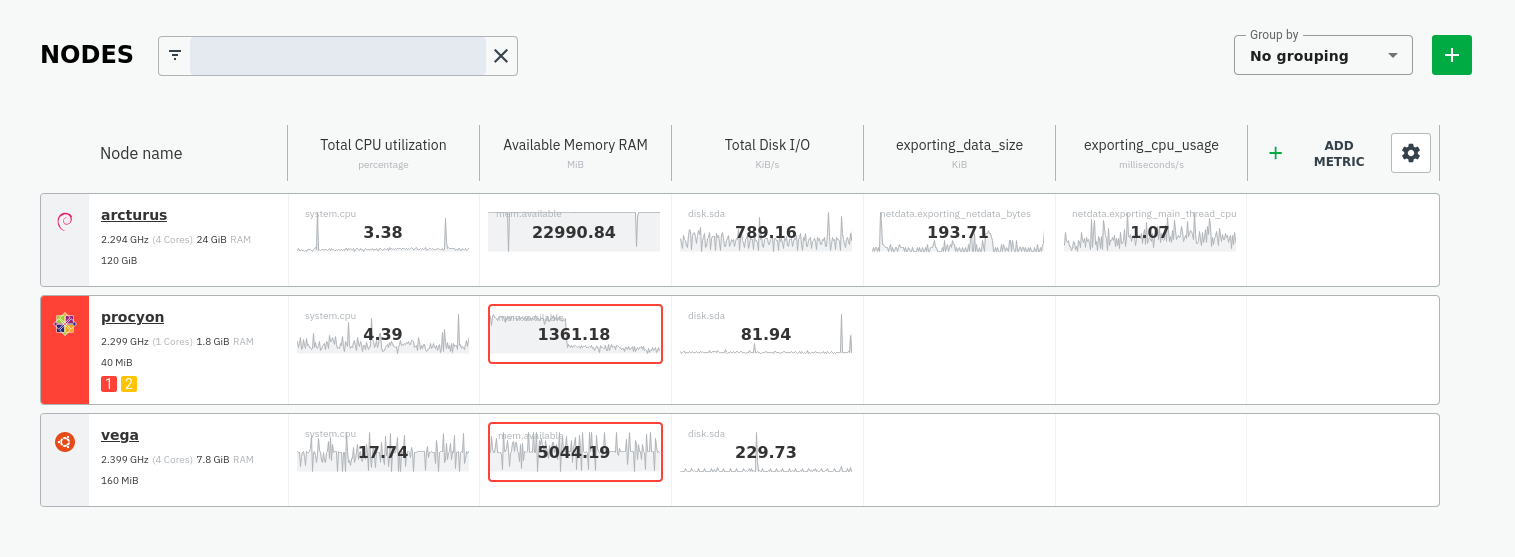 + +## What's next? + +What you do with your exported metrics is entirely up to you, but as you might have seen in the Graphite connector +configuration block, there are many other ways to tweak and customize which metrics you export to Graphite and how +often. + +For full details about each configuration option and what it does, see the [exporting reference +guide](/exporting/README.md). + +[](<>) |