
diff options
| author | Joel Hans <joel@netdata.cloud> | 2020-06-04 09:05:25 -0700 |
|---|---|---|
| committer | GitHub <noreply@github.com> | 2020-06-04 09:05:25 -0700 |
| commit | fecbb89d0c33e2bbe84aa14c0b3204cb60134218 (patch) | |
| tree | 40b7581657e2bf13c0f72646c7f5137b4770172e /docs | |
| parent | 78ca668e50d88670f8aaf4d2434e325f705f975c (diff) | |
Move/refactor docs to accomodate new Guides section on Learn (#9266)
* Move directories and change verbiage to guide
* Move health guides
* Quick fix to collectors quickstart
* Fix broken links
* Remove health/tutorials dir
* Fix links in collectors quickstart
* Fix links to go.d pages
Diffstat (limited to 'docs')
| -rw-r--r-- | docs/Performance.md | 4 | ||||
| -rw-r--r-- | docs/configuration-guide.md | 6 | ||||
| -rw-r--r-- | docs/contributing/style-guide.md | 2 | ||||
| -rw-r--r-- | docs/export/README.md | 6 | ||||
| -rw-r--r-- | docs/getting-started.md | 4 | ||||
| -rw-r--r-- | docs/guides/collect-apache-nginx-web-logs.md (renamed from docs/tutorials/collect-apache-nginx-web-logs.md) | 14 | ||||
| -rw-r--r-- | docs/guides/collect-unbound-metrics.md (renamed from docs/tutorials/collect-unbound-metrics.md) | 8 | ||||
| -rw-r--r-- | docs/guides/longer-metrics-storage.md (renamed from docs/tutorials/longer-metrics-storage.md) | 6 | ||||
| -rw-r--r-- | docs/guides/monitor-cockroachdb.md (renamed from docs/tutorials/monitor-cockroachdb.md) | 6 | ||||
| -rw-r--r-- | docs/guides/monitor-hadoop-cluster.md (renamed from docs/tutorials/monitor-hadoop-cluster.md) | 14 | ||||
| -rw-r--r-- | docs/guides/monitor/dimension-templates.md | 178 | ||||
| -rw-r--r-- | docs/guides/monitor/stop-notifications-alarms.md | 94 | ||||
| -rw-r--r-- | docs/guides/step-by-step/step-00.md (renamed from docs/step-by-step/step-00.md) | 20 | ||||
| -rw-r--r-- | docs/guides/step-by-step/step-01.md (renamed from docs/step-by-step/step-01.md) | 8 | ||||
| -rw-r--r-- | docs/guides/step-by-step/step-02.md (renamed from docs/step-by-step/step-02.md) | 12 | ||||
| -rw-r--r-- | docs/guides/step-by-step/step-03.md (renamed from docs/step-by-step/step-03.md) | 8 | ||||
| -rw-r--r-- | docs/guides/step-by-step/step-04.md (renamed from docs/step-by-step/step-04.md) | 18 | ||||
| -rw-r--r-- | docs/guides/step-by-step/step-05.md (renamed from docs/step-by-step/step-05.md) | 8 | ||||
| -rw-r--r-- | docs/guides/step-by-step/step-06.md (renamed from docs/step-by-step/step-06.md) | 8 | ||||
| -rw-r--r-- | docs/guides/step-by-step/step-07.md (renamed from docs/step-by-step/step-07.md) | 10 | ||||
| -rw-r--r-- | docs/guides/step-by-step/step-08.md (renamed from docs/step-by-step/step-08.md) | 14 | ||||
| -rw-r--r-- | docs/guides/step-by-step/step-09.md (renamed from docs/step-by-step/step-09.md) | 16 | ||||
| -rw-r--r-- | docs/guides/step-by-step/step-10.md (renamed from docs/step-by-step/step-10.md) | 18 | ||||
| -rw-r--r-- | docs/guides/step-by-step/step-99.md (renamed from docs/step-by-step/step-99.md) | 14 | ||||
| -rw-r--r-- | docs/guides/using-host-labels.md (renamed from docs/tutorials/using-host-labels.md) | 6 |
25 files changed, 384 insertions, 118 deletions
diff --git a/docs/Performance.md b/docs/Performance.md index ff416111b3..219bb6ba42 100644 --- a/docs/Performance.md +++ b/docs/Performance.md @@ -196,8 +196,8 @@ following settings in the `[global]` section of `netdata.conf`: # dbengine disk space = 256 ``` -See the [database engine documentation](/database/engine/README.md) or our [tutorial on metrics -retention](tutorials/longer-metrics-storage.md) for more details on lowering the database engine's memory requirements. +See the [database engine documentation](/database/engine/README.md) or our [guide on metrics +retention](/docs/guides/longer-metrics-storage.md) for more details on lowering the database engine's memory requirements. ### 6. Disable gzip compression of responses diff --git a/docs/configuration-guide.md b/docs/configuration-guide.md index c30175f04c..e9a6fdbe7e 100644 --- a/docs/configuration-guide.md +++ b/docs/configuration-guide.md @@ -63,8 +63,8 @@ it there. #### Increase the long-term metrics retention period Increase the values for the `page cache size` and `dbengine disk space` settings in the [`[global]` -section](/daemon/config/README.md#global-section-options) of `netdata.conf`. Read our tutorial on [increasing -long-term metrics storage](/docs/tutorials/longer-metrics-storage.md) and the [memory requirements for the database +section](/daemon/config/README.md#global-section-options) of `netdata.conf`. Read our guide on [increasing +long-term metrics storage](/docs/guides/longer-metrics-storage.md) and the [memory requirements for the database engine](/database/engine/README.md#memory-requirements). #### Reduce the data collection frequency @@ -198,7 +198,7 @@ Beginning with 1.20, Netdata accepts user-defined **host labels**. These labels labels]`. Read more about how these labels work and why they're an effective way to organize complex infrasturctures in our -tutorial: [Use host labels to organize systems, metrics, and alarms](/docs/tutorials/using-host-labels.md). +guide: [Use host labels to organize systems, metrics, and alarms](/docs/guides/using-host-labels.md). To define a label inside this section, some rules needs to be followed, or Netdata will reject the label. The following restrictions are applied for label names: diff --git a/docs/contributing/style-guide.md b/docs/contributing/style-guide.md index 7f0936c2ad..a4bec829a8 100644 --- a/docs/contributing/style-guide.md +++ b/docs/contributing/style-guide.md @@ -330,7 +330,7 @@ of the Agent repository (`/`). Links should also always end with the filename of Avoid relative links or traversing up directories using `../`. For example, if you want to link to our installation guide, you should link to `/packaging/installer/README.md`. To -reference the guide for increasing metrics storage, use `/docs/tutorials/longer-metrics-storage.md`. +reference the guide for increasing metrics storage, use `/docs/guides/longer-metrics-storage.md`. ### References to UI elements diff --git a/docs/export/README.md b/docs/export/README.md index 9702174865..bcc662250b 100644 --- a/docs/export/README.md +++ b/docs/export/README.md @@ -25,7 +25,7 @@ be applied to other connectors as well. > If you are migrating from the deprecated backends system, this quickstart will also help you update your configuration > to the new format. For the most part, the configurations are identical, but there are two exceptions. First, > `exporting.conf` uses a new `[<type>:<name>]` format for defining connector instances. Second, the `host tags` setting -> is deprecated. Instead, use [host labels](/docs/tutorials/using-host-labels.md) to tag exported metrics. +> is deprecated. Instead, use [host labels](/docs/guides/using-host-labels.md) to tag exported metrics. Open the `exporting.conf` file with `edit-config`. @@ -94,8 +94,8 @@ collected, you should start seeing data in your external database after only a f - [Exporting reference guide](/exporting/README.md) - [Backends (deprecated)](/backends/README.md) -- [Use host labels to organize systems, metrics, and alarms](/docs/tutorials/using-host-labels.md) +- [Use host labels to organize systems, metrics, and alarms](/docs/guides/using-host-labels.md) - [Database engine](/database/engine/README.md) -- [Change how long Netdata stores metrics (long-term storage)](/docs/tutorials/longer-metrics-storage.md) +- [Change how long Netdata stores metrics (long-term storage)](/docs/guides/longer-metrics-storage.md) [](<>) diff --git a/docs/getting-started.md b/docs/getting-started.md index 2993fb73e3..f599303ed0 100644 --- a/docs/getting-started.md +++ b/docs/getting-started.md @@ -15,7 +15,7 @@ The Agent can collect thousands of metrics in real-time and use its database for configuration, but there are some valuable things to know to get the most out of Netdata based on your needs. We'll skip right into some technical details, so if you're brand-new to monitoring the health and performance of systems -and applications, our [**step-by-step tutorial**](/docs/step-by-step/step-00.md) might be a better fit. +and applications, our [**step-by-step guide**](/docs/guides/step-by-step/step-00.md) might be a better fit. > If you haven't installed Netdata yet, visit the [installation instructions](/packaging/installer/README.md) for > details, including our one-liner script, which automatically installs Netdata on almost all Linux distributions. @@ -67,7 +67,7 @@ configuration keeps RAM usage low while allowing for long-term, on-disk metrics You can tweak this custom _database engine_ to store a much larger dataset than your system's available RAM, particularly if you allow Netdata to use slightly more RAM and disk space than the default configuration. -Read our guide on [changing how long Netdata stores metrics](/docs/tutorials/longer-metrics-storage.md) to learn more +Read our guide on [changing how long Netdata stores metrics](/docs/guides/longer-metrics-storage.md) to learn more and use our [database engine calculator](https://learn.netdata.cloud/docs/agent/database/calculator) to figure out the exact settings you'll need to store historical metrics right in the Agent's database. diff --git a/docs/tutorials/collect-apache-nginx-web-logs.md b/docs/guides/collect-apache-nginx-web-logs.md index 0f2eaaa3dc..6a32c8971d 100644 --- a/docs/tutorials/collect-apache-nginx-web-logs.md +++ b/docs/guides/collect-apache-nginx-web-logs.md @@ -1,8 +1,6 @@ <!-- ---- title: "Monitor Nginx or Apache web server log files with Netdata" -custom_edit_url: https://github.com/netdata/netdata/edit/master/docs/tutorials/collect-apache-nginx-web-logs.md ---- +custom_edit_url: https://github.com/netdata/netdata/edit/master/docs/guides/collect-apache-nginx-web-logs.md --> # Monitor Nginx or Apache web server log files with Netdata @@ -22,10 +20,10 @@ You can now use the [LTSV log format](http://ltsv.org/), track TLS and cipher us ever. In one test on a system with SSD storage, the collector consistently parsed the logs for 200,000 requests in 200ms, using ~30% of a single core. To learn more about these improvements, see our [v1.19 release post](https://blog.netdata.cloud/posts/release-1.19/). -The [go.d plugin](https://learn.netdata.cloud/docs/agent/collectors/go.d.plugin/modules/weblog/) is currently compatible with -[Nginx](https://nginx.org/en/) and [Apache](https://httpd.apache.org/). +The [go.d plugin](https://learn.netdata.cloud/docs/agent/collectors/go.d.plugin/modules/weblog/) is currently compatible +with [Nginx](https://nginx.org/en/) and [Apache](https://httpd.apache.org/). -This tutorial will walk you through using the new Go-based web log collector to turn the logs these web servers +This guide will walk you through using the new Go-based web log collector to turn the logs these web servers constantly write to into real-time insights into your infrastructure. ## Set up your web servers @@ -128,7 +126,7 @@ web server's access log and begin showing real-time charts! ### Custom log formats and fields The web log collector is capable of parsing custom Nginx and Apache log formats and presenting them as charts, but we'll -leave that topic for a separate tutorial. +leave that topic for a separate guide. We do have [extensive documentation](https://learn.netdata.cloud/docs/agent/collectors/go.d.plugin/modules/weblog/#custom-log-format) on how @@ -160,4 +158,4 @@ into powerful real-time tools for keeping your servers happy. Don't forget to give GitHub user [Wing924](https://github.com/Wing924) a big 👍 for his hard work in starting up the Go refactoring effort. -[](<>) +[](<>) diff --git a/docs/tutorials/collect-unbound-metrics.md b/docs/guides/collect-unbound-metrics.md index 410bda84ce..2994647452 100644 --- a/docs/tutorials/collect-unbound-metrics.md +++ b/docs/guides/collect-unbound-metrics.md @@ -1,9 +1,7 @@ <!-- ---- title: "Monitor Unbound DNS servers with Netdata" date: 2020-03-31 -custom_edit_url: https://github.com/netdata/netdata/edit/master/docs/tutorials/collect-unbound-metrics.md ---- +custom_edit_url: https://github.com/netdata/netdata/edit/master/docs/guides/collect-unbound-metrics.md --> # Monitor Unbound DNS servers with Netdata @@ -16,7 +14,7 @@ Unbound runs on FreeBSD, OpenBSD, NetBSD, macOS, Linux, and Windows, and support queries and answers are all encrypted with TLS. In theory, that should reduce the risk of eavesdropping or man-in-the-middle attacks when communicating to DNS servers. -This tutorial will show you how to collect dozens of essential metrics from your Unbound servers with minimal +This guide will show you how to collect dozens of essential metrics from your Unbound servers with minimal configuration. ## Set up your Unbound installation @@ -137,4 +135,4 @@ for improvement or refinement based on real-world use cases. Feel free to [file issue](https://github.com/netdata/netdata/issues/new?labels=bug%2C+needs+triage&template=bug_report.md) with your thoughts. -[](<>) +[](<>) diff --git a/docs/tutorials/longer-metrics-storage.md b/docs/guides/longer-metrics-storage.md index 40dad05fd1..5c542f427f 100644 --- a/docs/tutorials/longer-metrics-storage.md +++ b/docs/guides/longer-metrics-storage.md @@ -1,7 +1,7 @@ <!-- title: "Change how long Netdata stores metrics" description: "With a single configuration change, the Netdata Agent can store days, weeks, or months of metrics at its famous per-second granularity." -custom_edit_url: https://github.com/netdata/netdata/edit/master/docs/tutorials/longer-metrics-storage.md +custom_edit_url: https://github.com/netdata/netdata/edit/master/docs/guides/longer-metrics-storage.md --> # Change how long Netdata stores metrics @@ -13,7 +13,7 @@ Many people think Netdata can only store about an hour's worth of real-time metr more. With the right settings, Netdata is quite capable of efficiently storing hours or days worth of historical, per-second metrics without having to rely on an [exporting engine](/exporting/README.md). -This tutorial gives two options for configuring Netdata to store more metrics. **We recommend the default [database +This guide gives two options for configuring Netdata to store more metrics. **We recommend the default [database engine](#using-the-database-engine)**, but you can stick with or switch to the round-robin database if you prefer. Let's get started. @@ -155,4 +155,4 @@ charts](/web/README.md#using-charts). And if you'd now like to reduce Netdata's resource usage, view our [performance guide](/docs/Performance.md) for our best practices on optimization. -[](<>) +[](<>) diff --git a/docs/tutorials/monitor-cockroachdb.md b/docs/guides/monitor-cockroachdb.md index 43d9cf2c65..fd0e7db643 100644 --- a/docs/tutorials/monitor-cockroachdb.md +++ b/docs/guides/monitor-cockroachdb.md @@ -1,8 +1,6 @@ <!-- ---- title: "Monitor CockroachDB metrics with Netdata" -custom_edit_url: https://github.com/netdata/netdata/edit/master/docs/tutorials/monitor-cockroachdb.md ---- +custom_edit_url: https://github.com/netdata/netdata/edit/master/docs/guides/monitor-cockroachdb.md --> # Monitor CockroachDB metrics with Netdata @@ -134,3 +132,5 @@ Also, be sure to check out these useful resources: docs](https://www.cockroachlabs.com/docs/stable/monitoring-and-alerting.html#prometheus-endpoint) - [Monitor CockroachDB with Prometheus](https://www.cockroachlabs.com/docs/stable/monitor-cockroachdb-with-prometheus.html) + +[](<>) diff --git a/docs/tutorials/monitor-hadoop-cluster.md b/docs/guides/monitor-hadoop-cluster.md index 70fe9e4f13..17901f2815 100644 --- a/docs/tutorials/monitor-hadoop-cluster.md +++ b/docs/guides/monitor-hadoop-cluster.md @@ -1,8 +1,6 @@ <!-- ---- title: "Monitor a Hadoop cluster with Netdata" -custom_edit_url: https://github.com/netdata/netdata/edit/master/docs/tutorials/monitor-hadoop-cluster.md ---- +custom_edit_url: https://github.com/netdata/netdata/edit/master/docs/guides/monitor-hadoop-cluster.md --> # Monitor a Hadoop cluster with Netdata @@ -17,16 +15,16 @@ implementations. Netdata comes with built-in and pre-configured support for monitoring both HDFS and Zookeeper. -This tutorial assumes you have a Hadoop cluster, with HDFS and Zookeeper, running already. If you don't, please follow +This guide assumes you have a Hadoop cluster, with HDFS and Zookeeper, running already. If you don't, please follow the [official Hadoop instructions](http://hadoop.apache.org/docs/stable/hadoop-project-dist/hadoop-common/SingleCluster.html) or an alternative, like the guide available from [DigitalOcean](https://www.digitalocean.com/community/tutorials/how-to-install-hadoop-in-stand-alone-mode-on-ubuntu-18-04). -For more specifics on the collection modules used in this tutorial, read the respective pages in our documentation: +For more specifics on the collection modules used in this guide, read the respective pages in our documentation: -- [HDFS](/collectors/go.d.plugin/modules/hdfs/README.md) -- [Zookeeper](/collectors/go.d.plugin/modules/zookeeper/README.md) +- [HDFS](https://learn.netdata.cloud/docs/agent/collectors/go.d.plugin/modules/hdfs) +- [Zookeeper](https://learn.netdata.cloud/docs/agent/collectors/go.d.plugin/modules/zookeeper) ## Set up your HDFS and Zookeeper installations @@ -203,4 +201,4 @@ issue](https://github.com/netdata/netdata/issues/new?labels=bug%2C+needs+triage& file](https://github.com/netdata/go.d.plugin/blob/master/config/go.d/zookeeper.conf) to understand how to configure global options or per-job options, timeouts, TLS certificates, and more. -[](<>) +[](<>) diff --git a/docs/guides/monitor/dimension-templates.md b/docs/guides/monitor/dimension-templates.md new file mode 100644 index 0000000000..5fe3ae9632 --- /dev/null +++ b/docs/guides/monitor/dimension-templates.md @@ -0,0 +1,178 @@ +<!-- +--- +title: "Use dimension templates to create dynamic alarms" +custom_edit_url: https://github.com/netdata/netdata/edit/master/docs/monitor/health/dimension-templates.md +--- +--> + +# Use dimension templates to create dynamic alarms + +Your ability to monitor the health of your systems and applications relies on your ability to create and maintain +the best set of alarms for your particular needs. + +In v1.18 of Netdata, we introduced **dimension templates** for alarms, which simplifies the process of writing [alarm +entities](/health/REFERENCE.md#health-entity-reference) for charts with many dimensions. + +Dimension templates can condense many individual entities into one—no more copy-pasting one entity and changing the +`alarm`/`template` and `lookup` lines for each dimension you'd like to monitor. + +They are, however, an advanced health monitoring feature. For more basic instructions on creating your first alarm, +check out our [health monitoring documentation](/health/README.md), which also includes +[examples](/health/REFERENCE.md#example-alarms). + +## The fundamentals of `foreach` + +Our dimension templates update creates a new `foreach` parameter to the existing [`lookup` +line](/health/REFERENCE.md#alarm-line-lookup). This is where the magic happens. + +You use the `foreach` parameter to specify which dimensions you want to monitor with this single alarm. You can separate +them with a comma (`,`) or a pipe (`|`). You can also use a [Netdata simple pattern](/libnetdata/simple_pattern/README.md) +to create many alarms with a regex-like syntax. + +The `foreach` parameter _has_ to be the last parameter in your `lookup` line, and if you have both `of` and `foreach` in +the same `lookup` line, Netdata will ignore the `of` parameter and use `foreach` instead. + +Let's get into some examples so you can see how the new parameter works. + +> ⚠️ The following entities are examples to showcase the functionality and syntax of dimension templates. They are not +> meant to be run as-is on production systems. + +## Condensing entities with `foreach` + +Let's say you want to monitor the `system`, `user`, and `nice` dimensions in your system's overall CPU utilization. +Before dimension templates, you would need the following three entities: + +```yaml + alarm: cpu_system + on: system.cpu +lookup: average -10m percentage of system + every: 1m + warn: $this > 50 + crit: $this > 80 + + alarm: cpu_user + on: system.cpu +lookup: average -10m percentage of user + every: 1m + warn: $this > 50 + crit: $this > 80 + + alarm: cpu_nice + on: system.cpu +lookup: average -10m percentage of nice + every: 1m + warn: $this > 50 + crit: $this > 80 +``` + +With dimension templates, you can condense these into a single alarm. Take note of the `alarm` and `lookup` lines. + +```yaml + alarm: cpu_template + on: system.cpu +lookup: average -10m percentage foreach system,user,nice + every: 1m + warn: $this > 50 + crit: $this > 80 +``` + +The `alarm` line specifies the naming scheme Netdata will use. You can use whatever naming scheme you'd like, with `.` +and `_` being the only allowed symbols. + +The `lookup` line has changed from `of` to `foreach`, and we're now passing three dimensions. + +In this example, Netdata will create three alarms with the names `cpu_template_system`, `cpu_template_user`, and +`cpu_template_nice`. Every minute, each alarm will use the same database query to calculate the average CPU usage for +the `system`, `user`, and `nice` dimensions over the last 10 minutes and send out alarms if necessary. + +You can find these three alarms active by clicking on the **Alarms** button in the top navigation, and then clicking on +the **All** tab and scrolling to the **system - cpu** collapsible section. + +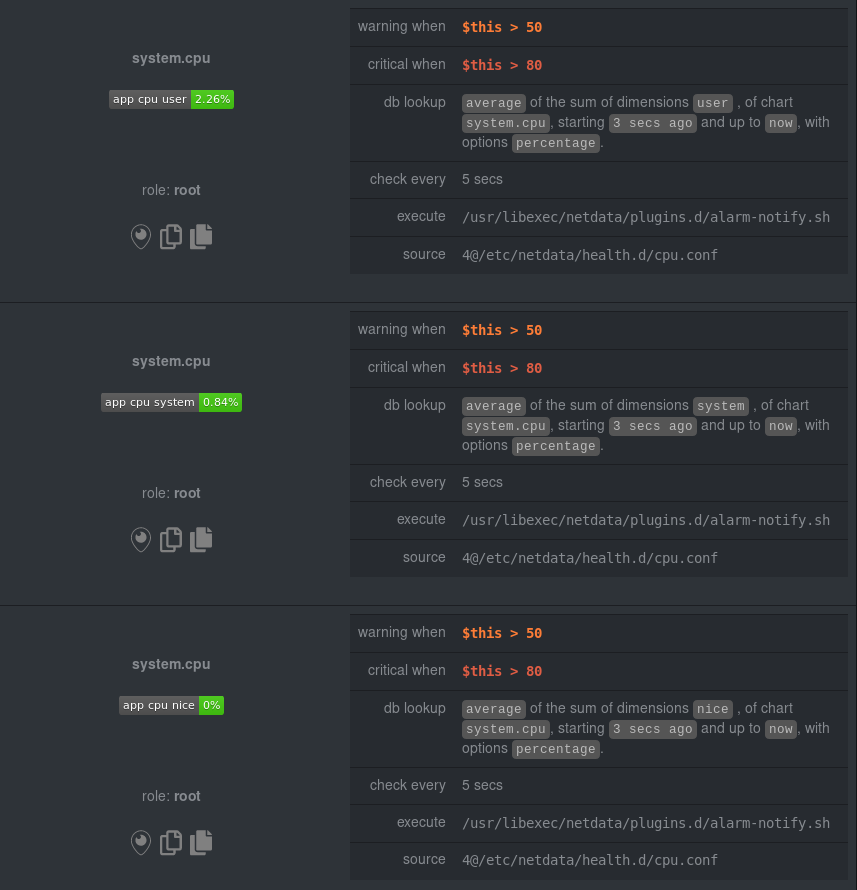 + +Let's look at some other examples of how `foreach` works so you can best apply it in your configurations. + +### Using a Netdata simple pattern in `foreach` + +In the last example, we used `foreach system,user,nice` to create three distinct alarms using dimension templates. But +what if you want to quickly create alarms for _all_ the dimensions of a given chart? + +Use a [simple pattern](/libnetdata/simple_pattern/README.md)! One example of a simple pattern is a single wildcard +(`*`). + +Instead of monitoring system CPU usage, let's monitor per-application CPU usage using the `apps.cpu` chart. Passing a +wildcard as the simple pattern tells Netdata to create a separate alarm for _every_ process on your system: + +```yaml + alarm: app_cpu + on: apps.cpu +lookup: average -10m percentage foreach * + every: 1m + warn: $this > 50 + crit: $this > 80 +``` + +This entity will now create alarms for every dimension in the `apps.cpu` chart. Given that most `apps.cpu` charts have +10 or more dimensions, using the wildcard ensures you catch every CPU-hogging process. + +To learn more about how to use simple patterns with dimension templates, see our [simple patterns +documentation](/libnetdata/simple_pattern/README.md). + +## Using `foreach` with alarm templates + +Dimension templates also work with [alarm templates](/health/REFERENCE.md#alarm-line-alarm-or-template). Alarm +templates help you create alarms for all the charts with a given context—for example, all the cores of your system's +CPU. + +By combining the two, you can create dozens of individual alarms with a single template entity. Here's how you would +create alarms for the `system`, `user`, and `nice` dimensions for every chart in the `cpu.cpu` context—or, in other +words, every CPU core. + +```yaml +template: cpu_template + on: cpu.cpu + lookup: average -10m percentage foreach system,user,nice + every: 1m + warn: $this > 50 + crit: $this > 80 +``` + +On a system with a 6-core, 12-thread Ryzen 5 1600 CPU, this one entity creates alarms on the following charts and +dimensions: + +- `cpu.cpu0` + - `cpu_template_user` + - `cpu_template_system` + - `cpu_template_nice` +- `cpu.cpu1` + - `cpu_template_user` + - `cpu_template_system` + - `cpu_template_nice` +- `cpu.cpu2` + - `cpu_template_user` + - `cpu_template_system` + - `cpu_template_nice` +- ... +- `cpu.cpu11` + - `cpu_template_user` + - `cpu_template_system` + - `cpu_template_nice` + +And how just a few of those dimension template-generated alarms look like in the Netdata dashboard. + +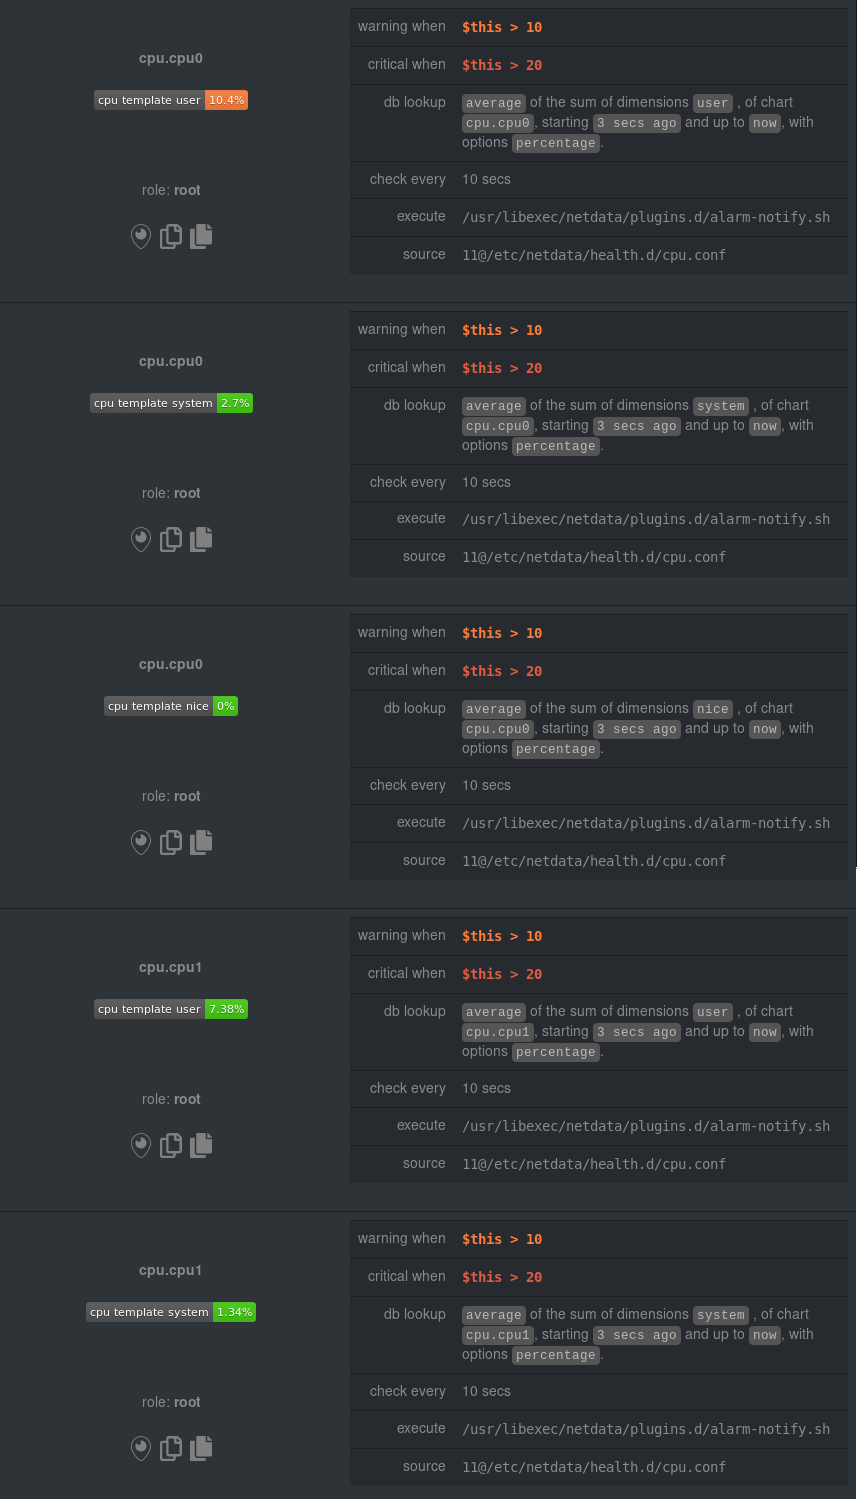 + +All in all, this single entity creates 36 individual alarms. Much easier than writing 36 separate entities in your +health configuration files! + +## What's next? + +We hope you're excited about the possibilities of using dimension templates! Maybe they'll inspire you to build new +alarms that will help you better monitor the health of your systems. + +Or, at the very least, simplify your configuration files. + +For information about other advanced features in Netdata's health monitoring toolkit, check out our [health +documentation](/health/README.md). And if you have some cool alarms you built using dimension templates, + +[](<>) diff --git a/docs/guides/monitor/stop-notifications-alarms.md b/docs/guides/monitor/stop-notifications-alarms.md new file mode 100644 index 0000000000..197b6b0ebf --- /dev/null +++ b/docs/guides/monitor/stop-notifications-alarms.md @@ -0,0 +1,94 @@ +<!-- +--- +title: "Stop notifications for individual alarms" +custom_edit_url: https://github.com/netdata/netdata/edit/master/docs/guides/monitor/stop-notifications-alarms.md +--- +--> + +# Stop notifications for individual alarms + +In this short tutorial, you'll learn how to stop notifications for individual alarms in Netdata's health +monitoring system. We also refer to this process as _silencing_ the alarm. + +Why silence alarms? We designed Netdata's pre-configured alarms for production systems, so they might not be +relevant if you run Netdata on your laptop or a small virtual server. If they're not helpful, they can be a distraction +to real issues with health and performance. + +Silencing individual alarms is an excellent solution for situations where you're not interested in seeing a specific +alarm but don't want to disable a [notification system](/health/notifications/README.md) entirely. + +## Find the alarm configuration file + +To silence an alarm, you need to know where to find its configuration file. + +Let's use the `system.cpu` chart as an example. It's the first chart you'll see on most Netdata dashboards. + +To figure out which file you need to edit, open up Netdata's dashboard and, click the **Alarms** button at the top +of the dashboard, followed by clicking on the **All** tab. + +In this example, we're looking for the `system - cpu` entity, which, when opened, looks like this: + +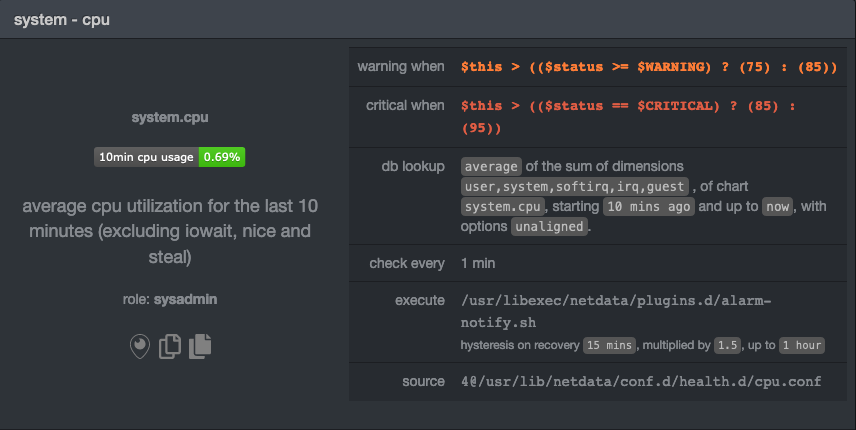 + +In the `source` row, you see that this chart is getting its configuration from +`4@/usr/lib/netdata/conf.d/health.d/cpu.conf`. The relevant part of begins at `health.d`: `health.d/cpu.conf`. That's +the file you need to edit if you want to silence this alarm. + +For more information about editing or referencing health configuration files on your system, see the [health +quickstart](/health/QUICKSTART.md#edit-health-configuration-files). + +## Edit the file to enable silencing + +To edit `health.d/cpu.conf`, use `edit-config` from inside of your Netdata configuration directory. + +```bash +cd /etc/netdata/ # Replace with your Netdata configuration directory, if not /etc/netdata/ +./edit-config health.d/cpu.conf +``` + +> You may need to use `sudo` or another method of elevating your privileges. + +The beginning of the file looks like this: + +```yaml +template: 10min_cpu_usage + on: system.cpu + os: linux + hosts: * + lookup: average -10m unaligned of user,system,softirq,irq,guest + units: % + every: 1m + warn: $this > (($status >= $WARNING) ? (75) : (85)) + crit: $this > (($status == $CRITICAL) ? (85) : (95)) + delay: down 15m multiplier 1.5 max 1h + info: average cpu utilization for the last 10 minutes (excluding iowait, nice and steal) + to: sysadmin +``` + +To silence this alarm, change `sysadmin` to `silent`. + +```yaml + to: silent +``` + +Use `killall -USR2 netdata` to reload your health configuration and ensure you get no more notifications about that +alarm. + +You can add `to: silence` to any alarm you'd rather not bother you with notifications. + +## What's next? + +You should now know the fundamentals behind silencing any individual alarm in Netdata. + +To learn about _all_ of Netdata's health configuration possibilities, visit the [health reference +guide](/health/REFERENCE.md), or check out other [tutorials on health monitoring](/health/README.md#tutorials). + +Or, take better control over how you get notified about alarms via the [notification +system](/health/notifications/README.md). + +You can also use Netdata's [Health Management API](/web/api/health/README.md#health-management-api) to control health +checks and notifications while Netdata runs. With this API, you can disable health checks during a maintenance window or +backup process, for example. + +[![analytics](https://www.google-analytics.com/collect?v=1&aip=1&t=pageview&_s=1&ds=github&dr=https%3A%2F%2Fgithub.com%2Fnetdata%2Fnetdata&dl=https%3A%2F%2Fmy-netdata.io%2Fgithub%2Fdocs%2Fguides%2Fmonitor% |