
diff options
| author | Fotis Voutsas <fotis@netdata.cloud> | 2023-04-20 19:04:08 +0300 |
|---|---|---|
| committer | GitHub <noreply@github.com> | 2023-04-20 09:04:08 -0700 |
| commit | fadd2d81a9948016777fb4fcc0c5cd2ee16ac46e (patch) | |
| tree | f2b2343d0778db0d64b42a3007dae03acdef6396 /docs | |
| parent | 103f00c5cc1fc34e07ead0ba71823d94580d106e (diff) | |
Replace "XYZ view" with "XYZ tab" in documentation files (#14930)
* replace 'XYZ view' with 'XYZ tab' in documentation files
* Update README.md
Diffstat (limited to 'docs')
| -rw-r--r-- | docs/category-overview-pages/secure-nodes.md | 2 | ||||
| -rw-r--r-- | docs/cloud/runtime-troubleshooting-with-functions.md | 15 | ||||
| -rw-r--r-- | docs/cloud/visualize/dashboards.md | 14 | ||||
| -rw-r--r-- | docs/cloud/visualize/interact-new-charts.md | 4 | ||||
| -rw-r--r-- | docs/cloud/visualize/nodes.md | 8 | ||||
| -rw-r--r-- | docs/cloud/war-rooms.md | 2 | ||||
| -rw-r--r-- | docs/glossary.md | 2 | ||||
| -rw-r--r-- | docs/monitor/view-active-alarms.md | 2 | ||||
| -rw-r--r-- | docs/quickstart/infrastructure.md | 10 | ||||
| -rw-r--r-- | docs/visualize/overview-infrastructure.md | 8 |
10 files changed, 22 insertions, 45 deletions
diff --git a/docs/category-overview-pages/secure-nodes.md b/docs/category-overview-pages/secure-nodes.md index 7f35393019..33e205f00f 100644 --- a/docs/category-overview-pages/secure-nodes.md +++ b/docs/category-overview-pages/secure-nodes.md @@ -44,7 +44,7 @@ that align with your goals and your organization's standards. ## Disable the local dashboard
This is the _recommended method for those who have connected their nodes to Netdata Cloud_ and prefer viewing real-time
-metrics using the War Room Overview, Nodes view, and Cloud dashboards.
+metrics using the War Room Overview, Nodes tab, and Cloud dashboards.
You can disable the local dashboard (and API) but retain the encrypted Agent-Cloud link
([ACLK](https://github.com/netdata/netdata/blob/master/aclk/README.md)) that
diff --git a/docs/cloud/runtime-troubleshooting-with-functions.md b/docs/cloud/runtime-troubleshooting-with-functions.md index c3c0c2a028..839b8c9ed4 100644 --- a/docs/cloud/runtime-troubleshooting-with-functions.md +++ b/docs/cloud/runtime-troubleshooting-with-functions.md @@ -1,14 +1,3 @@ -<!-- -title: "Run-time troubleshooting with Functions" -sidebar_label: "Run-time troubleshooting with Functions" -custom_edit_url: "https://github.com/netdata/netdata/blob/master/docs/cloud/runtime-troubleshooting-with-functions.md" -learn_status: "Published" -sidebar_position: "4" -learn_topic_type: "Tasks" -learn_rel_path: "Operations" -learn_docs_purpose: "Instructions on how to use Functions" ---> - # Run-time troubleshooting with Functions Netdata Functions feature allows you to execute on-demand a pre-defined routine on a node where a Netdata Agent is running. These routines are exposed by a given collector. @@ -21,14 +10,14 @@ The following is required to be able to run Functions from Netdata Cloud. * At least one of the nodes claimed to your Space should be on a Netdata agent version higher than `v1.37.1` * Ensure that the node has the collector that exposes the function you want enabled ([see current available functions](https://github.com/netdata/netdata/blob/master/docs/cloud/netdata-functions.md#what-functions-are-currently-available)) -### Execute a function (from functions view) +### Execute a function (from the Functions tab) 1. From the right-hand bar select the **Function** you want to run 2. Still on the right-hand bar select the **Node** where you want to run it 3. Results will be displayed in the central area for you to interact with 4. Additional filtering capabilities, depending on the function, should be available on right-hand bar -### Execute a function (from Nodes view) +### Execute a function (from the Nodes tab) 1. Click on the functions icon for a node that has this active 2. You are directed to the **Functions** tab diff --git a/docs/cloud/visualize/dashboards.md b/docs/cloud/visualize/dashboards.md index 7be3ca9662..a9376db175 100644 --- a/docs/cloud/visualize/dashboards.md +++ b/docs/cloud/visualize/dashboards.md @@ -1,15 +1,3 @@ -<!-- -title: "Build new dashboards" -description: >- - "Design new dashboards that target your infrastructure's unique needs and share them with your team for - targeted visual anomaly detection or incident response." -custom_edit_url: "https://github.com/netdata/netdata/blob/master/docs/cloud/visualize/dashboards.md" -sidebar_label: "Build new dashboards" -learn_status: "Published" -learn_topic_type: "Tasks" -learn_rel_path: "Operations/Visualizations" ---> - # Build new dashboards With Netdata Cloud, you can build new dashboards that target your infrastructure's unique needs. Put key metrics from @@ -82,7 +70,7 @@ dashboards. ## Pin dashboards Click on the **Pin** button in any dashboard to put those charts into a separate panel at the bottom of the screen. You -can now navigate through Netdata Cloud freely, individual Cloud dashboards, the Nodes view, different War Rooms, or even +can now navigate through Netdata Cloud freely, individual Cloud dashboards, the Nodes tab, different War Rooms, or even different Spaces, and have those valuable metrics follow you. Pinning dashboards helps you correlate potentially related charts across your infrastructure, no matter how you diff --git a/docs/cloud/visualize/interact-new-charts.md b/docs/cloud/visualize/interact-new-charts.md index 7db811e292..4c6c2ebf5b 100644 --- a/docs/cloud/visualize/interact-new-charts.md +++ b/docs/cloud/visualize/interact-new-charts.md @@ -20,7 +20,7 @@ These charts provide a lot of useful information, so that you can: - Get the chart status and possible errors. On top, reload functionality These charts are available on Netdata Cloud's -[Overview tab](https://github.com/netdata/netdata/blob/master/docs/cloud/visualize/overview.md), Single Node view and +[Overview tab](https://github.com/netdata/netdata/blob/master/docs/cloud/visualize/overview.md), Single Node tab and on your [Custom Dashboards](https://github.com/netdata/netdata/blob/master/docs/cloud/visualize/dashboards.md). Some of the features listed below are also available on the simpler charts that are available on each agent's user interface. @@ -29,7 +29,7 @@ Some of the features listed below are also available on the simpler charts that Have a look at the can see the overall look and feel of the charts for both with a composite chart from the [Overview tab](https://github.com/netdata/netdata/blob/master/docs/cloud/visualize/overview.md) and a simple chart -from the single node view: +from the Single Node tab: <img width="678" alt="image" src="https://user-images.githubusercontent.com/43294513/220913360-f3f2ac06-b715-4e99-a933-f3bcb776636f.png"/> diff --git a/docs/cloud/visualize/nodes.md b/docs/cloud/visualize/nodes.md index 4a8949a1d1..4160166f7d 100644 --- a/docs/cloud/visualize/nodes.md +++ b/docs/cloud/visualize/nodes.md @@ -1,12 +1,12 @@ -# Nodes view +# Nodes tab -The Nodes view lets you see and customize key metrics from any number of Agent-monitored nodes and seamlessly navigate +The Nodes tab lets you see and customize key metrics from any number of Agent-monitored nodes and seamlessly navigate to any node's dashboard for troubleshooting performance issues or anomalies using Netdata's highly-granular metrics. -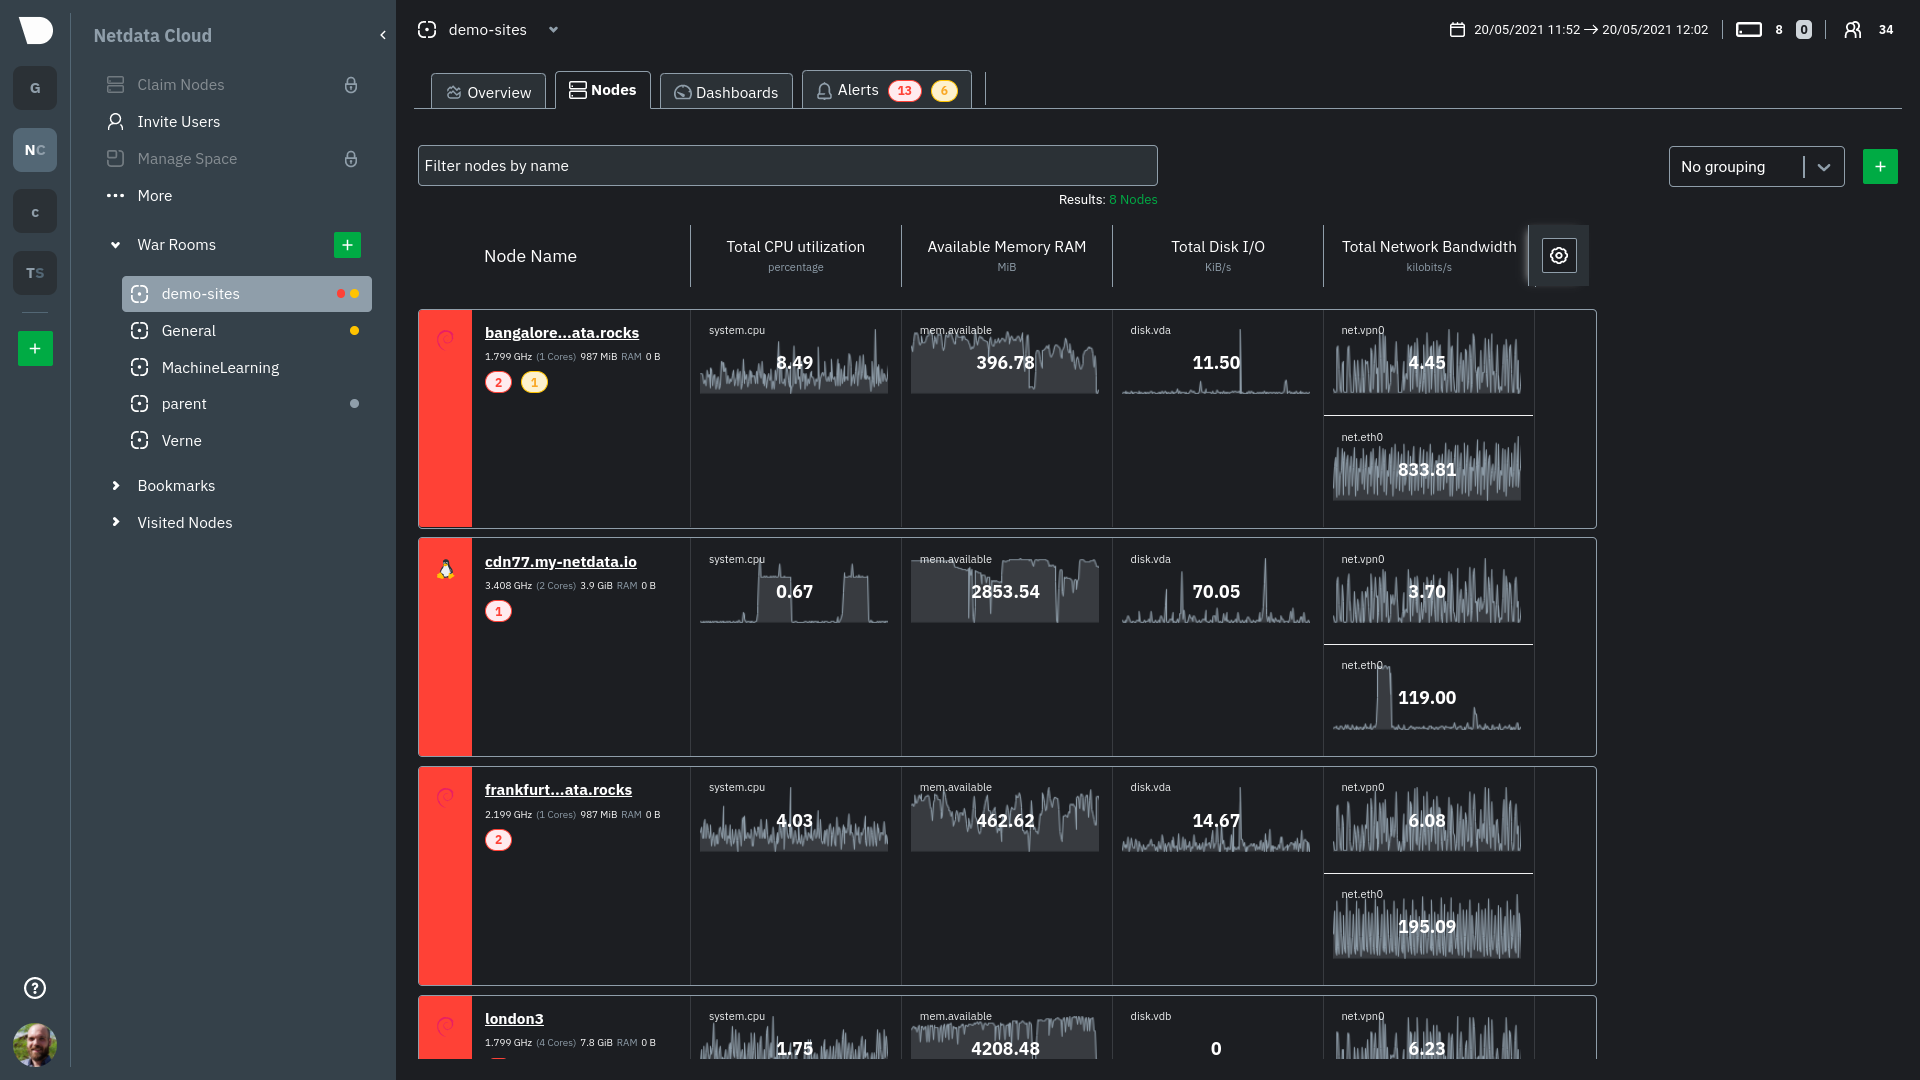 -Each War Room's Nodes view is populated based on the nodes you added to that specific War Room. Each node occupies a +Each War Room's Nodes tab is populated based on the nodes you added to that specific War Room. Each node occupies a single row, first featuring that node's alarm status (yellow for warnings, red for critical alarms) and operating system, some essential information about the node, followed by columns of user-defined key metrics represented in real-time charts. diff --git a/docs/cloud/war-rooms.md b/docs/cloud/war-rooms.md index c10efcfa12..c599fd5b4d 100644 --- a/docs/cloud/war-rooms.md +++ b/docs/cloud/war-rooms.md @@ -52,7 +52,7 @@ Click on the gear icon of the War Room's name in the top of the page to do that. ### More actions -To **view or remove nodes** in a War Room, click on **Nodes view**. To remove a node from the current War Room, click on +To **view or remove nodes** in a War Room, click on the **Nodes tab**. To remove a node from the current War Room, click on the **🗑** icon. > ### Info diff --git a/docs/glossary.md b/docs/glossary.md index 56d38c9357..fe61cc1119 100644 --- a/docs/glossary.md +++ b/docs/glossary.md @@ -91,7 +91,7 @@ Use the alphabatized list below to find the answer to your single-term questions - [**Kickstart** or **Kickstart Script**](https://github.com/netdata/netdata/blob/master/packaging/installer/methods/kickstart.md): An automatic one-line installation script named 'kickstart.sh' that works on all Linux distributions and macOS. -- [**Kubernetes Dashboard** or **Kubernetes View**](https://github.com/netdata/netdata/blob/master/docs/cloud/visualize/kubernetes.md): Netdata Cloud features enhanced visualizations for the resource utilization of Kubernetes (k8s) clusters, embedded in the default Overview dashboard. +- [**Kubernetes Dashboard** or **Kubernetes Tab**](https://github.com/netdata/netdata/blob/master/docs/cloud/visualize/kubernetes.md): Netdata Cloud features enhanced visualizations for the resource utilization of Kubernetes (k8s) clusters, embedded in the default Overview dashboard. ## M diff --git a/docs/monitor/view-active-alarms.md b/docs/monitor/view-active-alarms.md index f317946a50..cc6a2d3a15 100644 --- a/docs/monitor/view-active-alarms.md +++ b/docs/monitor/view-active-alarms.md @@ -9,7 +9,7 @@ You can always sort the table by a certain column by clicking on the name of tha ## Filter alerts -From this view, you can also filter alerts with the right hand bar. More specifically you can filter: +From this tab, you can also filter alerts with the right hand bar. More specifically you can filter: - Alert status - Filter based on the status of the alerts (e.g. Warning, Critical) diff --git a/docs/quickstart/infrastructure.md b/docs/quickstart/infrastructure.md index 3de0fcd078..c76948f60c 100644 --- a/docs/quickstart/infrastructure.md +++ b/docs/quickstart/infrastructure.md @@ -68,10 +68,10 @@ These tabs can be separated into "static", meaning they are by default presented #### Static tabs -- The default view for any War Room is the [Home tab](https://github.com/netdata/netdata/blob/master/docs/cloud/visualize/overview.md#home), which gives you an overview of this Space. +- The default tab for any War Room is the [Home tab](https://github.com/netdata/netdata/blob/master/docs/cloud/visualize/overview.md#home), which gives you an overview of this Space. Here you can see the number of Nodes claimed, data retention statics, users by role, alerts and more. -- The second and most important view is the [Overview tab](https://github.com/netdata/netdata/blob/master/docs/cloud/visualize/overview.md#overview-and-single-node-view) which uses composite charts to display real-time metrics from every available node in a given War Room. +- The second and most important tab is the [Overview tab](https://github.com/netdata/netdata/blob/master/docs/cloud/visualize/overview.md#overview-and-single-node-view) which uses composite charts to display real-time metrics from every available node in a given War Room. - The [Nodes tab](https://github.com/netdata/netdata/blob/master/docs/cloud/visualize/nodes.md) gives you the ability to see the status (offline or online), host details, alarm status and also a short overview of some key metrics from all your nodes at a glance. @@ -95,7 +95,7 @@ Tabs can be rearranged with drag-and-drop or closed with the **X** button. Open ### Drill down to specific nodes -Both the Overview and Nodes view offer easy access to **single-node dashboards** for targeted analysis. You can use +Both the Overview and the Nodes tab offer easy access to **single-node dashboards** for targeted analysis. You can use single-node dashboards in Netdata Cloud to drill down on specific issues, scrub backward in time to investigate historical data, and see like metrics presented meaningfully to help you troubleshoot performance problems. @@ -173,7 +173,7 @@ collect from across your infrastructure with Netdata. title="Dashboards"> <BoxList> <BoxListItemRegexLink to="[](https://github.com/netdata/netdata/blob/master/docs/cloud/visualize/overview.md)" title="Overview" /> - <BoxListItemRegexLink to="[](https://github.com/netdata/netdata/blob/master/docs/cloud/visualize/nodes.md)" title="Nodes view" /> + <BoxListItemRegexLink to="[](https://github.com/netdata/netdata/blob/master/docs/cloud/visualize/nodes.md)" title="Nodes tab" /> <BoxListItemRegexLink to="[](https://github.com/netdata/netdata/blob/master/docs/cloud/visualize/kubernetes.md)" title="Kubernetes" /> <BoxListItemRegexLink to="[](https://github.com/netdata/netdata/blob/master/docs/cloud/visualize/dashboards.md)" title="Create new dashboards" /> </BoxList> @@ -208,7 +208,7 @@ collect from across your infrastructure with Netdata. - [War Rooms](https://github.com/netdata/netdata/blob/master/docs/cloud/war-rooms.md) - Dashboards - [Overview](https://github.com/netdata/netdata/blob/master/docs/cloud/visualize/overview.md) - - [Nodes view](https://github.com/netdata/netdata/blob/master/docs/cloud/visualize/nodes.md) + - [Nodes tab](https://github.com/netdata/netdata/blob/master/docs/cloud/visualize/nodes.md) - [Kubernetes](https://github.com/netdata/netdata/blob/master/docs/cloud/visualize/kubernetes.md) - [Create new dashboards](https://github.com/netdata/netdata/blob/master/docs/cloud/visualize/dashboards.md) - Alerts and notifications diff --git a/docs/visualize/overview-infrastructure.md b/docs/visualize/overview-infrastructure.md index b120716d85..c09e9aeae1 100644 --- a/docs/visualize/overview-infrastructure.md +++ b/docs/visualize/overview-infrastructure.md @@ -87,9 +87,9 @@ investigate historical data, and see like metrics presented meaningfully to help All of the familiar [interactions](https://github.com/netdata/netdata/blob/master/docs/cloud/visualize/interact-new-charts.md) are available, as is adding any chart to a [new dashboard](https://github.com/netdata/netdata/blob/master/docs/cloud/visualize/dashboards.md). -## Nodes view +## Nodes tab -You can also use the **Nodes view** to monitor the health status and user-configurable key metrics from multiple nodes -in a War Room. Read the [Nodes view doc](https://github.com/netdata/netdata/blob/master/docs/cloud/visualize/nodes.md) for details. +You can also use the **Nodes tab** to monitor the health status and user-configurable key metrics from multiple nodes +in a War Room. Read the [Nodes tab documentation](https://github.com/netdata/netdata/blob/master/docs/cloud/visualize/nodes.md) for details. -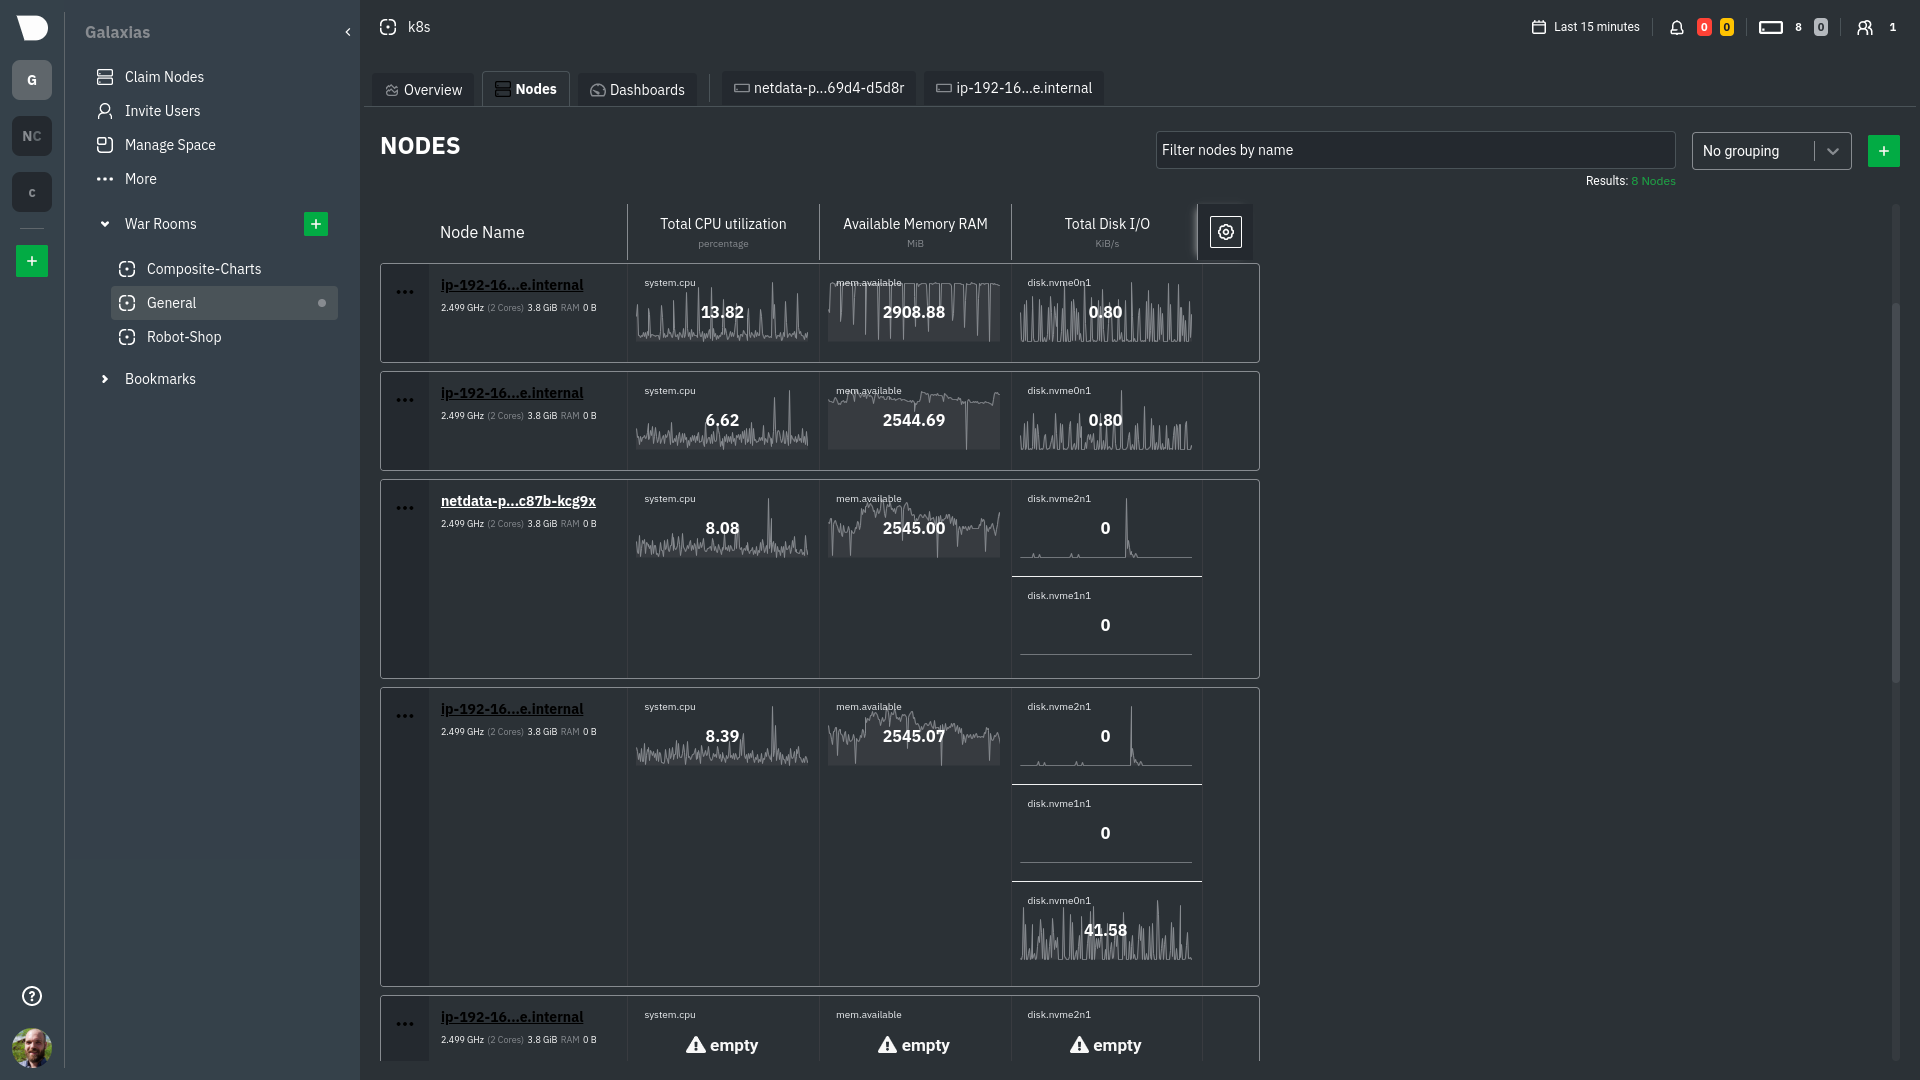 + |