
diff options
| author | Fotis Voutsas <fotis@netdata.cloud> | 2023-03-29 22:15:53 +0300 |
|---|---|---|
| committer | GitHub <noreply@github.com> | 2023-03-29 12:15:53 -0700 |
| commit | 5c3084911c5df62320e284b2db777a817a6e2fe2 (patch) | |
| tree | d76d9e3e08b97abefa397419b13ef0facdcb3307 /docs | |
| parent | 26147864270c1ad2ee5b8d05e82ef2fdaf6d366e (diff) | |
First batch of adding descriptions to the documentation (#14825)
* first batch of adding descriptions to the documentation, and fixing inconsistencies inside the files
* Apply suggestions from code review
Co-authored-by: Chris Akritidis <43294513+cakrit@users.noreply.github.com>
* Update docs/cloud/visualize/overview.md
* Replace view with tab in overview.md
---------
Co-authored-by: Chris Akritidis <43294513+cakrit@users.noreply.github.com>
Diffstat (limited to 'docs')
| -rw-r--r-- | docs/cloud/manage/invite-your-team.md | 2 | ||||
| -rw-r--r-- | docs/cloud/manage/plans.md | 42 | ||||
| -rw-r--r-- | docs/cloud/manage/sign-in.md | 19 | ||||
| -rw-r--r-- | docs/cloud/manage/view-plan-billing.md | 71 | ||||
| -rw-r--r-- | docs/cloud/spaces.md | 9 | ||||
| -rw-r--r-- | docs/cloud/visualize/interact-new-charts.md | 2 | ||||
| -rw-r--r-- | docs/cloud/visualize/node-filter.md | 8 | ||||
| -rw-r--r-- | docs/cloud/visualize/overview.md | 34 | ||||
| -rw-r--r-- | docs/cloud/war-rooms.md | 5 | ||||
| -rw-r--r-- | docs/dashboard/visualization-date-and-time-controls.md | 6 | ||||
| -rw-r--r-- | docs/getting-started/introduction.md | 59 | ||||
| -rw-r--r-- | docs/guides/troubleshoot/troubleshooting-agent-with-cloud-connection.md | 12 | ||||
| -rw-r--r-- | docs/monitor/view-active-alarms.md | 6 | ||||
| -rw-r--r-- | docs/quickstart/infrastructure.md | 10 | ||||
| -rw-r--r-- | docs/store/distributed-data-architecture.md | 7 |
15 files changed, 137 insertions, 155 deletions
diff --git a/docs/cloud/manage/invite-your-team.md b/docs/cloud/manage/invite-your-team.md index ebe0b8df51..da2d51f7f4 100644 --- a/docs/cloud/manage/invite-your-team.md +++ b/docs/cloud/manage/invite-your-team.md @@ -1,5 +1,7 @@ # Invite your team +Invite your entire SRE, DevOPs, or ITOps team to Netdata Cloud, to give everyone insights into your infrastructure from a single pane of glass. + Invite new users to your Space by clicking on **Invite Users** in the [Space](https://github.com/netdata/netdata/blob/master/docs/cloud/spaces.md) management area. diff --git a/docs/cloud/manage/plans.md b/docs/cloud/manage/plans.md index f61a803426..af01adc604 100644 --- a/docs/cloud/manage/plans.md +++ b/docs/cloud/manage/plans.md @@ -1,22 +1,13 @@ -<!-- -title: "Netdata Plans" -sidebar_label: "Netdata Plans" -custom_edit_url: "https://github.com/netdata/netdata/blob/master/docs/cloud/manage/plans.md" -sidebar_position: "1000" -learn_status: "Published" -learn_topic_type: "Concepts" -learn_rel_path: "Concepts" -learn_docs_purpose: "Explain what are Netdata Plans" ---> - # Netdata Plans +This page will guide you through the differences between the Community, Pro, Business and Enterprise plans. + At Netdata, we believe in providing free and unrestricted access to high-quality monitoring solutions, and our commitment to this principle will not change. We offer our free SaaS offering - what we call **Community plan** - and Open Source Agent, which features unlimited nodes and users, unlimited metrics, and retention, providing real-time, high-fidelity, out-of-the-box infrastructure monitoring for packaged applications, containers, and operating systems. We also provide paid subscriptions that designed to provide additional features and capabilities for businesses that need tighter and customizable integration of the free monitoring solution to their processes. These are divided into three different plans: **Pro**, **Business**, and **Enterprise**. Each plan will offers a different set of features and capabilities to meet the needs of businesses of different sizes and with different monitoring requirements. :::note -To not disrupt current users space's access rights we will be keeping their current plan as the **Early Bird** plan. The reason for this is to allow users to +To not disrupt current users space's access rights we will be keeping their current plan as the **Early Bird** plan. The reason for this is to allow users to keep using the legacy **Member** role with the exact same permissions as it has currently. If you move from the **Early Bird** plan to a paid plan, you will not be able to return to the **Early Bird** plan again. The **Community** free plan will always be available to you, but it does not allow @@ -29,22 +20,26 @@ you to invite or change users using the Member role. See more details on our [ro The plan is an attribute that is directly attached to your space(s) and that dictates what capabilities and customizations you have on your space. If you have different spaces you can have different Netdata plans on them. This gives you flexibility to chose what is more adequate for your needs on each of your spaces. Netdata Cloud plans, with the exception of Community, work as subscriptions and overall consist of two pricing components: + * A flat fee component, that is a price per space, and * An on-demand metered component, that is related to your usage of Netdata which directly links to the [number of nodes you have running](#running-nodes-and-billing) Netdata provides two billing frequency options: + * Monthly - Pay as you go, where we charge both the flat fee and the on-demand component every month * Yearly - Annual prepayment, where we charge upfront the flat fee and committed amount related to your estimated usage of Netdata (more details [here](#committed-nodes)) -For more details on the plans and subscription conditions please check https://netdata.cloud/pricing. +For more details on the plans and subscription conditions please check <https://netdata.cloud/pricing>. #### Running nodes and billing The only dynamic variable we consider for billing is the number of concurrently running nodes or agents. We only charge you for your active running nodes, so we don't count: + * offline nodes * stale nodes, nodes that are available to query through a Netdata parent agent but are not actively connecting metrics at the moment To ensure we don't overcharge you due to sporadic spikes throughout a month or even at a certain point in a day we are: + * Calculate a daily P90 figure for your running nodes. To achieve that, we take a daily snapshot of your running nodes, and using the node state change events (live, offline) we guarantee that a daily P90 figure is calculated to remove any daily spikes * On top of the above, we do a running P90 calculation from the start to the end of your billing cycle. Even if you have an yearly billing frequency we keep a monthly subscription linked to that to identify any potential overage over your [committed nodes](#committed-nodes). @@ -63,13 +58,14 @@ If, for a given month, your usage is over these committed nodes we will charge t It is ok to change your mind. We allow to change your plan, billing frequency or adjust the committed nodes, on yearly plans, at any time. To achieve this you will need to: + * Move to the Community plan, where we will cancel the current subscription and: - * Issue a credit to you for the unused period, in case you are on a **yearly plan** - * Charge you only for the current used period and issue a credit for the unused period related to the flat fee, in case you are on a **monthly plan** + * Issue a credit to you for the unused period, in case you are on a **yearly plan** + * Charge you only for the current used period and issue a credit for the unused period related to the flat fee, in case you are on a **monthly plan** * Select the new subscription with the change that you want > ⚠️ On a move to Community (cancellation of an active subscription), please note that you will have all your notification methods configurations active **for a period of 24 hours**. -> After that, any notification methods unavailable in your new plan at that time will be automatically disabled. You can always re-enable them once you move to a paid plan that includes them. +> After that, any notification methods unavailable in your new plan at that time will be automatically disabled. You can always re-enable them once you move to a paid plan that includes them. > ⚠️ Any credit given to you will be available to use on future paid subscriptions with us. It will be available until the the **end of the following year**. @@ -86,7 +82,7 @@ Depending on the plan associated to your space you will have different roles ava | **Troubleshooters**<p>Users with this role can use Netdata to troubleshoot, not manage entities.</p><p>They can access any War Room in the Space.</p> | - | :heavy_check_mark: | :heavy_check_mark: | - | | **Observers**<p>Users with this role can only view data in specific War Rooms.</p>💡 Ideal for restricting your customer's access to their own dedicated rooms.<p></p> | - | - | :heavy_check_mark: | - | | **Billing**<p>Users with this role can handle billing options and invoices.</p> | - | - | :heavy_check_mark: | - | -| **Member** ⚠️ Legacy role<p>Users with this role can create War Rooms and invite other Members.</p><p>They can only see the War Rooms they belong to and all Nodes in the All Nodes room.</p>| - | - | - | :heavy_check_mark: | +| **Member** ⚠️ Legacy role<p>Users with this role can create War Rooms and invite other Members.</p><p>They can only see the War Rooms they belong to and all Nodes in the All Nodes room.</p>| - | - | - | :heavy_check_mark: | For more details check the documentation under [Role-Based Access model](https://github.com/netdata/netdata/blob/master/docs/cloud/manage/role-based-access.md). @@ -105,6 +101,7 @@ For more details check the documentation under [Events feed](https://github.com/ ##### Notification integrations The plan on your space will determine what type of notifications methods will be available to you: + * **Community** - Email and Discord * **Pro** - Email, Discord and webhook * **Business** - Unlimited, this includes Slack, PagerDuty, etc. @@ -114,11 +111,12 @@ For mode details check the documentation under [Alert Notifications](https://git ### Related Topics #### **Related Concepts** -- [Spaces](https://github.com/netdata/netdata/blob/master/docs/cloud/spaces.md) -- [Alert Notifications](https://github.com/netdata/netdata/blob/master/docs/cloud/alerts-notifications/notifications.md) -- [Events feed](https://github.com/netdata/netdata/blob/master/docs/cloud/insights/events-feed.md) -- [Role-Based Access model](https://github.com/netdata/netdata/blob/master/docs/cloud/manage/role-based-access.md) +* [Spaces](https://github.com/netdata/netdata/blob/master/docs/cloud/spaces.md) +* [Alert Notifications](https://github.com/netdata/netdata/blob/master/docs/cloud/alerts-notifications/notifications.md) +* [Events feed](https://github.com/netdata/netdata/blob/master/docs/cloud/insights/events-feed.md) +* [Role-Based Access model](https://github.com/netdata/netdata/blob/master/docs/cloud/manage/role-based-access.md) #### Related Tasks -- [View Plan & Billing](https://github.com/netdata/netdata/blob/master/docs/cloud/manage/view-plan-billing.md) + +* [View Plan & Billing](https://github.com/netdata/netdata/blob/master/docs/cloud/manage/view-plan-billing.md) diff --git a/docs/cloud/manage/sign-in.md b/docs/cloud/manage/sign-in.md index f1fdd75066..96275f5733 100644 --- a/docs/cloud/manage/sign-in.md +++ b/docs/cloud/manage/sign-in.md @@ -1,4 +1,6 @@ -# Sign in with email, Google, or GitHub +# Sign in to Netdata + +This page explains how to sign in to Netdata with your email, Google account, or GitHub account, and provides some tips if you're having trouble signing in. You can [sign in to Netdata](https://app.netdata.cloud/sign-in?cloudRoute=spaces?utm_source=docs&utm_content=sign_in_button_first_section) through one of three methods: email, Google, or GitHub. Email uses a time-sensitive link that authenticates your browser, and Google/GitHub both use OAuth to associate your email address @@ -7,7 +9,6 @@ with a Netdata Cloud account. No matter the method, your Netdata Cloud account is based around your email address. Netdata Cloud does not store passwords. - ## Email To sign in with email, visit [Netdata Cloud](https://app.netdata.cloud/sign-in?cloudRoute=spaces?utm_source=docs&utm_content=sign_in_button_email_section), enter your email address, and click @@ -31,22 +32,22 @@ quickstart](https://github.com/netdata/netdata/blob/master/packaging/installer/R ### Troubleshooting -You should receive your sign in email in less than a minute. The subject is **Verify your email!** for new sign-ups, **Sign in to Netdata** for sign ins. +You should receive your sign in email in less than a minute. The subject is **Verify your email!** for new sign-ups, **Sign in to Netdata** for sign ins. The sender is `no-reply@netdata.cloud` via `sendgrid.net`. If you don't see the email, try the following: -- Check your spam folder. -- In Gmail, check the **Updates** category. -- Check [Netdata Cloud status](https://status.netdata.cloud) for ongoing issues with our infrastructure. -- Request another sign in email via the [sign in page](https://app.netdata.cloud/sign-in?cloudRoute=spaces?utm_source=docs&utm_content=sign_in_button_troubleshooting_section). +- Check your spam folder. +- In Gmail, check the **Updates** category. +- Check [Netdata Cloud status](https://status.netdata.cloud) for ongoing issues with our infrastructure. +- Request another sign in email via the [sign in page](https://app.netdata.cloud/sign-in?cloudRoute=spaces?utm_source=docs&utm_content=sign_in_button_troubleshooting_section). You may also want to add `no-reply@netdata.cloud` to your address book or contacts list, especially if you're using a public email service, such as Gmail. You may also want to whitelist/allowlist either the specific email or the entire `netdata.cloud` domain. In some cases, temporary issues with your mail server or email account may result in your email address being added to a Bounce list by Sendgrid. -If you are added to that list, no Netdata cloud email can reach you, including alarm notifications. Let us know in Discord that you have trouble receiving +If you are added to that list, no Netdata cloud email can reach you, including alarm notifications. Let us know in Discord that you have trouble receiving any email from us and someone will ask you to provide your email address privately, so we can check if you are on the Bounce list. ## Google and GitHub OAuth @@ -56,7 +57,7 @@ receives via OAuth. To sign in with Google or GitHub OAuth, visit [Netdata Cloud](https://app.netdata.cloud/sign-in?cloudRoute=spaces?utm_source=docs&utm_content=sign_in_button_google_github_section) and click the **Continue with Google/GitHub** or button. Enter your Google/GitHub username and your password. Complete two-factor -authentication if you or your organization has it enabled. +authentication if you or your organization has it enabled. You are then signed in to Netdata Cloud or directed to the new-user onboarding if you have not signed up previously. diff --git a/docs/cloud/manage/view-plan-billing.md b/docs/cloud/manage/view-plan-billing.md index 5d4c50a7e1..d29f93f988 100644 --- a/docs/cloud/manage/view-plan-billing.md +++ b/docs/cloud/manage/view-plan-billing.md @@ -1,79 +1,81 @@ # View Plan & Billing From the Cloud interface, you can view and manage your space's plan and billing settings, and see the space's usage in terms of running nodes. + To view and manage some specific settings, related to billing options and invoices, you'll be redirected to our billing provider Customer Portal. -#### Prerequisites +## Prerequisites To see your plan and billing setting you need: - A Cloud account - Access to the space as an Administrator or Billing user -#### Steps +## Steps 1. Click on the **Space settings** cog (located above your profile icon) 1. Click on the **Plan & Billing** tab 1. On this page you will be presented with information on your current plan, billing settings, and usage information: 1. At the top of the page you will see: - * **Credit** amount which refers to any amount you have available to use on future invoices or subscription changes (https://github.com/netdata/netdata/blob/master/docs/cloud/manage/plans.md#plan-changes-and-credit-balance) - this is displayed once you have had an active paid subscription with us - * **Billing email** the email that was specified to be linked to tha plan subscription. This is where invoices, payment, and subscription-related notifications will be sent. - * **Billing options and Invoices** is the link to our billing provider Customer Portal where you will be able to: - * See the current subscription. There will always be 2 subscriptions active for the two pricing components mentioned on [Netdata Plans documentation page](https://github.com/netdata/netdata/blob/master/docs/cloud/manage/plans.md#plans) - * Change directly the payment method associated to current subscriptions - * View, add, delete or change your default payment methods - * View or change or Billing information: - * Billing email - * Address - * Phone number - * Tax ID - * View your invoice history + - **Credit** amount which refers to any amount you have available to use on future invoices or subscription changes (<https://github.com/netdata/netdata/blob/master/docs/cloud/manage/plans.md#plan-changes-and-credit-balance>) - this is displayed once you have had an active paid subscription with us + - **Billing email** the email that was specified to be linked to tha plan subscription. This is where invoices, payment, and subscription-related notifications will be sent. + - **Billing options and Invoices** is the link to our billing provider Customer Portal where you will be able to: + - See the current subscription. There will always be 2 subscriptions active for the two pricing components mentioned on [Netdata Plans documentation page](https://github.com/netdata/netdata/blob/master/docs/cloud/manage/plans.md#plans) + - Change directly the payment method associated to current subscriptions + - View, add, delete or change your default payment methods + - View or change or Billing information: + - Billing email + - Address + - Phone number + - Tax ID + - View your invoice history 1. At the middle, you'll see details on your current plan as well as means to: - * Upgrade or cancel your plan - * View full plan details page + - Upgrade or cancel your plan + - View full plan details page 1. At the bottom, you will find your Usage chart that displays: - * Daily count - The weighted 90th percentile of the live node count during the day, taking time as the weight. If you have 30 live nodes throughout the day + - Daily count - The weighted 90th percentile of the live node count during the day, taking time as the weight. If you have 30 live nodes throughout the day except for a two hour peak of 44 live nodes, the daily value is 31. - * Period count: The 90th percentile of the daily counts for this period up to the date. The last value for the period is used as the number of nodes for the bill for that period. See more details in [running nodes and billing](https://github.com/netdata/netdata/blob/master/docs/cloud/manage/plans.md#running-nodes-and-billing) (only applicable if you are on a paid plan subscription) - * Committed nodes: The number of nodes committed to in the yearly plan. In case the period count is higher than the number of committed nodes, the difference is billed as overage. + - Period count: The 90th percentile of the daily counts for this period up to the date. The last value for the period is used as the number of nodes for the bill for that period. See more details in [running nodes and billing](https://github.com/netdata/netdata/blob/master/docs/cloud/manage/plans.md#running-nodes-and-billing) (only applicable if you are on a paid plan subscription) + - Committed nodes: The number of nodes committed to in the yearly plan. In case the period count is higher than the number of committed nodes, the difference is billed as overage. > ⚠️ At the moment, any changes to an active paid plan, upgrades, change billing frequency or committed nodes, will be a manual two-setup flow: +> > 1. cancel your current subscription - move you to the Community plan > 2. chose the plan with the intended changes > > This is a temporary process that we aim to sort out soon so that it will effortless for you to do any of these actions. -### FAQ +## FAQ -#### 1. What Payment Methods are accepted? +### 1. What Payment Methods are accepted? -You can easily pay online via most major Credit/Debit Cards. More payment options are expected to become available in the near future. +You can easily pay online via most major Credit/Debit Cards. More payment options are expected to become available in the near future. -#### 2. What happens if a renewal payment fails? +### 2. What happens if a renewal payment fails? -After an initial failed payment, we will attempt to process your payment every week for the next 15 days. After three failed attempts your Space will be moved to the **Community** plan (free forever). +After an initial failed payment, we will attempt to process your payment every week for the next 15 days. After three failed attempts your Space will be moved to the **Community** plan (free forever). For the next 24 hours, you will be able to use all your current notification method configurations. After 24 hours, any of the notification method configurations that aren't available on your space's plan will be automatically disabled. Cancellation might affect users in your Space. Please check what roles are available on the [Community plan](https://github.com/netdata/netdata/blob/master/docs/cloud/manage/plans.md#areas-impacted-by-plans). Users with unavailable roles on the Community plan will immediately have restricted access to the Space. - #### 3. Which currencies do you support? +### 3. Which currencies do you support? We currently accept payments only in US Dollars (USD). We currently have plans to also accept payments in Euros (EUR), but do not currently have an estimate for when such support will be available. -#### 4. Can I get a refund? How? +### 4. Can I get a refund? How? Payments for Netdata subscriptions are refundable **only** if you cancel your subscription within 14 days of purchase. The refund will be credited to the Credit/Debit Card used for making the purchase. To request a refund, please email us at [billing@netdata.cloud](mailto:billing@netdata.cloud). - -#### 5. How do I cancel my paid Plan? -Your annual or monthly Netdata Subscription plan will automatically renew until you cancel it. You can cancel your paid plan at any time by clicking ‘Cancel Plan’ from the **Plan & Billing** section under settings. You can also cancel your paid Plan by clicking the _Select_ button under **Community** plan in the **Plan & Billing** Section under Settings. +### 5. How do I cancel my paid Plan? + +Your annual or monthly Netdata Subscription plan will automatically renew until you cancel it. You can cancel your paid plan at any time by clicking ‘Cancel Plan’ from the **Plan & Billing** section under settings. You can also cancel your paid Plan by clicking the _Select_ button under **Community** plan in the **Plan & Billing** Section under Settings. -#### 6. How can I access my Invoices/Receipts after I paid for a Plan? +### 6. How can I access my Invoices/Receipts after I paid for a Plan? You can visit the _Billing Options & Invoices_ in the **Plan & Billing** section under settings in your Netdata Space where you can find all your Invoicing history. -#### 7. Why do I see two separate Invoices? +### 7. Why do I see two separate Invoices? Every time you purchase or renew a Plan, two separate Invoices are generated: @@ -81,15 +83,10 @@ Every time you purchase or renew a Plan, two separate Invoices are generated: - The other Invoice includes your monthly “On Demand - Usage”. - Right after the activation of your subscription, you will receive a zero value Invoice since you had no usage when you subscribed. + Right after the activation of your subscription, you will receive a zero value Invoice since you had no usage when you subscribed. On the following month you will receive an Invoice based on your monthly usage. You can find some further details on the [Netdata Plans page](https://github.com/netdata/netdata/blob/master/docs/cloud/manage/plans.md#plans). > ⚠️ We expect this to change to a single invoice in the future, but currently do not have a concrete timeline for when this change will happen. - - -#### Related topics - -- [Netdata Plans](https://github.com/netdata/netdata/blob/master/docs/cloud/manage/plans.md) diff --git a/docs/cloud/spaces.md b/docs/cloud/spaces.md index 9eee29198b..c1db566baf 100644 --- a/docs/cloud/spaces.md +++ b/docs/cloud/spaces.md @@ -1,4 +1,6 @@ -# Spaces +# Netdata Cloud Spaces + +Organize your multi-organization infrastructure monitoring on Netdata Cloud by creating Spaces to completely isolate access to your Agent-monitored nodes. A Space is a high-level container. It's a collaboration space where you can organize team members, access levels and the nodes you want to monitor. @@ -74,8 +76,3 @@ Netdata admin users now have the ability to remove obsolete nodes from a space. - If the obsoleted nodes eventually become live or online once more they will be automatically re-added to the space  - -## What's next? - -Once you configured your Spaces, it's time to set up -your [War Rooms](https://github.com/netdata/netdata/blob/master/docs/cloud/war-rooms.md). diff --git a/docs/cloud/visualize/interact-new-charts.md b/docs/cloud/visualize/interact-new-charts.md index 9e900f1f53..e6d86790f6 100644 --- a/docs/cloud/visualize/interact-new-charts.md +++ b/docs/cloud/visualize/interact-new-charts.md @@ -1,5 +1,7 @@ # Interact with charts +Learn how to use Netdata's powerful charts to troubleshoot with real-time, per-second metric data. + Netdata excels in collecting, storing, and organizing metrics in out-of-the-box dashboards. To make sense of all the metrics, Netdata offers an enhanced version of charts that update every second. diff --git a/docs/cloud/visualize/node-filter.md b/docs/cloud/visualize/node-filter.md index 90a005269d..889caaf876 100644 --- a/docs/cloud/visualize/node-filter.md +++ b/docs/cloud/visualize/node-filter.md @@ -1,16 +1,12 @@ # Node filter -The node filter allows you to quickly filter the nodes visualized in a War Room's views. -It appears on all views, except on single-node dashboards. +The node filter allows you to quickly filter the nodes visualized in a War Room's views. It appears on all views, except on single-node dashboards. Inside the filter, the nodes get categorized into three groups: - Live nodes Nodes that are currently online, collecting and streaming metrics to Cloud. - - Live nodes display - raised [Alert](https://github.com/netdata/netdata/blob/master/docs/monitor/view-active-alarms.md) counters, - [Machine Learning](https://github.com/netdata/netdata/blob/master/ml/README.md) availability, - and [Functions](https://github.com/netdata/netdata/blob/master/docs/cloud/netdata-functions.md) availability + - Live nodes display raised [Alert](https://github.com/netdata/netdata/blob/master/docs/monitor/view-active-alarms.md) counters, [Machine Learning](https://github.com/netdata/netdata/blob/master/ml/README.md) availability, and [Functions](https://github.com/netdata/netdata/blob/master/docs/cloud/netdata-functions.md) availability - Stale nodes Nodes that are offline and not streaming metrics to Cloud. Only historical data can be presented from a parent node. - For these nodes you can only see their ML status, as they are not online to provide more information diff --git a/docs/cloud/visualize/overview.md b/docs/cloud/visualize/overview.md index df9eece4ff..84638f0589 100644 --- a/docs/cloud/visualize/overview.md +++ b/docs/cloud/visualize/overview.md @@ -1,4 +1,6 @@ -# Home, overview and single node views +# Home, overview and single node tabs + +Learn how to use the Home, Overview, and Single Node tabs in Netdata Cloud, to explore your infrastructure and troubleshoot issues. ## Home @@ -7,7 +9,7 @@ The Home tab provides a predefined dashboard of relevant information about entit This tab will automatically present summarized information in an easily digestible display. You can see information about your nodes, data collection and retention stats, alerts, users and dashboards. -## Overview and single node view +## Overview and single node tab The Overview tab is another great way to monitor infrastructure using Netdata Cloud. While the interface might look similar to local dashboards served by an Agent Overview uses **composite charts**. @@ -16,8 +18,7 @@ These charts display real-time aggregated metrics from all the nodes (or a filte When you [interact with composite charts](https://github.com/netdata/netdata/blob/master/docs/cloud/visualize/interact-new-charts.md) you can see your infrastructure from a single pane of glass, discover trends or anomalies, and perform root cause analysis. -The Single Node view dashboard is exactly the same as the Overview, but with a hard-coded filter to only show -a single node. +The Single Node tab dashboard is exactly the same as the Overview, but with a hard-coded filter to only show a single node. ### Chart navigation Menu @@ -30,25 +31,18 @@ monitor an Apache web server, the **Apache** section still appears and displays One difference between the Netdata Cloud menu and those found in local Agent dashboards is that the Overview condenses multiple services, families, or instances into single sections, sub-menus, and associated charts. -For services, let's say you have two concurrent jobs with the -[web_log collector](https://github.com/netdata/go.d.plugin/blob/master/modules/weblog/README.md), one for Apache and -another for Nginx. A single-node or -local dashboard shows two section, **web_log apache** and **web_log nginx**, whereas the Overview condenses these into a +For services, let's say you have two concurrent jobs with the [web_log collector](https://github.com/netdata/go.d.plugin/blob/master/modules/weblog/README.md), one for Apache and another for Nginx. +A single-node or local dashboard shows two section, **web_log apache** and **web_log nginx**, whereas the Overview condenses these into a single **web_log** section containing composite charts from both jobs. -The Cloud also condenses multiple families or multiple instances into a single **all** sub-menu and associated -charts. For example, if Node A has 5 disks, and Node B has 3, each disk contributes to a single `disk.io` composite -chart. The utility bar should show that there are 8 charts from 2 nodes contributing to that chart. The aggregation applies -to disks, network devices, and other metric types that involve multiple instances of a piece of hardware or software. +The Cloud also condenses multiple families or multiple instances into a single **all** sub-menu and associated charts. +For example, if Node A has 5 disks, and Node B has 3, each disk contributes to a single `disk.io` composite chart. +The utility bar should show that there are 8 charts from 2 nodes contributing to that chart. +The aggregation applies to disks, network devices, and other metric types that involve multiple instances of a piece of hardware or software. ## Persistence of composite chart settings -Of course you can -[change the filtering or grouping](https://github.com/netdata/netdata/blob/master/docs/cloud/visualize/interact-new-charts.md) -of metrics in the composite charts that aggregate all these instances, to see only the information you are interested in, -and save that view in a custom dashboard. - -When you change a composite chart via its definition bar, Netdata Cloud persists these settings in a query string -attached to the URL in your browser. You can "save" these settings by bookmarking this particular URL, or share it with -colleagues by having them copy-paste it into their browser. +Of course you can [change the filtering or grouping](https://github.com/netdata/netdata/blob/master/docs/cloud/visualize/interact-new-charts.md) of metrics in the composite charts that aggregate all these instances, to see only the information you are interested in, and save that tab in a custom dashboard. +When you change a composite chart via its definition bar, Netdata Cloud persists these settings in a query string attached to the URL in your browser. +You can "save" these settings by bookmarking this particular URL, or share it with colleagues by having them copy-paste it into their browser. diff --git a/docs/cloud/war-rooms.md b/docs/cloud/war-rooms.md index 9460da5287..c10efcfa12 100644 --- a/docs/cloud/war-rooms.md +++ b/docs/cloud/war-rooms.md @@ -1,7 +1,6 @@ -# War rooms +# Netdata Cloud War rooms -War Rooms organize your connected nodes and provide infrastructure-wide dashboards using real-time metrics and -visualizations. +Netdata Cloud uses War Rooms to organize your connected nodes and provide infrastructure-wide dashboards using real-time metrics and visualizations. Once you add nodes to a Space, all of your nodes will be visible in the **All nodes** War Room. This is a special War Room which gives you an overview of all of your nodes in this particular Space. Then you can create functional separations of diff --git a/docs/dashboard/visualization-date-and-time-controls.md b/docs/dashboard/visualization-date-and-time-controls.md index d0710e8f28..99e4c308ec 100644 --- a/docs/dashboard/visualization-date-and-time-controls.md +++ b/docs/dashboard/visualization-date-and-time-controls.md @@ -1,5 +1,9 @@ # Visualization date and time controls +Netdata's dashboard features powerful date visualization controls that include a time control, a timezone selector and a rich date and timeframe selector. + +The controls come with useful defaults and rich customization, to help you narrow your focus when troubleshooting issues or anomalies. + ## Time controls The time control provides you the following options: **Play**, **Pause** and **Force Play**. @@ -17,7 +21,6 @@ Main use cases for **Force Play**: 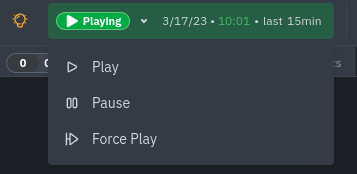 - ## Date and time selector The date and time selector allows you to change the visible timeframe and change the timezone used in the interface. @@ -78,7 +81,6 @@ beyond stored historical metrics, you'll see this message: 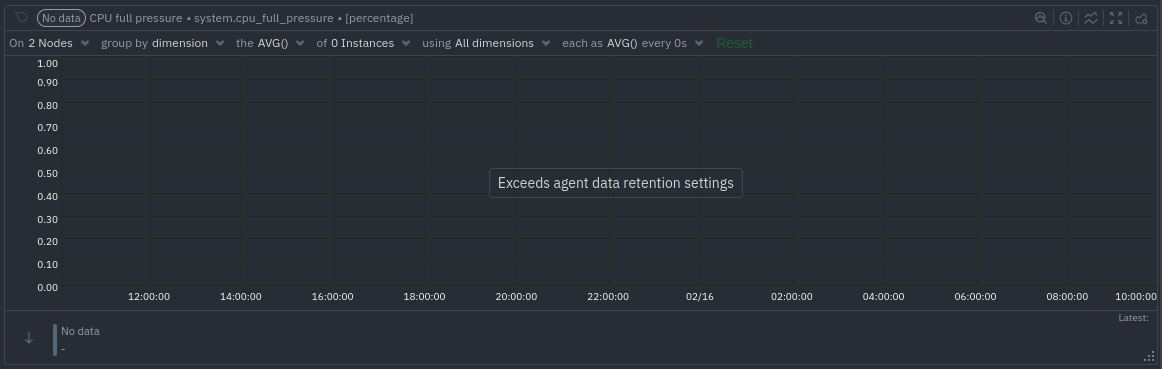 - At any time, [configure the internal TSDB's storage capacity](https://github.com/netdata/netdata/blob/master/docs/store/change-metrics-storage.md) to expand your depth of historical metrics. diff --git a/docs/getting-started/introduction.md b/docs/getting-started/introduction.md index 83139252f0..b164074bd3 100644 --- a/docs/getting-started/introduction.md +++ b/docs/getting-started/introduction.md @@ -1,4 +1,6 @@ -# Getting started +# Getting started with Netdata + +Learn how Netdata can get you monitoring your infrastructure in minutes. ## What is Netdata ? @@ -12,34 +14,34 @@ Netdata is: ### Simple to deploy -- **One-line deployment** for Linux distributions, plus support for Kubernetes/Docker infrastructures. -- **Zero configuration and maintenance** required to collect thousands of metrics, every second, from the underlying +- **One-line deployment** for Linux distributions, plus support for Kubernetes/Docker infrastructures. +- **Zero configuration and maintenance** required to collect thousands of metrics, every second, from the underlying OS and running applications. -- **Prebuilt charts and alarms** alert you to common anomalies and performance issues without manual configuration. -- **Distributed storage** to simplify the cost and complexity of storing metrics data from any number of nodes. +- **Prebuilt charts and alarms** alert you to common anomalies and performance issues without manual configuration. |